The MSactivator™ is an Integrated Automation Platform, which consists of several components running on Docker containers.
Overview of the platform
-
The MSactivator™ API server: this server provides a REST API layer on top of all the functions, it also provides the Workflow Engine responsible for executing the automated processes
-
The MSactivator™ Core Engine: this component, composed of several daemons is responsible for the configuration of the Managed Entities, the assurance and collecting the syslogs.
-
A PostgreSQL database: the MSactivator™ stores its state in a PostgreSQL database.
-
An Elasticsearch cluster: the MSactivator™ collects and stores the events and the alarms in an Elasticsearch server.
-
A BPM engine based on Camunda, fully integrated with Workflow Engine.
-
A Subversion based server to store the history of the configurations of the Managed Entities
-
REST API and UI: To control the MSactivator™, you can use either the web based interface or the REST API.
Overview of the docker containers
Containers description
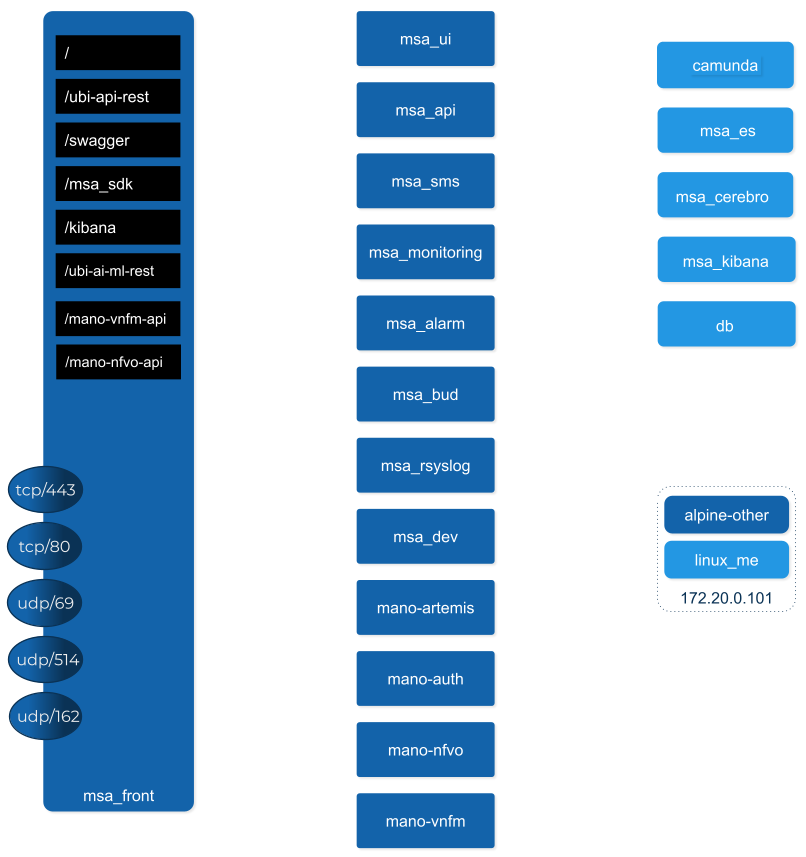
msa-front
Runs NGINX and act as the front end to route the requests to the internal containers.
The NGINX server is configured with a self-signed SSL certificate to allow HTTPS connection. When you access the UI for the first time after the installation of the product, your browser will problably show a warning message and you will have to accept this certificate to access the web UI.
msa-ui
Runs the MSactivator™ web based interface. On a local setup you can connect to the UI with https://localhost.
msa-api
Runs the REST API on a Wildfly based container.
This container is in charge of exposing the REST API used by the web UI, the workflows or any other third party tool willing to integrate with the MSactivator™.
msa_api also runs all the business logic such as the scheduling of the workflow and the BPM execution, the execution of the microservice logic,…
This container is also taking care of the token based authentication
msa-sms
Runs the CoreEngine for configuration and assurance of the managed entities.
This container is in charge of getting the microservice request for configuration and transforming them, by making use of the relevant adapter, into the managed entity management language (specific CLI command, REST API,…)
This container will also poll the device for assurance KPI and collect/analyse the syslogs sent by the managed entities.
msa-monitoring
In charge of monitoring the managed entities either based on default KPI (ICMP and/or SNMP) or on custom monitoring profile as well as executing the asset management scripts provided by the adapters.
msa-alarm
Takes care of event detection to create alarm and execute workflow or send email notifications
msa-bud
Takes care of cross table data synchronization and consistency in the database
msa-rsyslog
In charge of collecting syslogs and SNMP traps and forward them to the msa-sms for parsing
msa-dev
A linux based container used for storing the assets shared across containers such as microservices, workflows, adapters code,…
This is the container you need to use for your own devOps related work such as installing a new adapter, pulling or pushing code to a git repository, installing some new workflow or microservices from a git repository,…
camunda
Runs the BPM engine
msa-ai-ml
Runs the AI engine (prototype - not supported in current version)
msa-es, msa-cerebro and msa-kibana
Run the Elasticsearch container, Cerebro and Kibana.
db
Runs the PostgreSQL database when the MSactivator™ administrative data and configuration data is stored.
alpine-other, linux-me
Additional containers for testing, prototyping and training
Networking and connectivity
Incoming traffic
By default the whole network traffic coming from external systems goes through the msa_front container, this includes proxying the TCP/443 and TCP/80 traffic access to:
-
/: Manager and Developer portal running on containermsa_ui -
/ubi-api-rest: REST API running in containermsa_api -
/kibana: Kibana running in containermsa_kibana -
/swaggerREST API Swagger documentation and/msa_sdkWorkflow Python SDK documentation are both inmsa_frontcontainer
It also includes the network traffic coming from the managed entities:
-
syslog coming from managed entities on port udp/514
-
SNMP traps coming from managed entities or a third party OSS element on port udp/162
-
TFTP request coming from managed entities or a third party OSS element on port udp/69
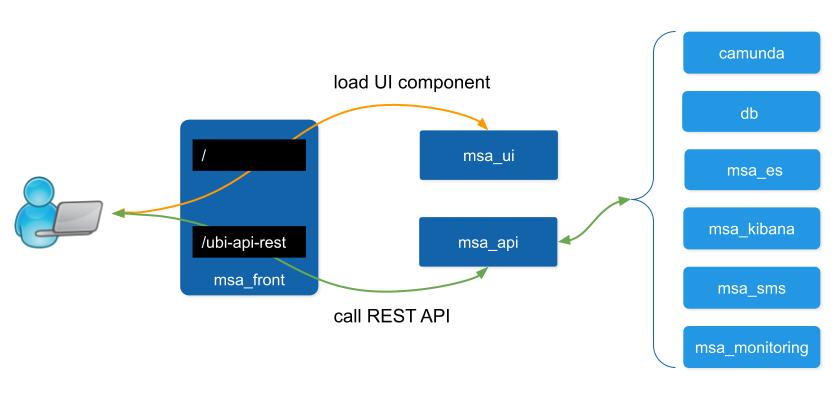
Ingress traffic
Ingress traffic is mainly composed by traffic coming from the end user browser accessing the web portal or by external third party system calling the REST API. Ingress traffic also includes traffic coming from managed entities sending syslogs or SNMP traps.
Web portal use
When an user browser accesses the web UI, all requests coming from the browser will be redirected to the REST API container (/ubi-api-rest).
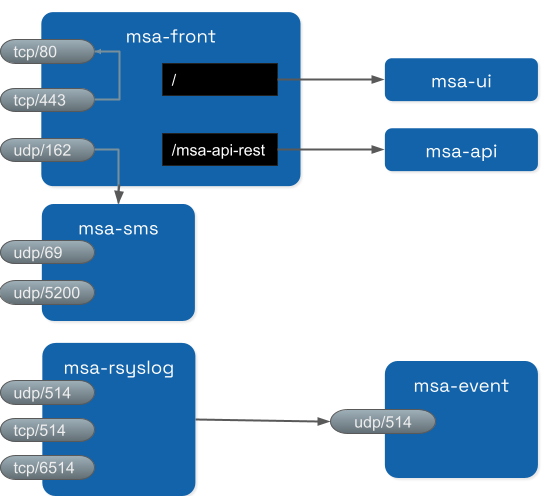
-
BPM executions are proxied by the container msa_api to the
camundacontainer. -
Log and alarm search queries are proxied by the container msa_api to the
msa_escontainer. -
Actions related to the managed entities are proxied by the container msa_api to the
msa_smsormsa_monitoringcontainers.
Managed entities
Network packet incoming flow
Entity management includes the activation, microservice configuration and import, monitoring syslog collection and alarm triggering.
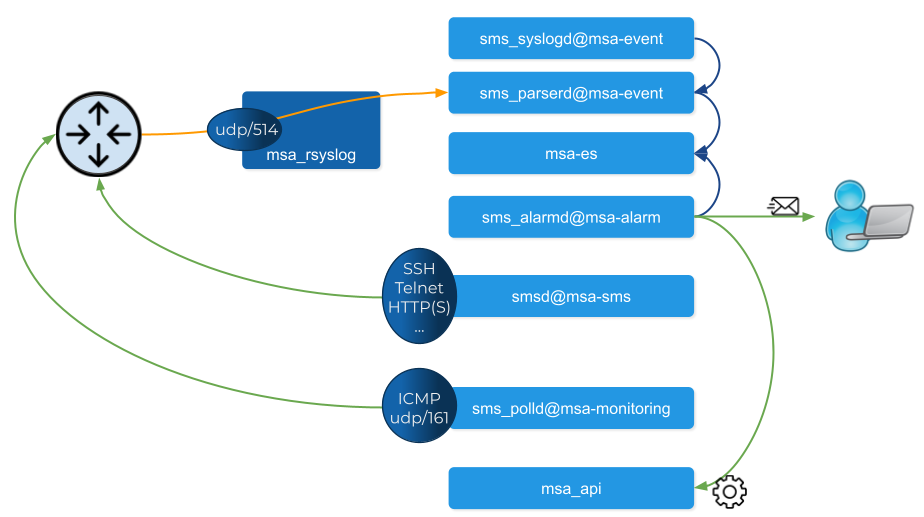
Activation and configuration
Activation (aka initial provisioning) usually includes a verification of the connectivity between the msa_sms container and the managed entity.
Depending on the vendor and model, the protocol used for the connection usually varies between SSH, Telnet or HTTP/HTTPS (this distinction is done at the adapter layer).
The configuration based on microservices is usually based on the same protocol as the initial connection.
The actions related to configuring the managed entities or pull its configurations are handled by the process smsd running in the msa_sms container
Monitoring
KPI monitoring is based on ICMP for the availability as well as SNMP (UDP/161) requests for the other KPI (traffic, CPU, memory,…).
The monitoring process is sms_polld, running in msa_monitoring container.
Events
Syslog are collected on the port 514 exposed by msa-rsyslog container and forwarded to the container msa_event.
In msa_event, the syslogs are processed by 2 processes: msa_syslogd and msa_parserd.
Alarms
The alarm definition stored in the database are used by the process sms_alarmd in msa_alarm container.
This process identifies the logs that should trigger an alarm it will create a new alarm in a dedicated Elasticsearch index in msa_es container.
Based on the alarm definition, the process will send an email to the end user and/or execute a workflow by call a REST API in msa_api container.
Volumes and data
In order to persist the data, the MSactivator™ uses docker volumes:
These volumes are declared at the end of the docker-compose file:
volumes:
  msa_api:          (1)
  msa_db:           (2)
  msa_dev:          (3)
  msa_entities:     (4)
  msa_repository:   (5)
  msa_es:           (6)
  msa_api_logs:     (7)
  msa_sms_logs:     (8)
  msa_bud_logs:     (9)
  mano_db:          (10)
  mano_nfvo:        (11)
  mano_vnf:         (12)
| 1 | volume shared by the containers msa_api and msa_dev to store the adapter configuration for the UI |
| 2 | database volume used by the container db |
| 3 | volume shared by the containers msa_dev and msa_sms, used to store the adapter git repository. This is where you can store your other DevOps related files. |
| 4 | volume shared by the containers msa_dev, msa_api and msa_sms, used to store the associations between the managed entities and the deployment settings as well as the subtenants and the workflows |
| 5 | volume shared by the containers msa_dev, msa_api and msa_sms, used to store the sources of the microservices, the workflows, the BMP,… |
| 6 | volume used by Elasticsearch to store the indexed data. |
| 7 | volume for storing API and workflow process logs |
| 8 | volume for storing CoreEngine logs |
| 9 | volume for storing Batchupdated daemon logs |
| 10 | volume for mano database |
| 11 | volume to persist nfvo files |
| 12 | volume to persist vnf viles |