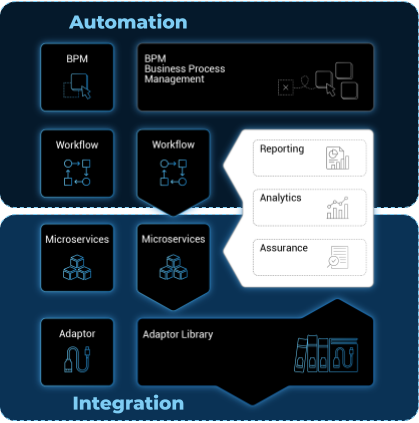
The MSactivator™ provides an assurance module for collecting network events and managing alarms
All the events sent by the managed or monitored entities are collected, indexed and analyzed centrally.
Monitoring profiles
Overview
You can configure and monitor your KPI with the monitoring profiles.
A monitoring profiles is a way to configure a set of SNMP based KPI, to configure threshold crossing based alarms and build graphs to display the KPI.
A monitoring profile has to be associated to one or more managed entity(ies) and a managed entity can also be associated to several monitoring profile(s).
Create or edit a monitoring profile
You can create a monitoring profile by browsing to the "Infrastructure" menu and selecting the tab "Monitoring Profiles" and clicking "+ Create Monitoring profile".
A monitoring profile is made out of 2 parts: the SNMP polling and the graphical rendering. Although SNMP polling is mandatory to have the MSactivator™ poll for the KPI, the graphical rendering is optional.
SNMP polling
Click "+ Add Rule" to add a new KPI.
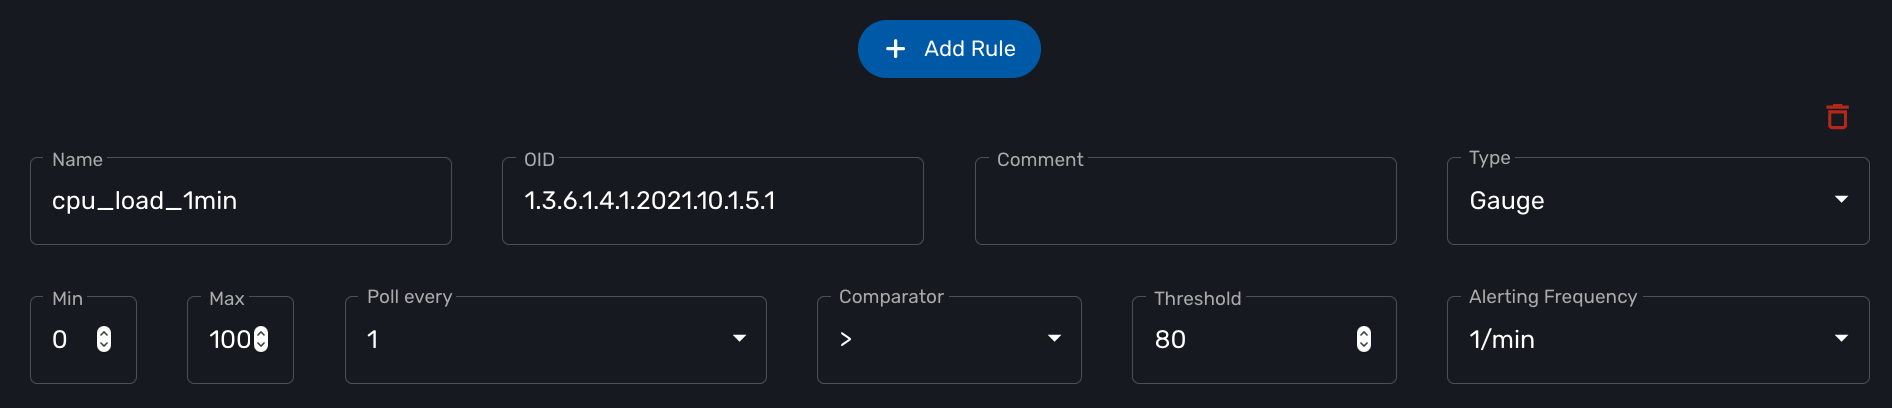
The name will be used internally to identify the KPI in the KPI database and in the UI to build the graphical rendering.
The MIB OID to read to get the value of the KPI.
Select Gauge or Counter (see below for detail on this field).
For gauge, the max value will be used to trim any KPI value to the value set as max.
Default is to poll for the KPI every minute but it possible to set a lower frequency for KPI that are less critical for instance.
Configure an alarm based on threshold crossing (for instance if the CPU goes over 80%). See below for more details
Gauge or Counter
The rrd graph rendering will be different for counter or for gauge.
For a gauge the value of the record is the value on the graph.
For a counter a value in the graph is calculated with the difference between two consecutive records divided by the period of time. In other words a rrd counter will convert the input into a rate.
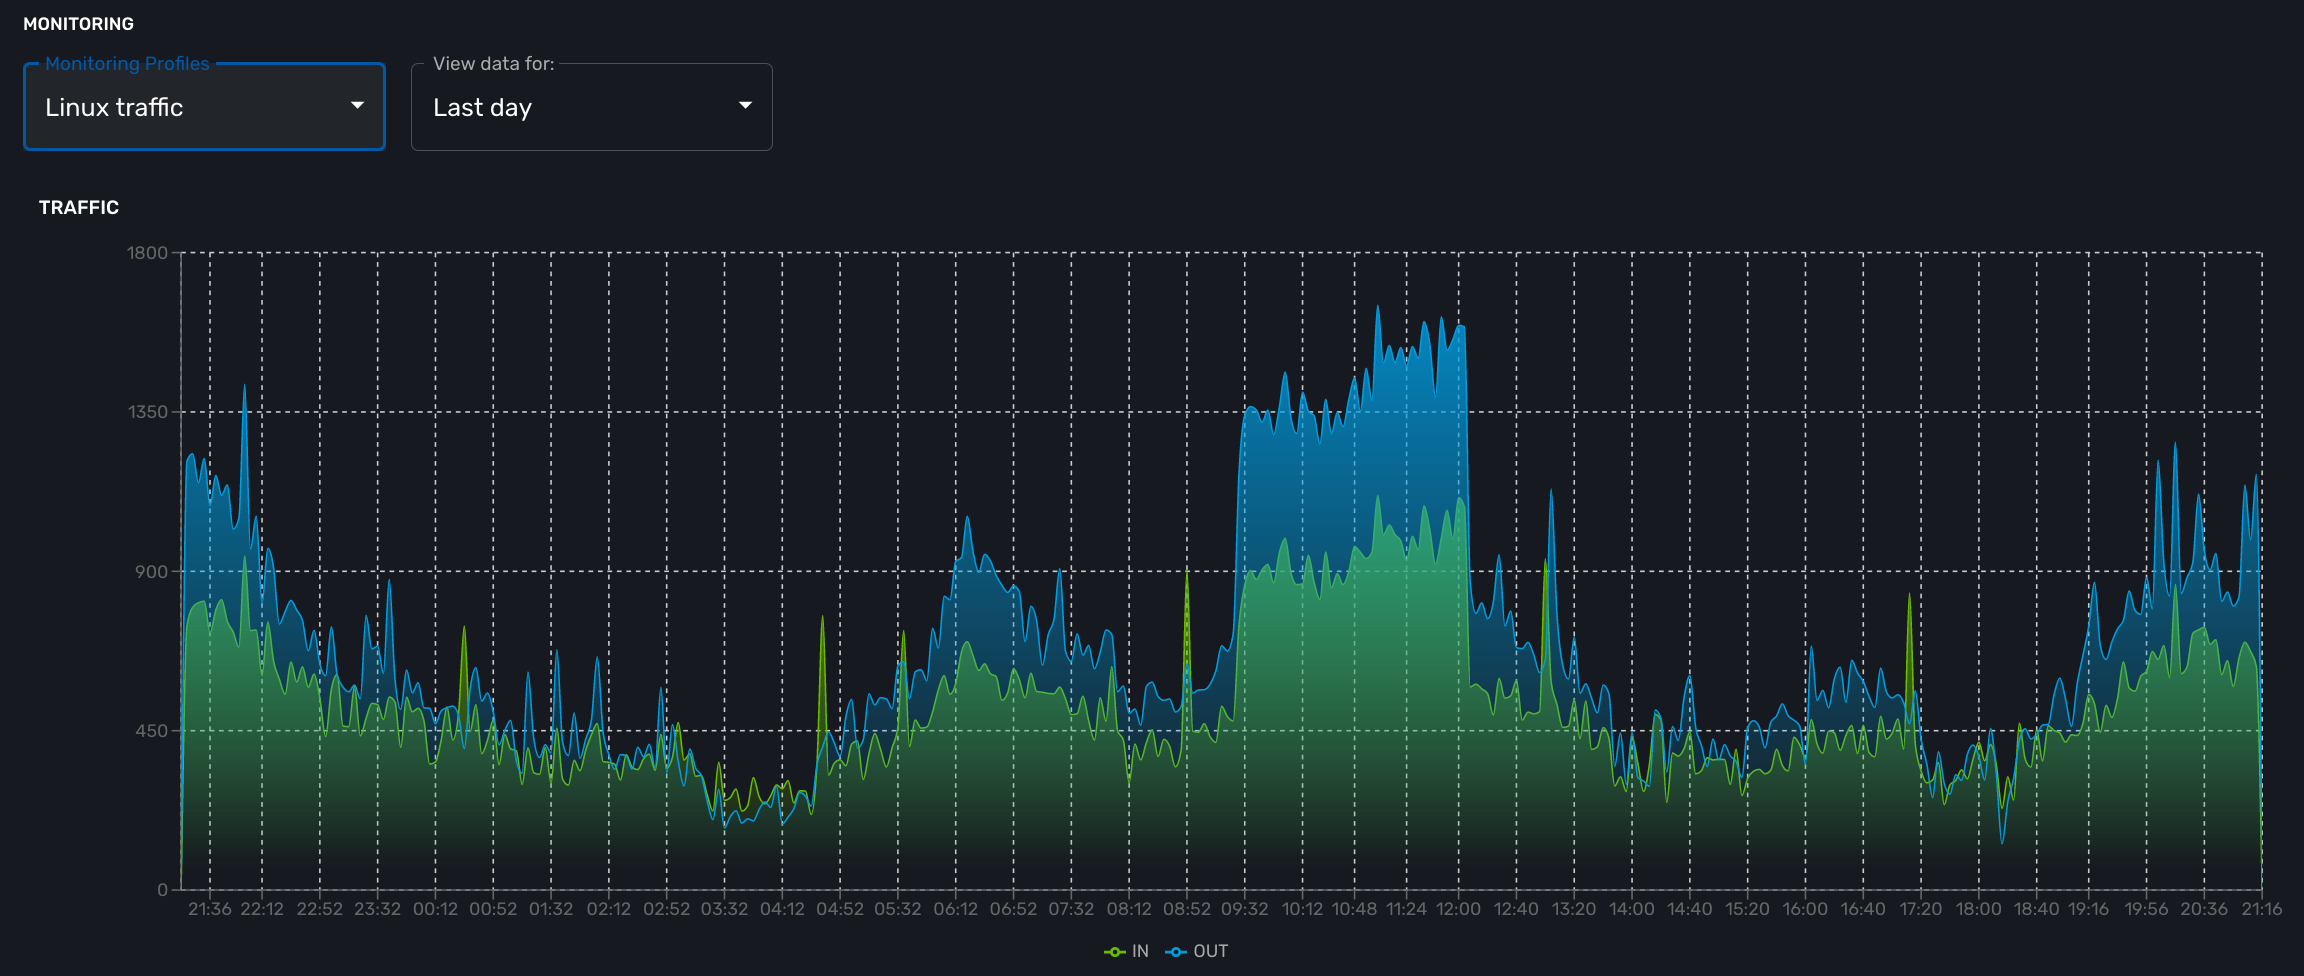
For example, if you monitor network traffic on an interface you need to use counter because the MIB stores the total traffic that went through the interface and what you want to see in the graph is actually the traffic rate and see how it evolves in time
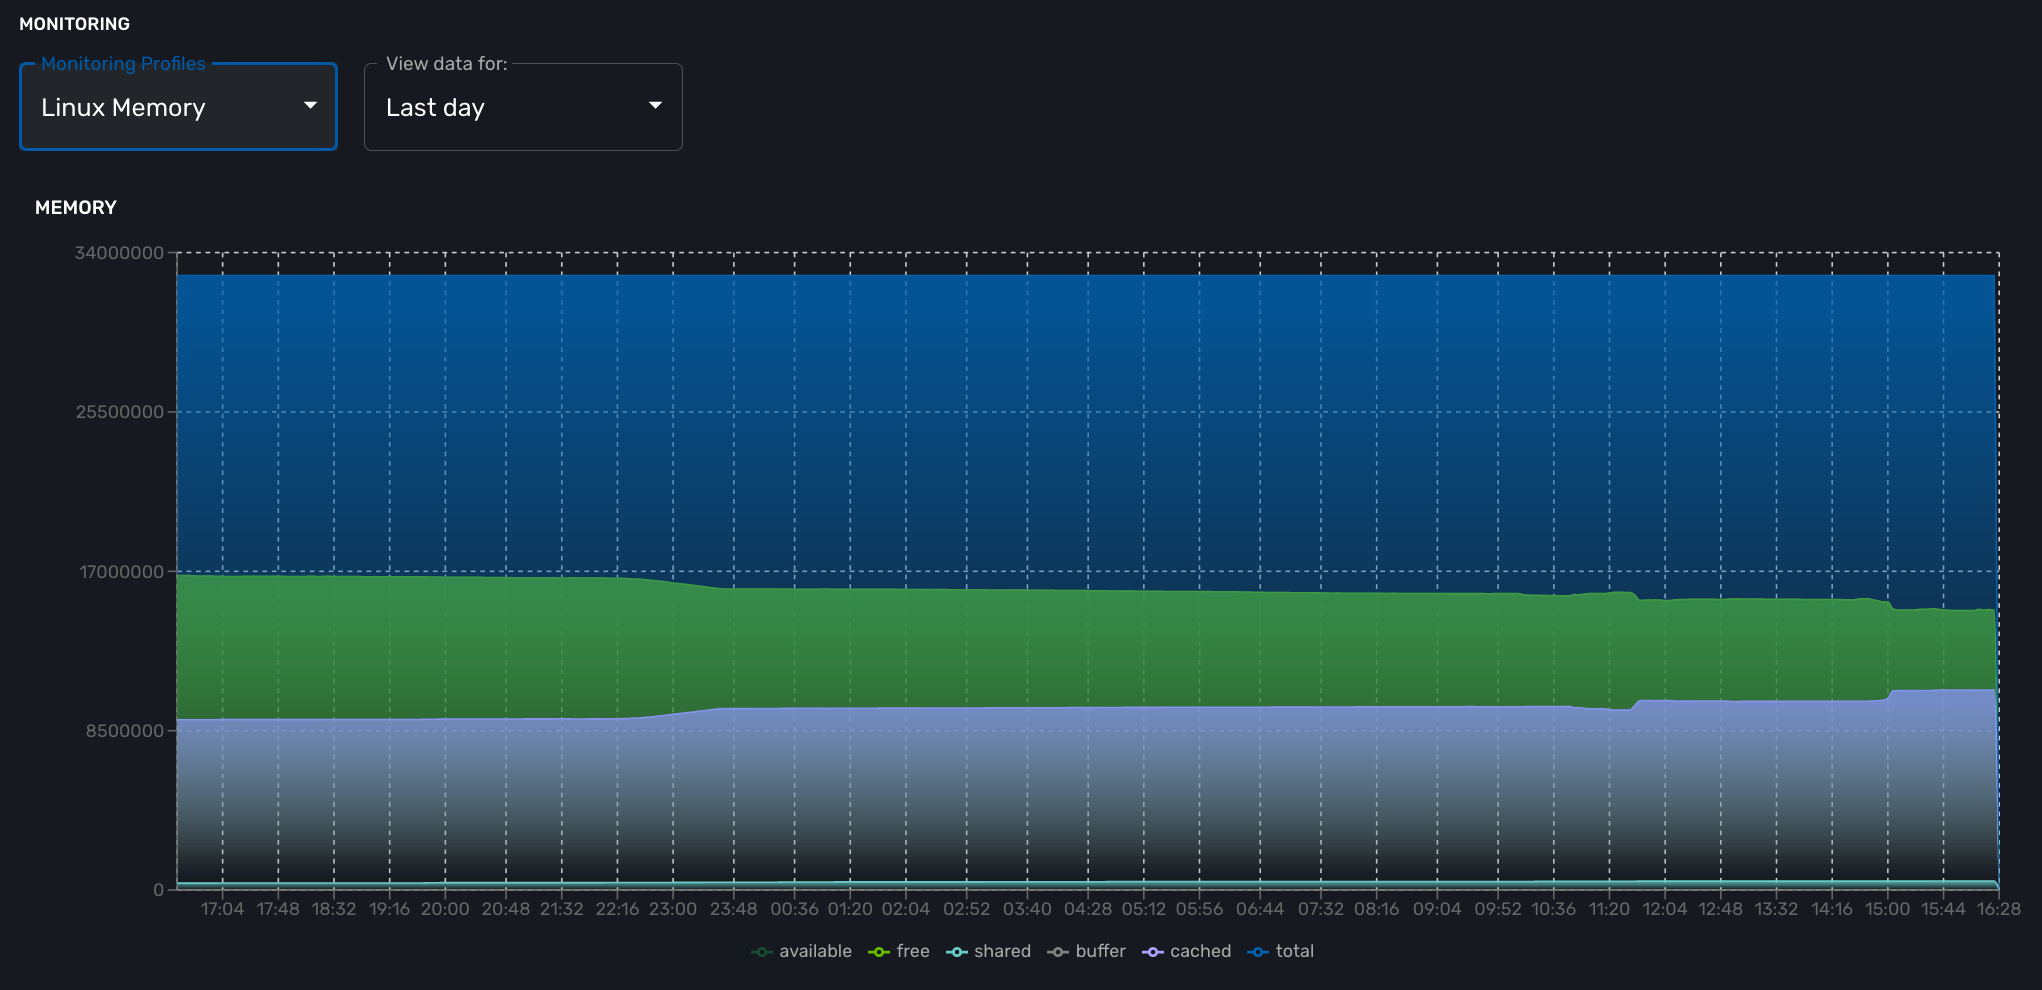
If you monitor the CPU usage, or the memory usage, you need to select a gauge because the MIB stores the actual value of the KPI.
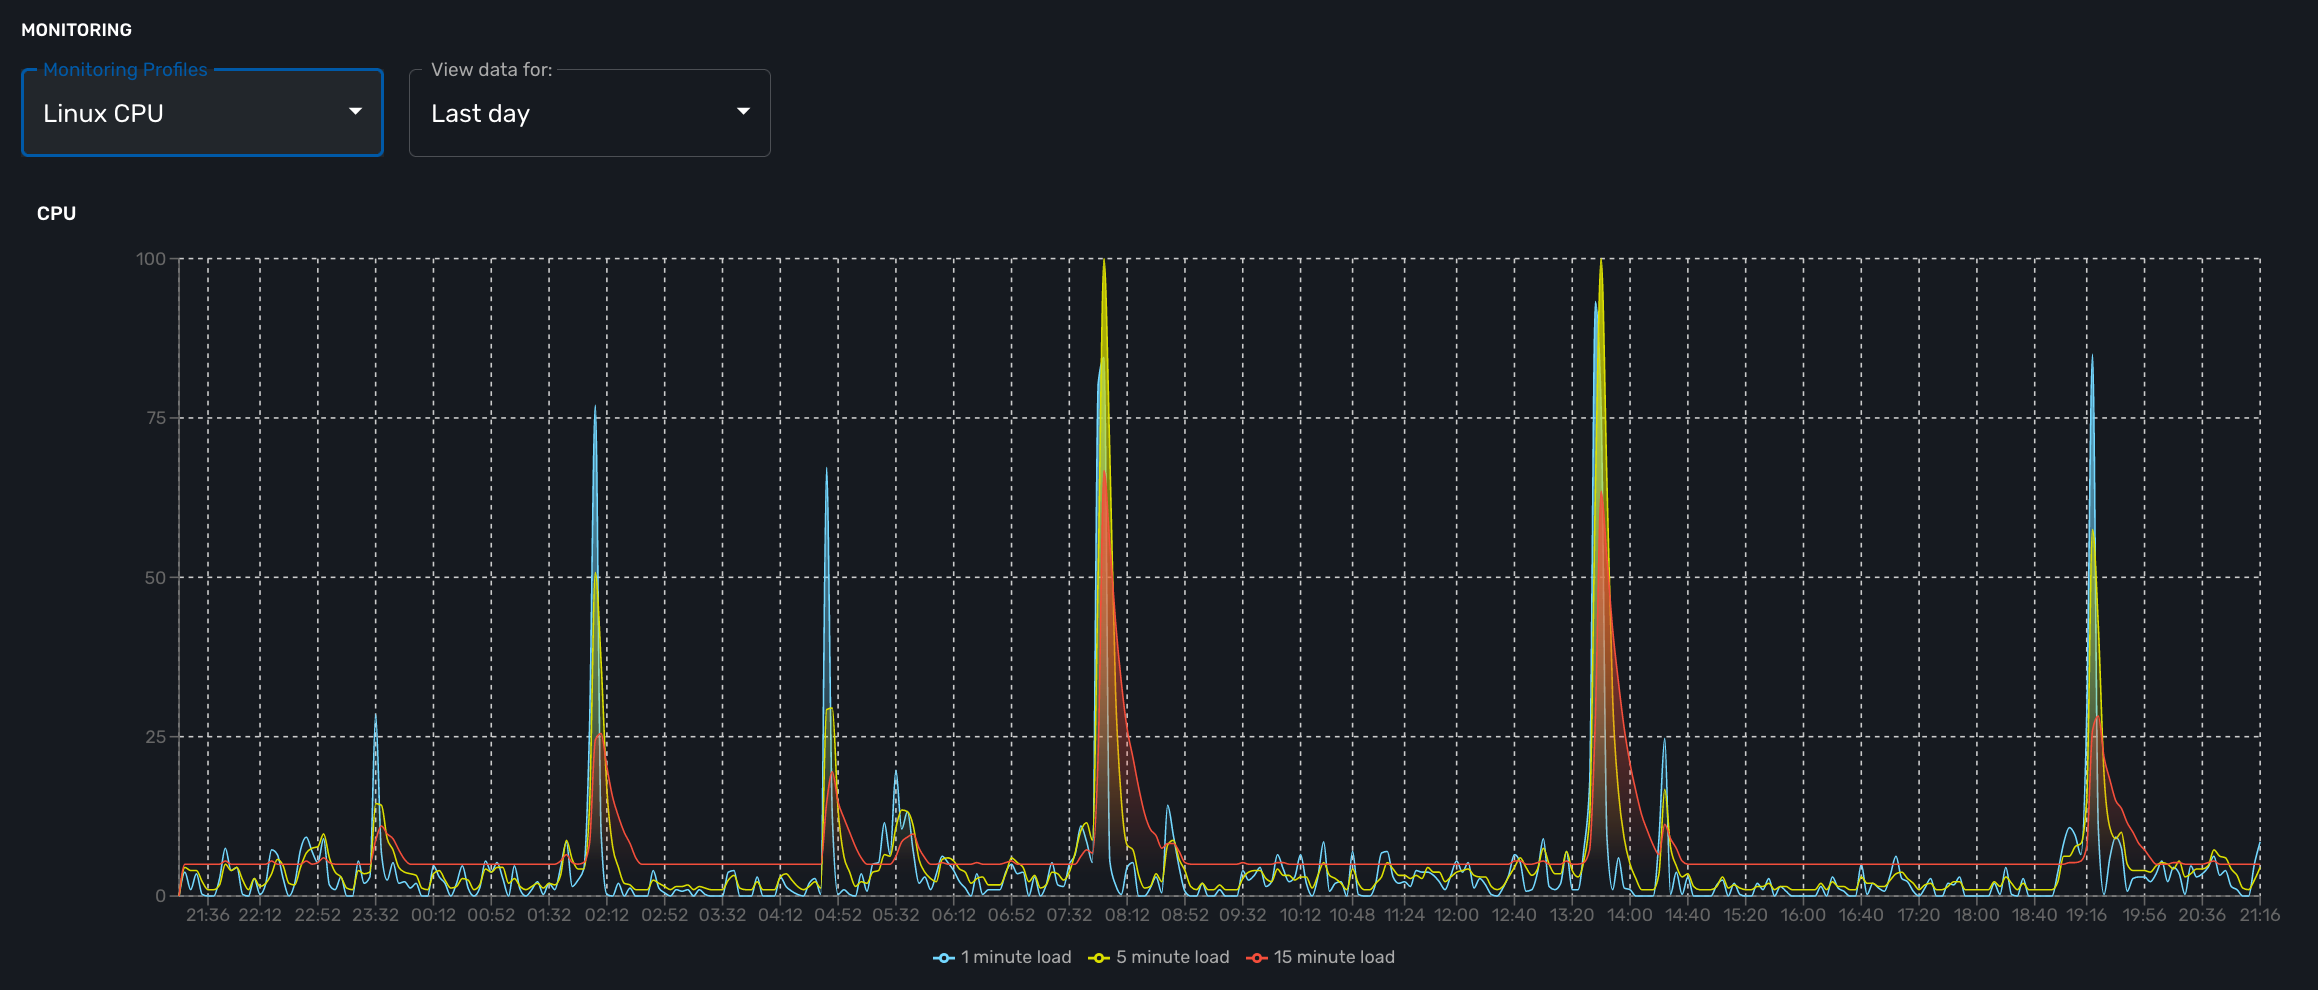
cpu_load_1min : 1.3.6.1.4.1.2021.10.1.5.1 (Gauge)
cpu_load_5min : 1.3.6.1.4.1.2021.10.1.5.2 (Gauge)
cpu_load_15min : 1.3.6.1.4.1.2021.10.1.5.3 (Gauge)
memAvailReal : .1.3.6.1.4.1.2021.4.6.0 (Gauge)
memTotalFree : .1.3.6.1.4.1.2021.4.11.0 (Gauge)
memShared : .1.3.6.1.4.1.2021.4.13.0 (Gauge)
memBuffer : .1.3.6.1.4.1.2021.4.14.0 (Gauge)
memCached : .1.3.6.1.4.1.2021.4.15.0 (Gauge)
memTotalReal : .1.3.6.1.4.1.2021.4.5.0 (Gauge)
traffic_in : 1.3.6.1.2.1.2.2.1.10.2 (Counter)
traffic_out : 1.3.6.1.2.1.2.2.1.16.2 (Counter)
Threshold based VNOC events
Is is possible to configure VNOC events based on KPI threshold crossing.
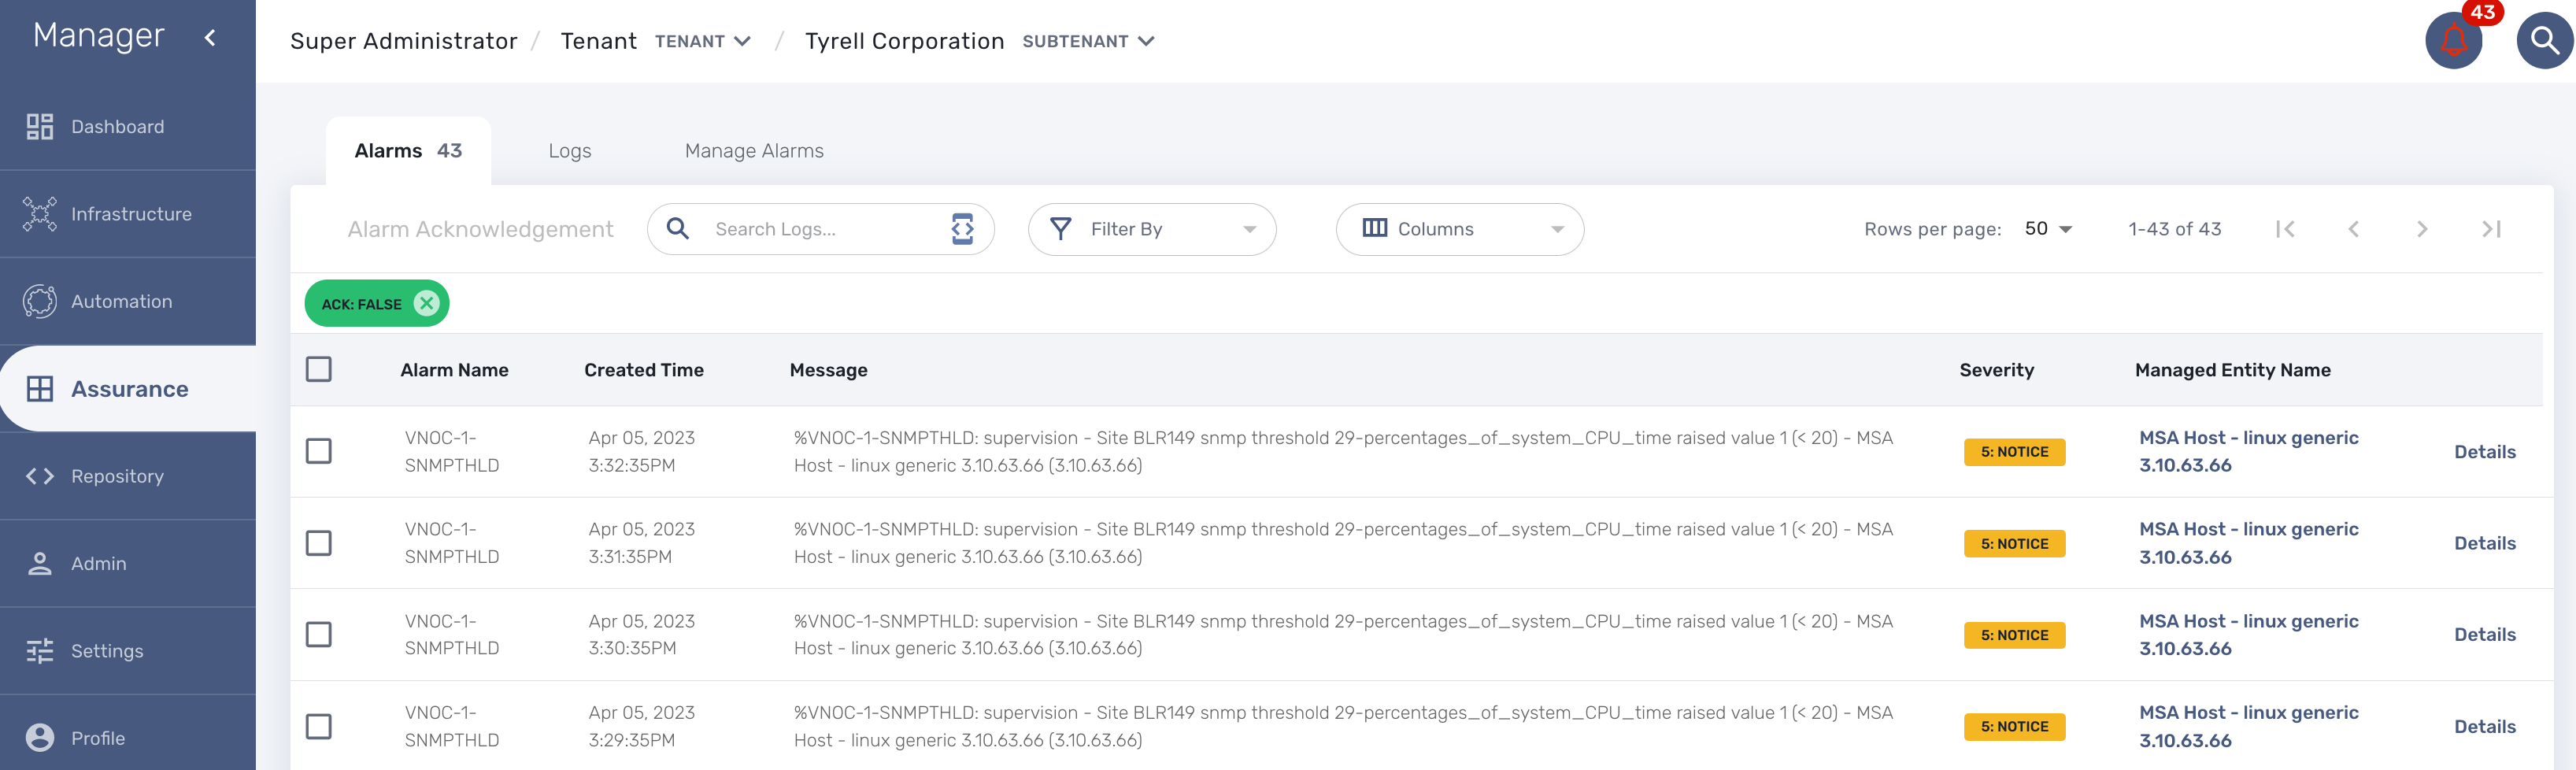
This is useful to monitor resources such as CPU or memory consumption. When a KPI crosses a threshold and event is generated and visible in the assurance "Logs" section.
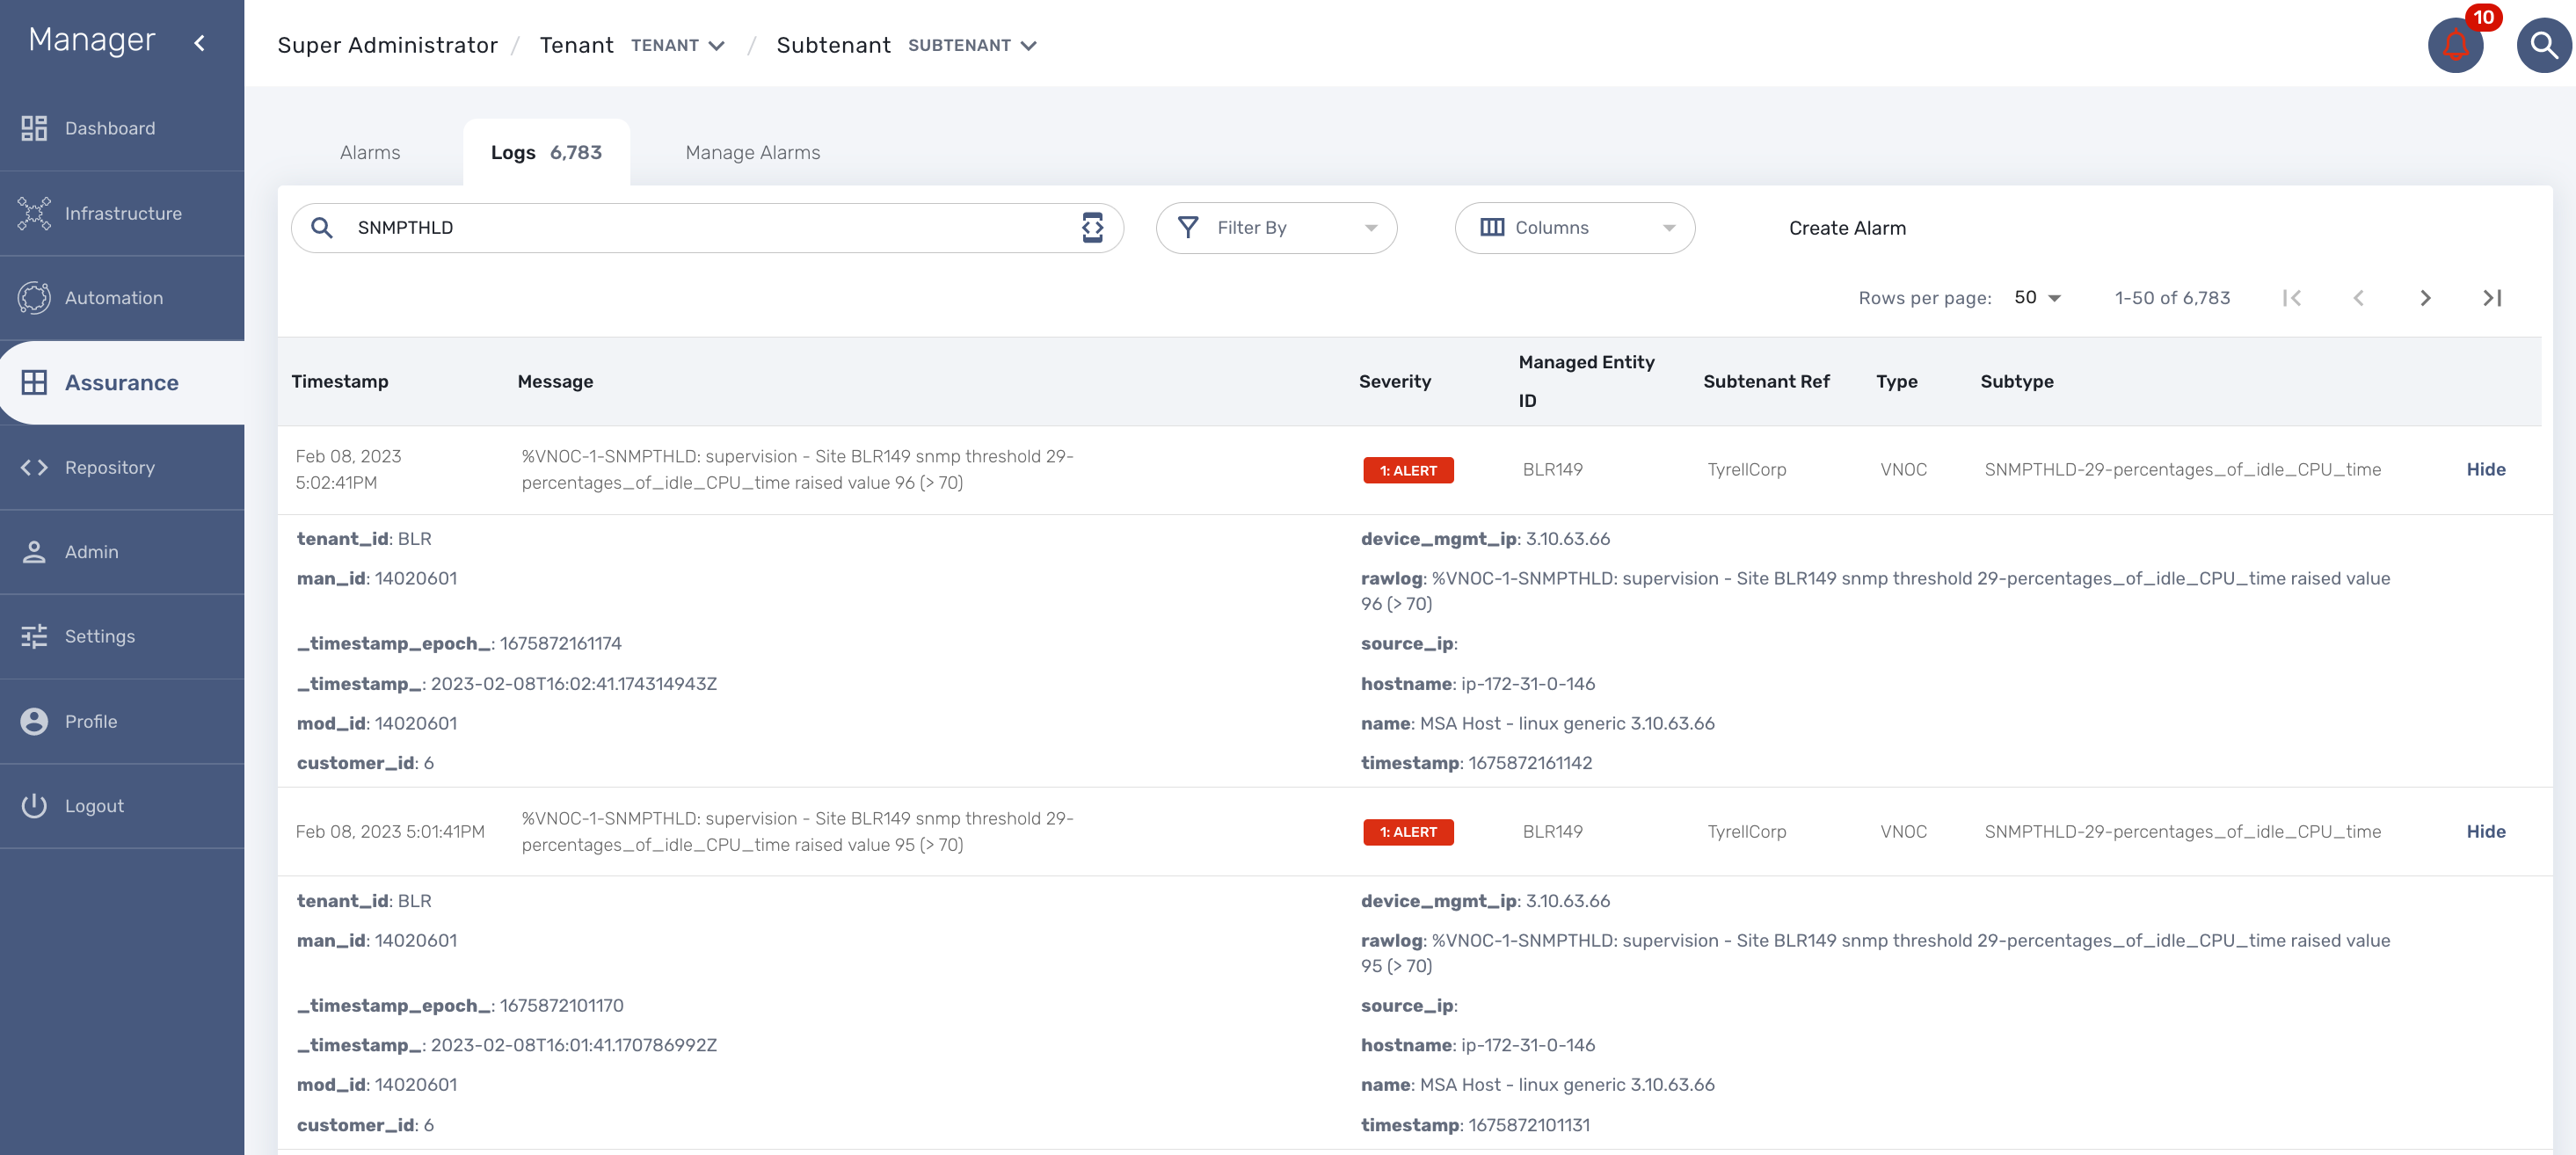
When a monitoring threshold is crossed the log message will be similar to "%VNOC-1-SNMPTHLD: supervision - Site BLR126 snmp threshold 31-cpu_load_1min raised value 173 (> 10)" where you can see that the threshold 10 has been crossed by a greater value 69.
This configuration is done at the SNMP polling rule in the monitoring profile by setting a comparator '>' or '<' and a threshold.
VNOC threshold crossing events can be used to configure alarms in order to be notified by email or SNMP trap or simply by the alarm bell icon on the top right of the screen.
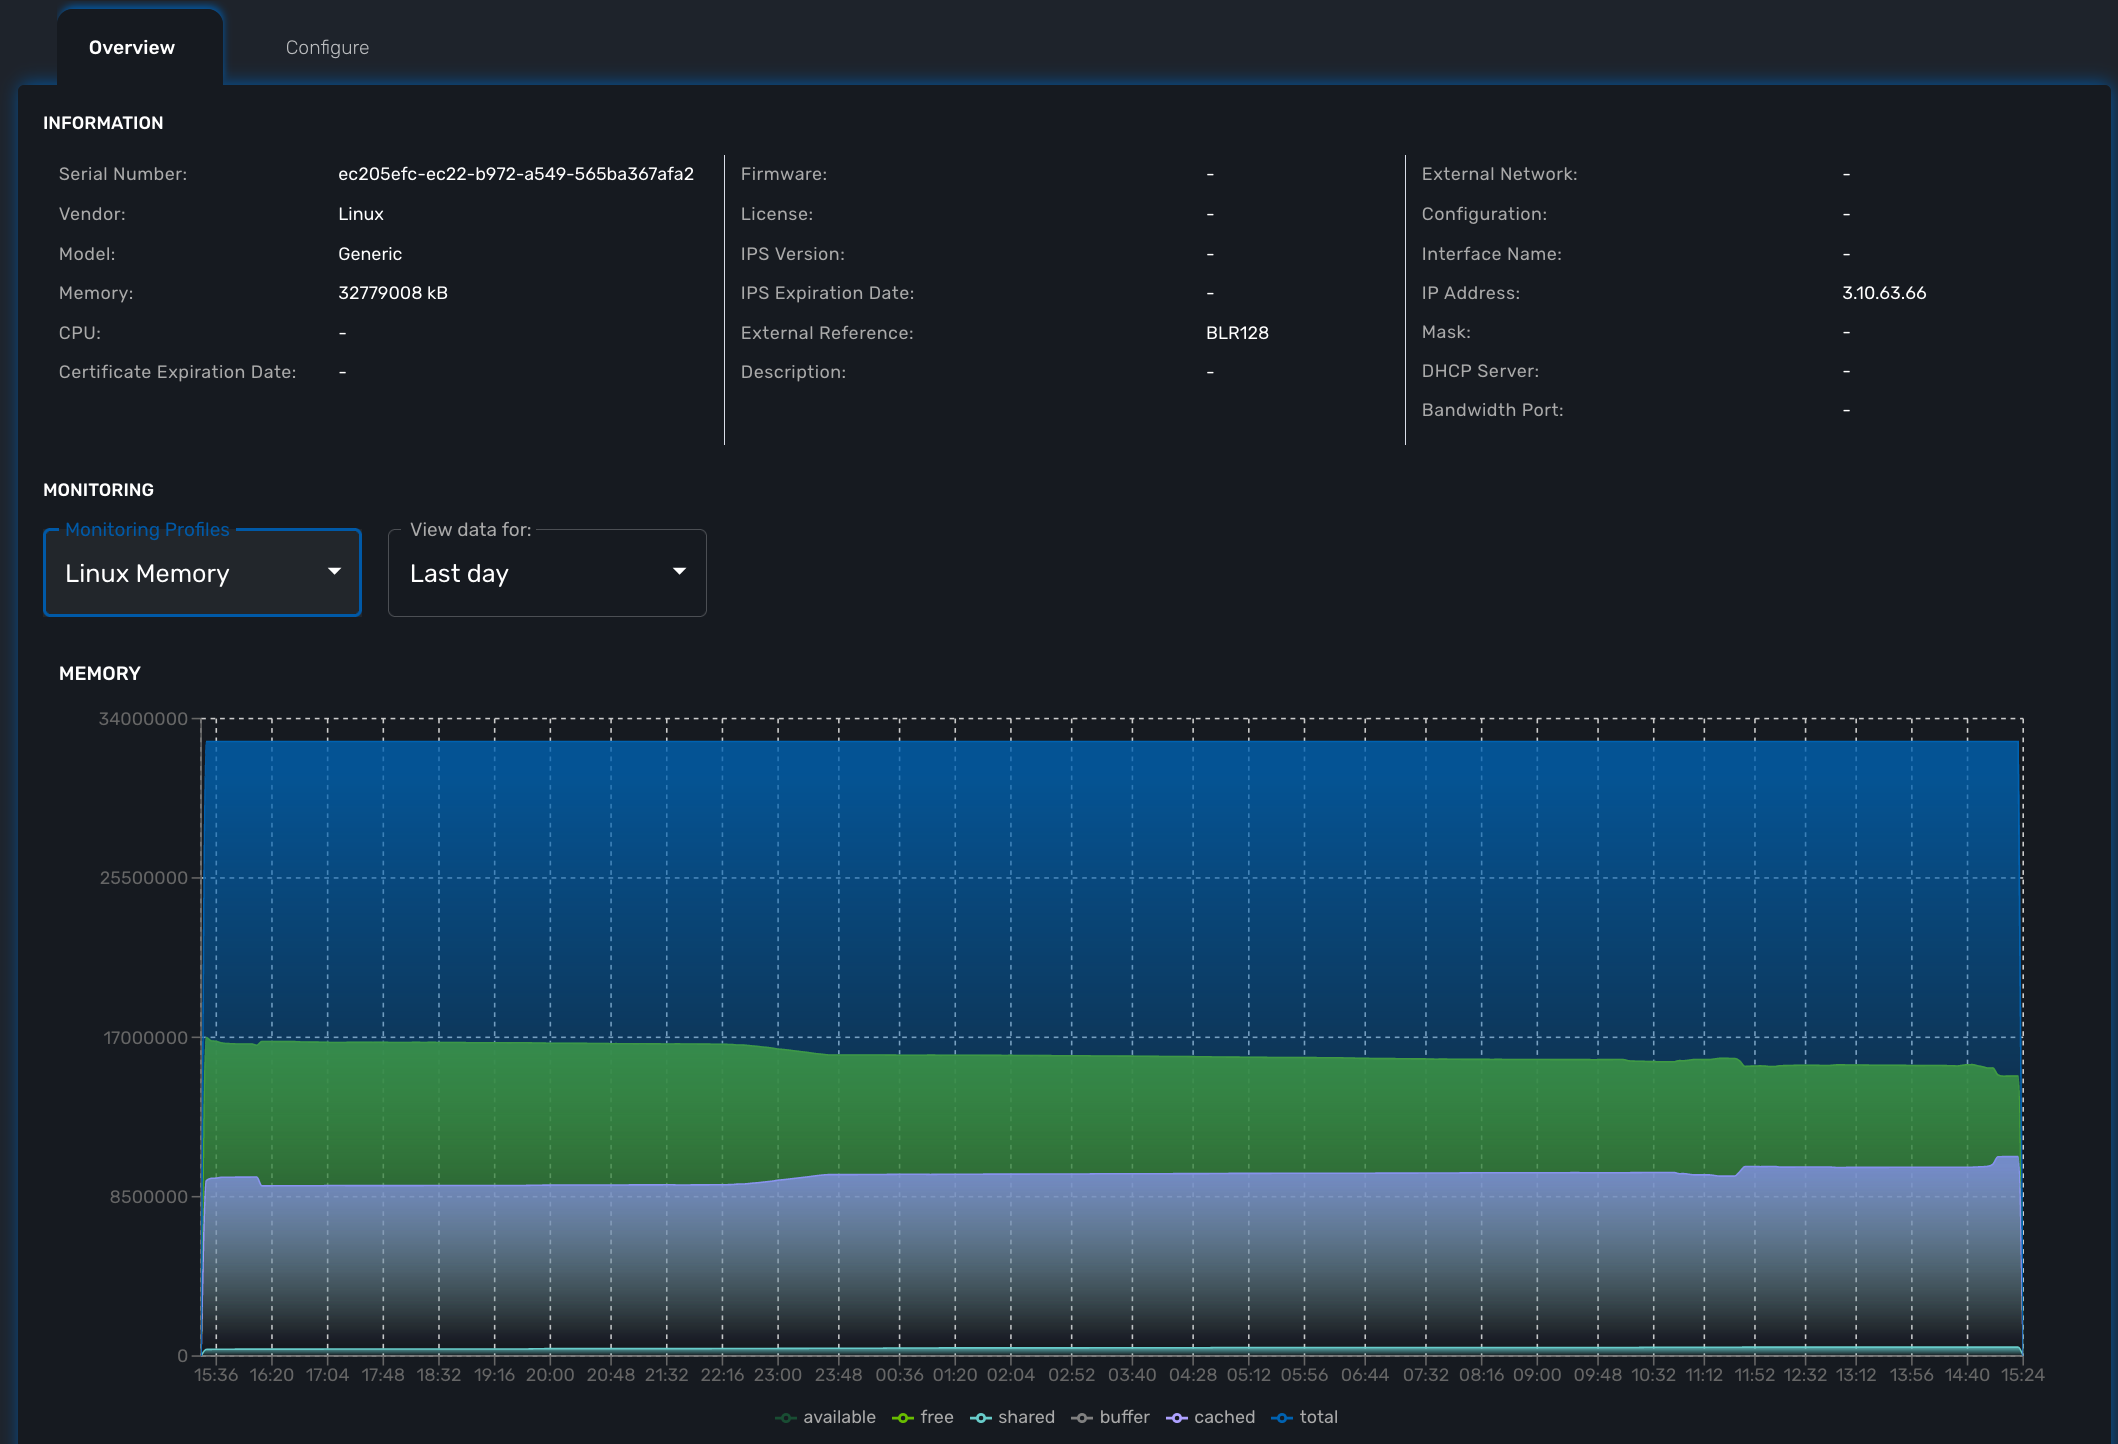
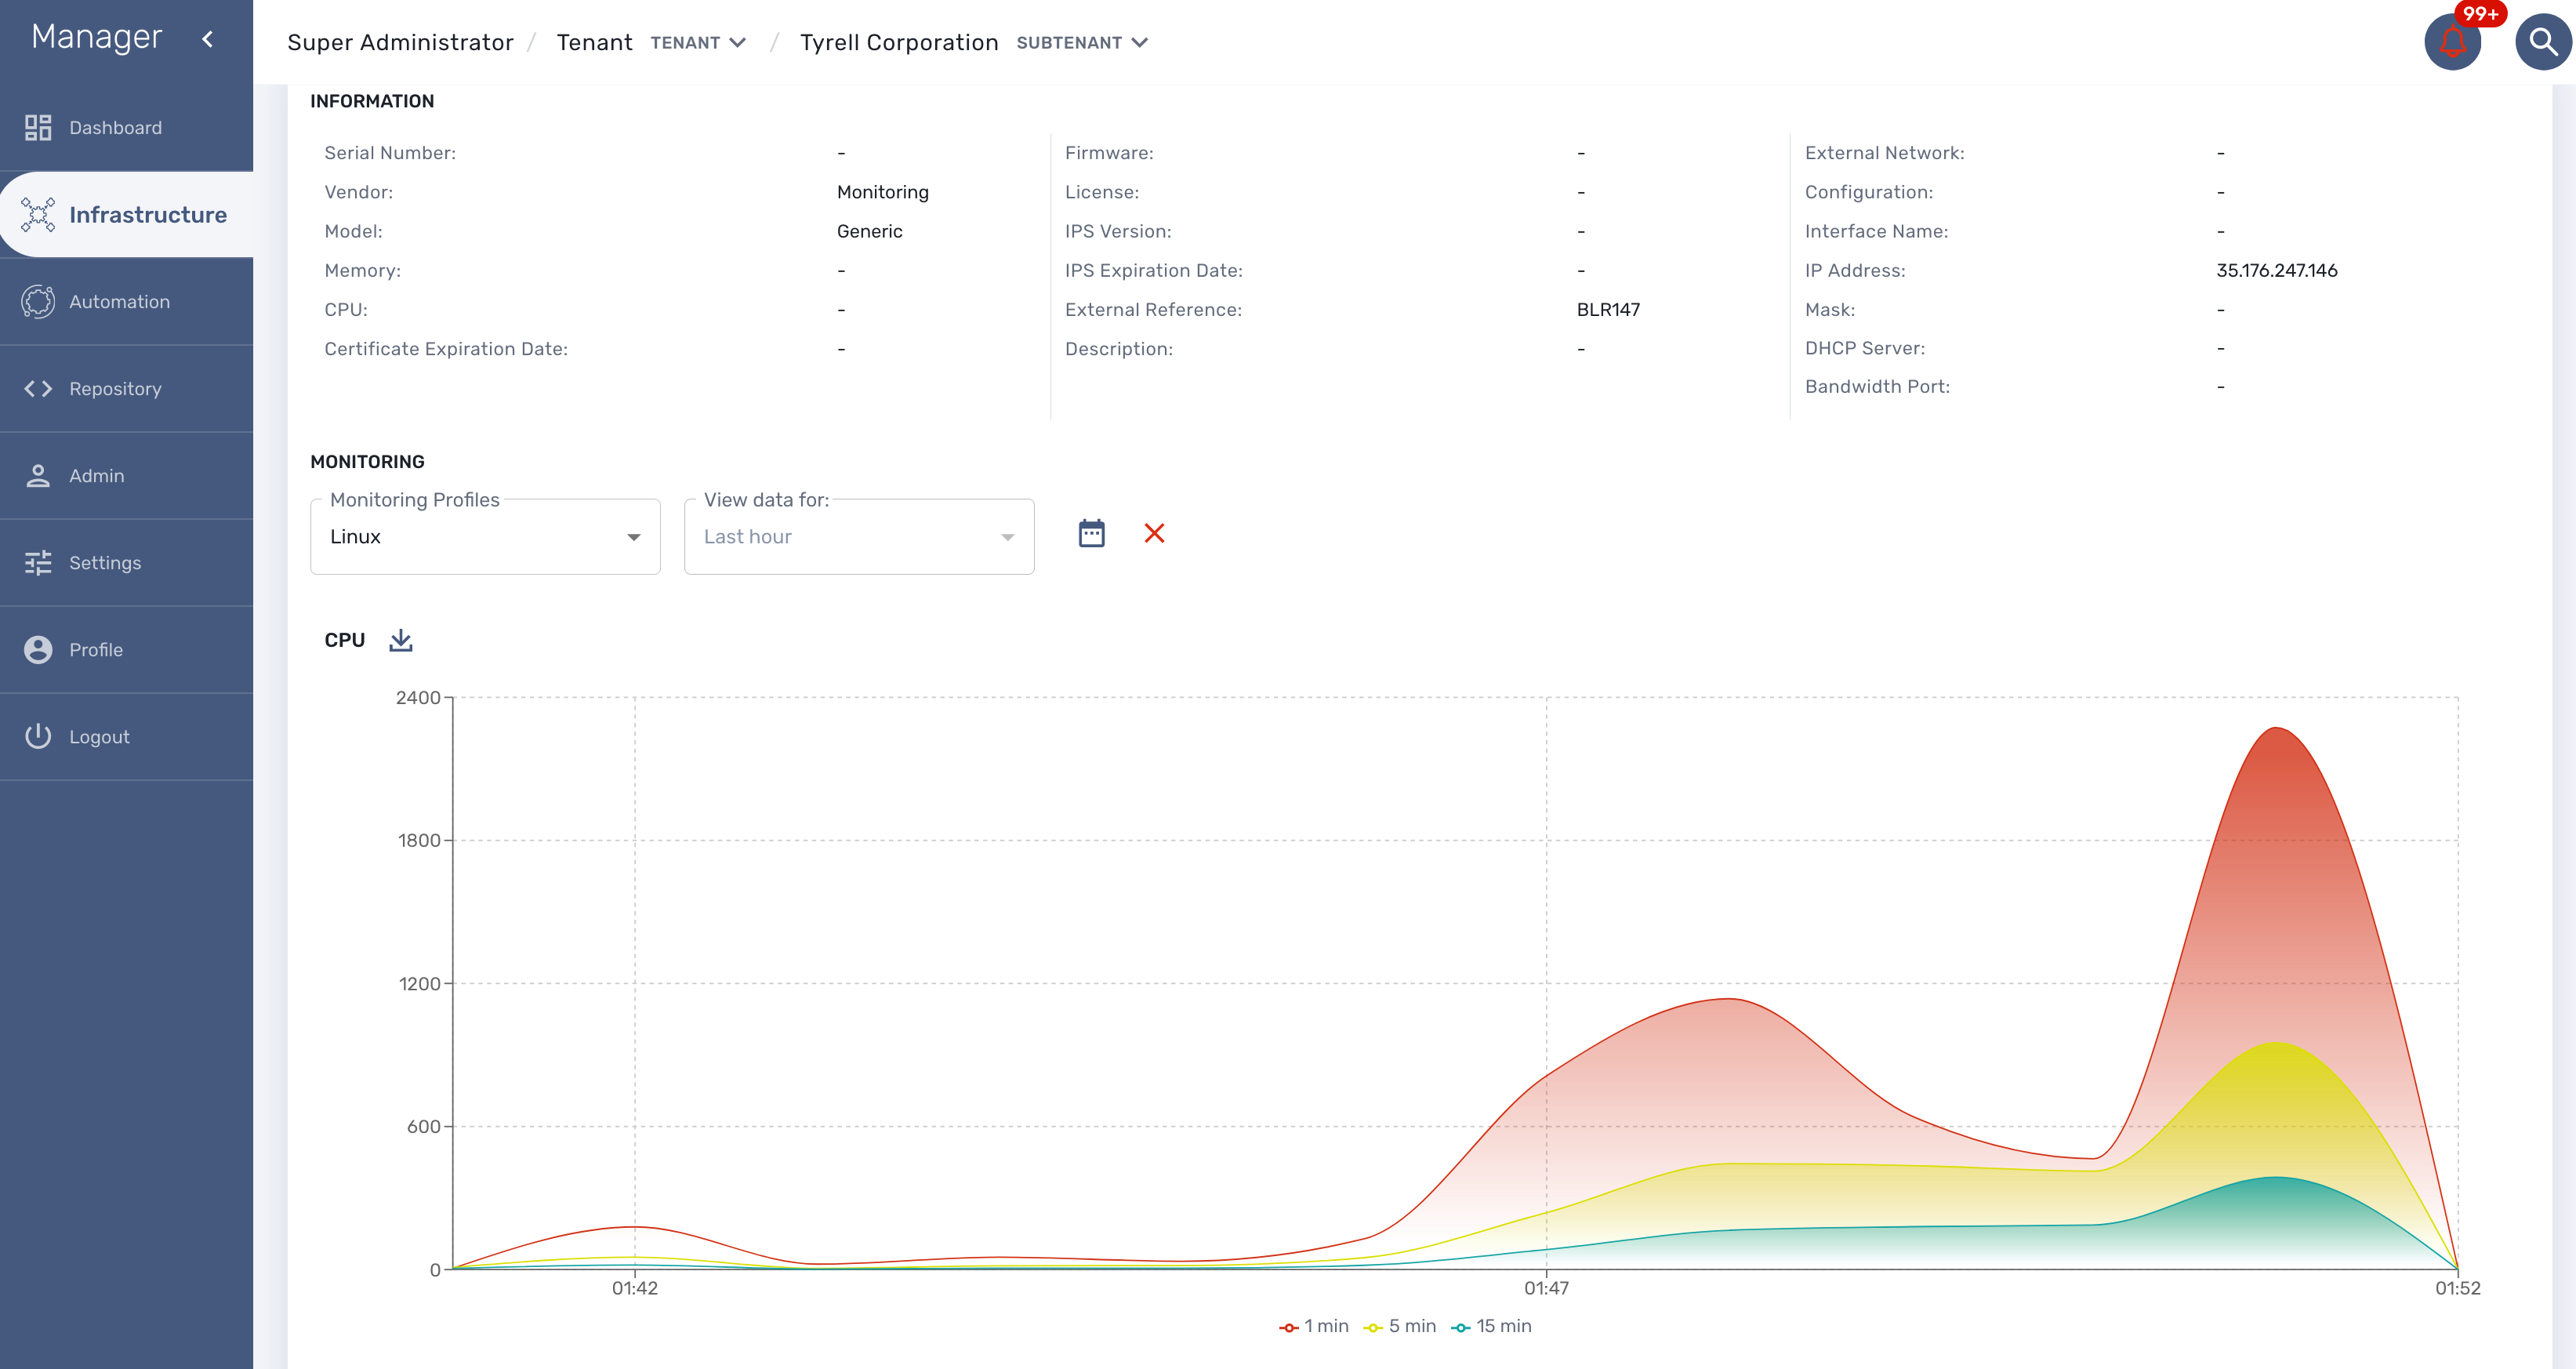
Graphical rendering
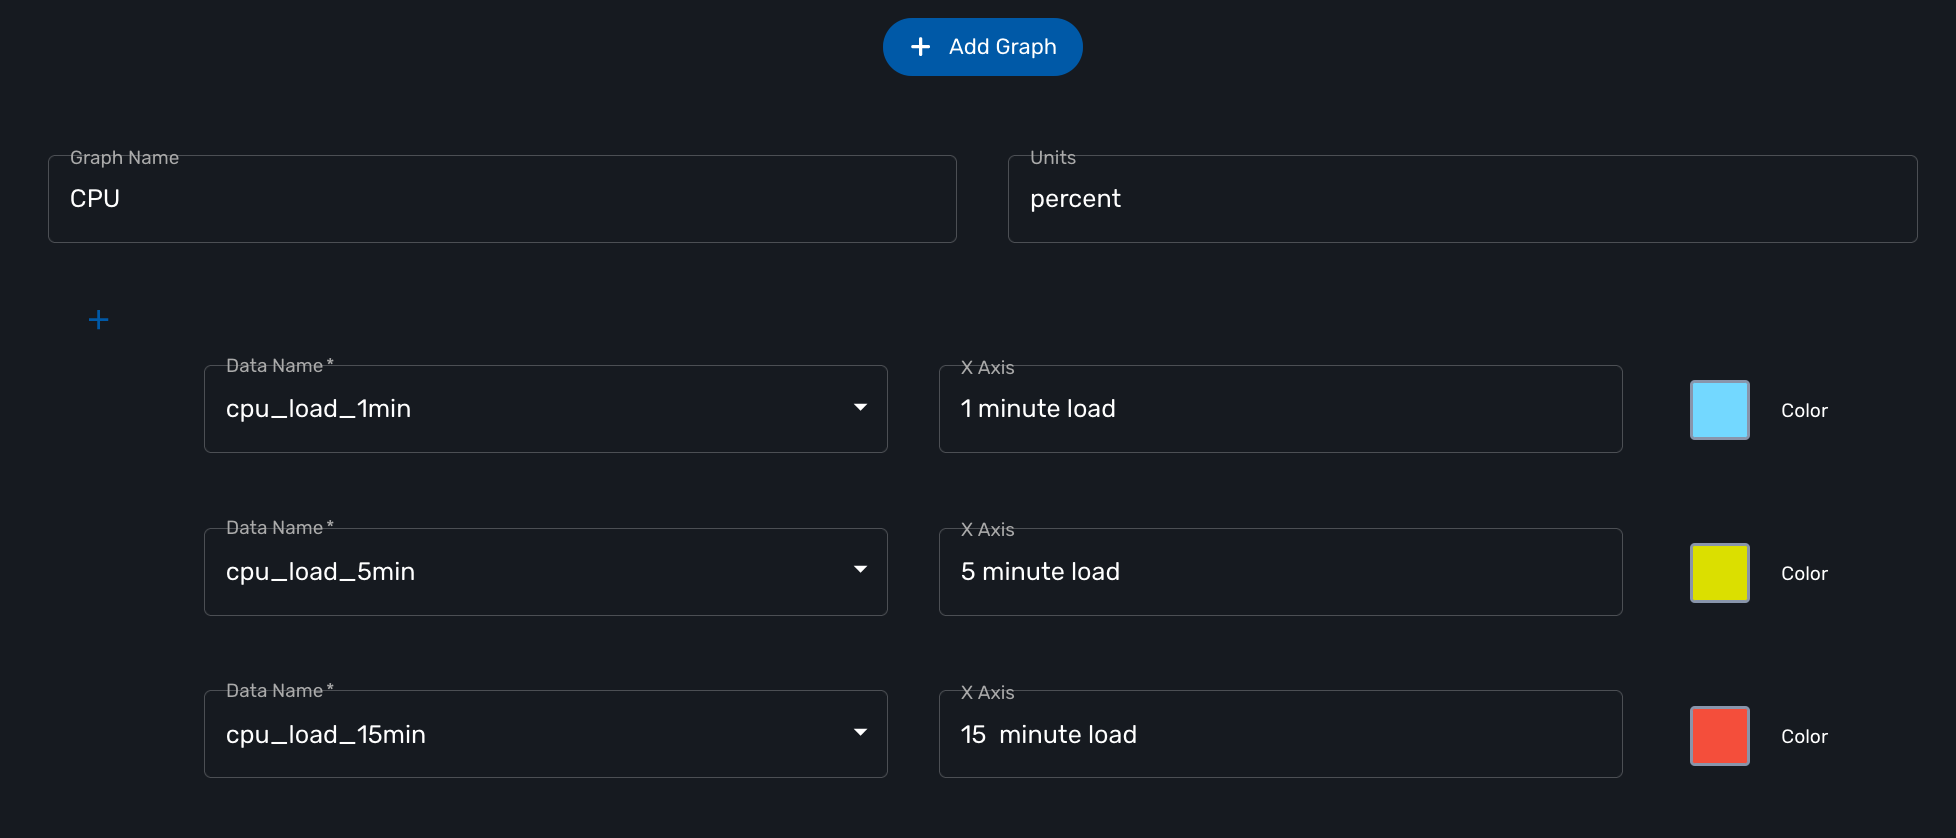
For each monitoring profile you can also create a graph to aggregate and display 1 or more KPI defined in the SNMP polling section.
Since the KPI are going to be displayed in the same graph, you need to ensure that the data is consistent. Displaying CPU load and network traffic in the same graph is allowed but will not make any sense. In this case you need to have 2 monitoring profiles for each set of KPI.
SNMP trap monitoring
The MSactivator™ can collect and index SNMP trap out of the box.
To monitor a managed entity with SNMP trap you need to configure the managed entity with Collect Syslog and Analyze Syslog enabled.
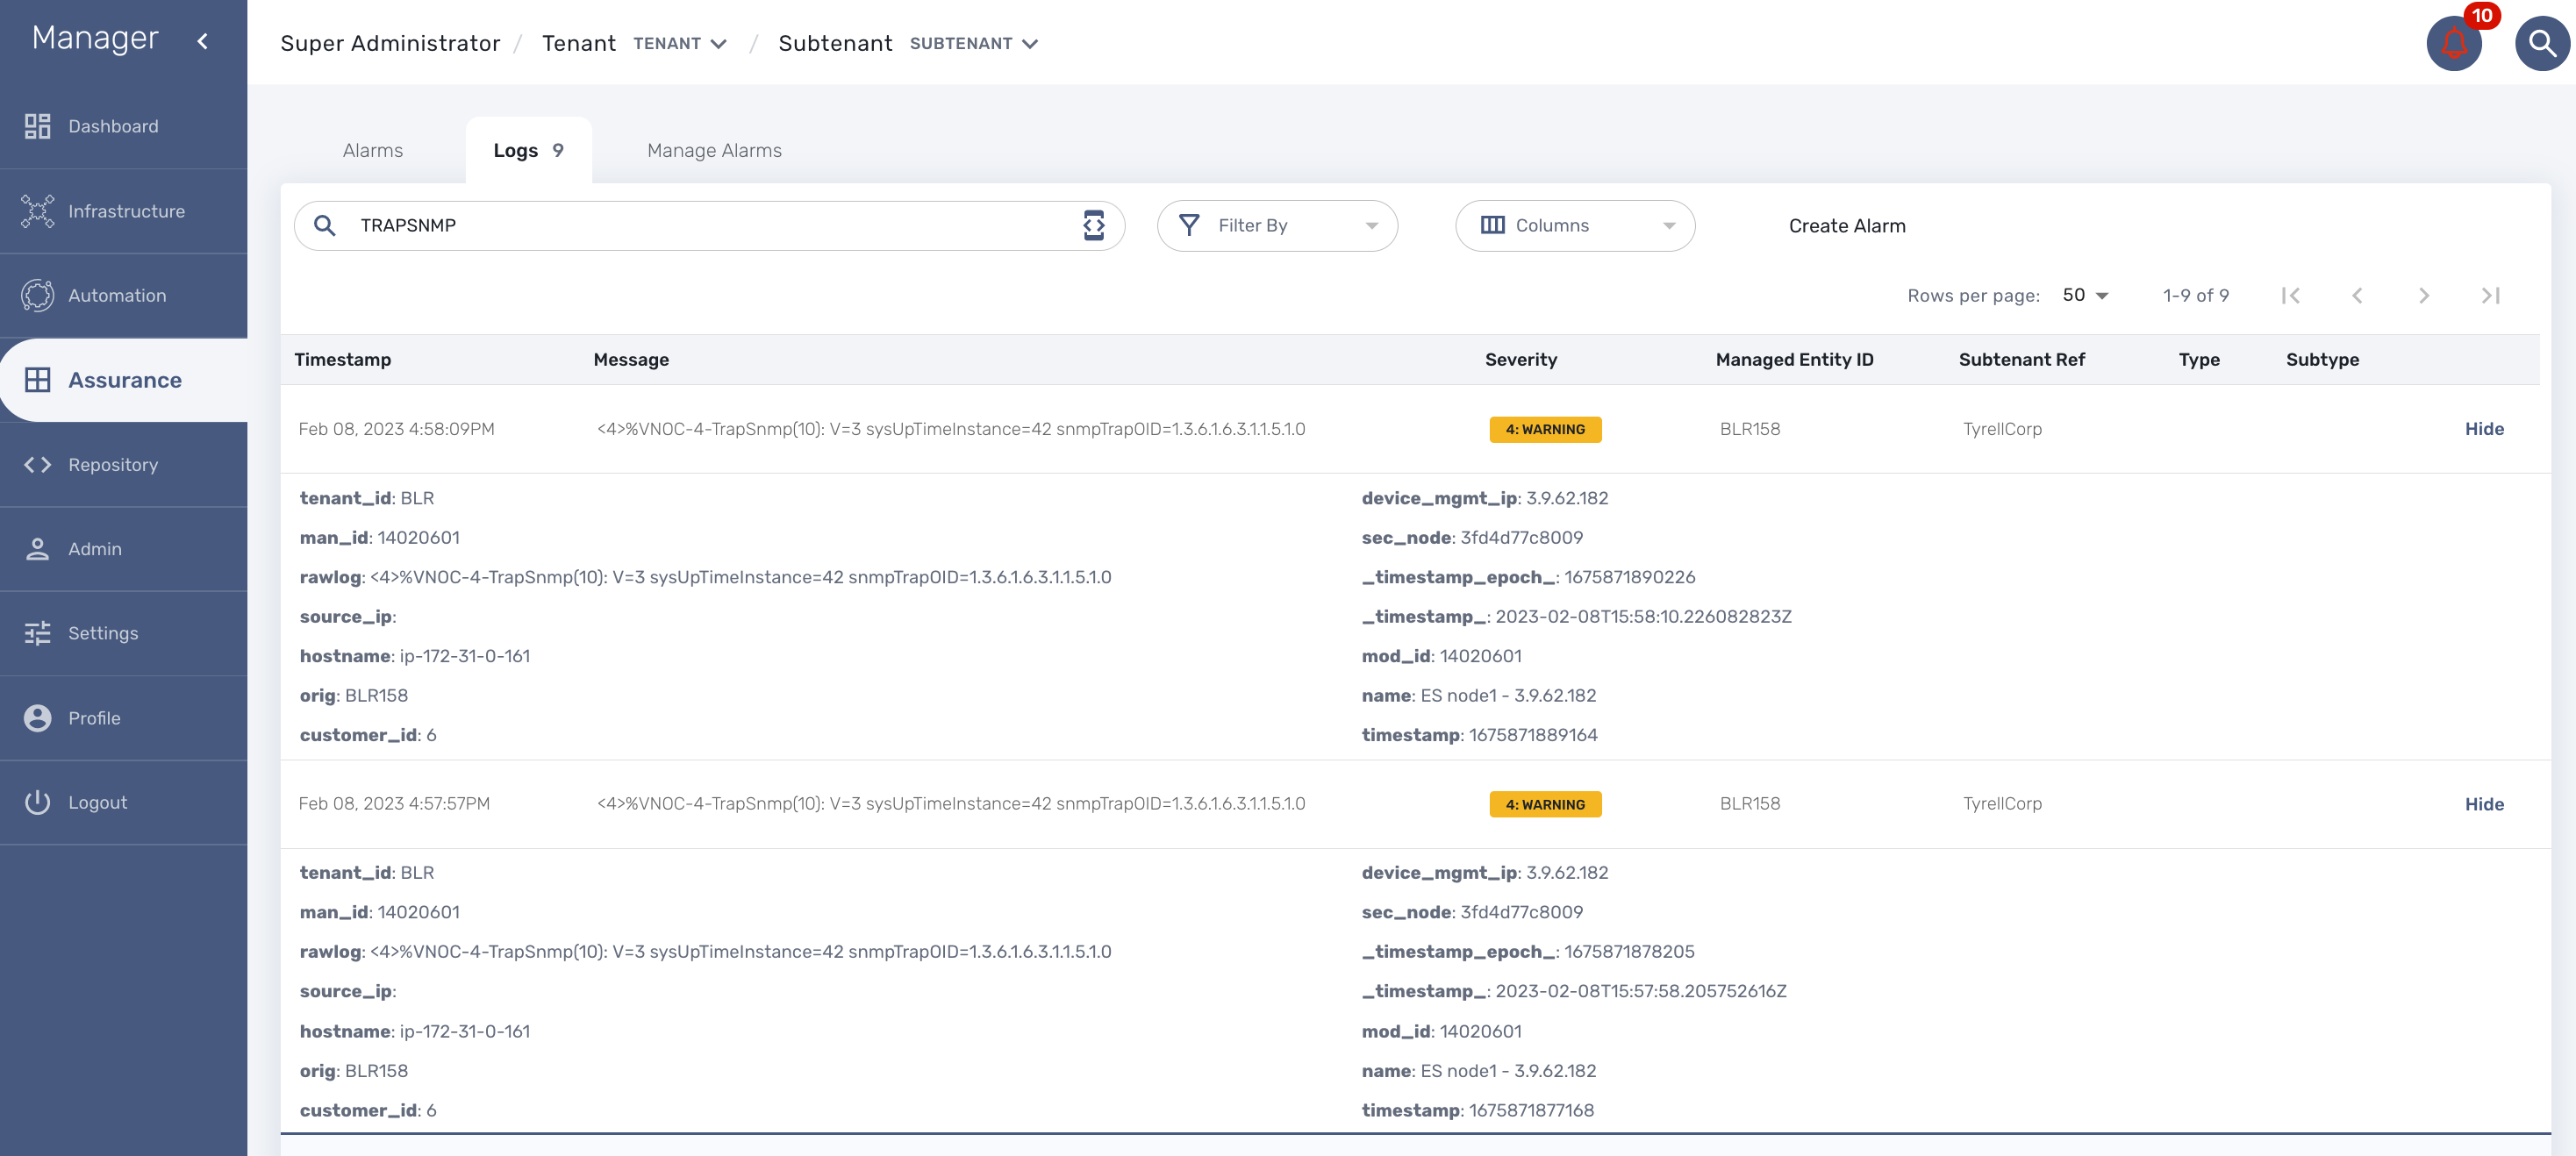
When the MSactivator™ collects a trap, it relies on the trap source IP address to identify the managed entity by it’s management IP address.
Once a management entity is identified, the trap will be processed the same way as a syslog and will be indexed in Elasticsearch. It will then be listed in the logs screen in the "Alarms" section.
SNMP v2/v3
By default the MSactivator™ will be using SNMP v2.
Starting with MSactivator™ v2.8.3 SNMPv3 is also supported.
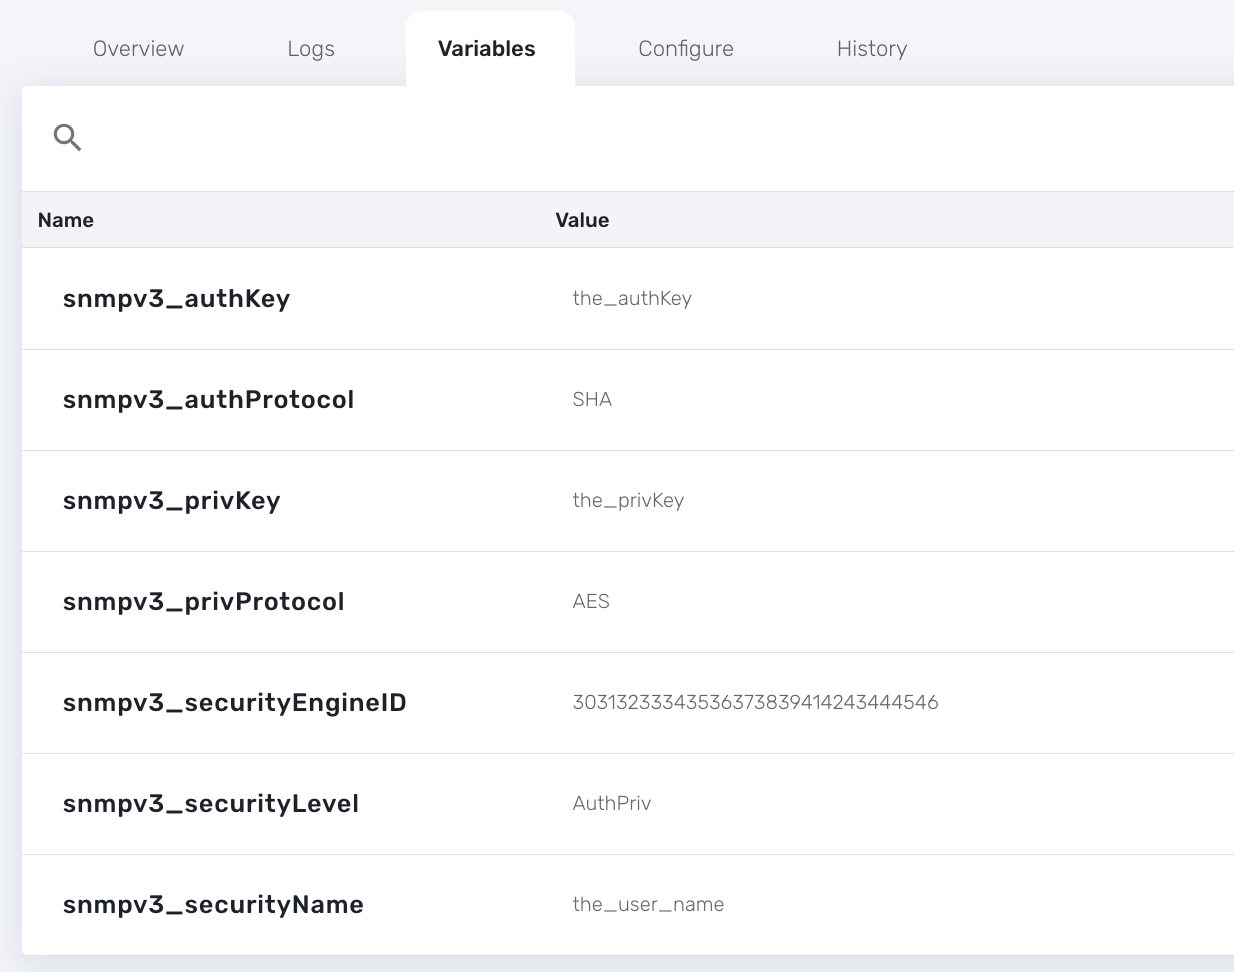
In order to use SNMPv3 to monitor a managed entity you need to configure its variables with the SNMPv3 parameters.
-
snmpv3_securityName
-
snmpv3_securityLevel: possible values are noAuthNoPriv, authNoPriv, and authPriv
-
snmpv3_authKey
-
snmpv3_authProtocol: possible values are MD5 or SHA
-
snmpv3_privKey
-
snmpv3_privProtocol: possible values are DES or AES
-
snmpv3_securityEngineID
For the polling, the mandatory variables are snmpv3_securityName, snmpv3_securityLevel, the others depends of snmpv3_securityLevel value, see below.
For receiving SNMP trap, the mandatory variables are snmpv3_securityName, snmpv3_securityLevel, snmpv3_securityEngineID, the others depends of snmpv3_securityLevel value, see below.
-
if snmpv3_securityLevel is set to authPriv, the additional mandatory variables are snmpv3_authKey, snmpv3_authProtocol, snmpv3_privKey, snmpv3_privProtocol
-
if snmpv3_securityLevel is set to authNoPriv, the additional mandatory variables are snmpv3_authKey, snmpv3_authProtocol
-
if snmpv3_securityLevel is set to noAuthNoPriv, no other additional variables are mandatory
You also need to enable "SNMP Monitoring", use the SNMPv3 user for the community field.
The parameter values should match the SNMPv3 configuration that was set in your actual device.
For instance on a Linux Centos7:
[centos@ip-172-31-0-52 ~]$  snmpwalk -v3 -u ubiqube -l authNoPriv -a MD5 -A Ubiqube2021 localhost
SNMPv2-MIB::sysDescr.0 = STRING: Linux ip-172-31-0-52.eu-west-2.compute.internal 3.10.0-957.12.2.el7.x86_64 #1 SMP Tue May 14 21:24:32 UTC 2019 x86_64
SNMPv2-MIB::sysObjectID.0 = OID: NET-SNMP-MIB::netSnmpAgentOIDs.10
DISMAN-EVENT-MIB::sysUpTimeInstance = Timeticks: (116126) 0:19:21.26
SNMPv2-MIB::sysContact.0 = STRING: root@localhost
SNMPv2-MIB::sysName.0 = STRING: ip-172-31-0-52.eu-west-2.compute.internal
SNMPv2-MIB::sysLocation.0 = STRING: Unknown
SNMPv2-MIB::sysORLastChange.0 = Timeticks: (8) 0:00:00.08
SNMPv2-MIB::sysORID.1 = OID: SNMP-MPD-MIB::snmpMPDCompliance
SNMPv2-MIB::sysORID.2 = OID: SNMP-USER-BASED-SM-MIB::usmMIBCompliance
SNMPv2-MIB::sysORID.3 = OID: SNMP-FRAMEWORK-MIB::snmpFrameworkMIBCompliance
SNMPv2-MIB::sysORID.4 = OID: SNMPv2-MIB::snmpMIB
To verify that SNMP v3 monitoring is working properly you can check that the sysuptime graph is plotting data.
You can also monitor specific KPI based on the OID of your vendor.
Collecting SNMPv3 trap
For SNMPv3 traps, the managed entity should be configured as explained above and the variable snmpv3_securityEngineID is mandatory for decoding the SNMP traps.
SNMP trap translation
Architecture overview
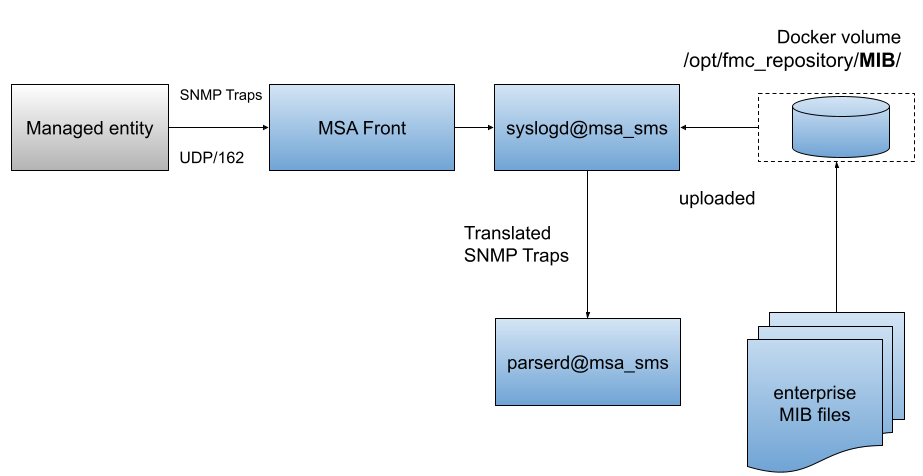
The MIB translation is automatically done based on the MIB definition files loaded in the repository
First put the MIB definition files into the repository under a folder "MIBs".
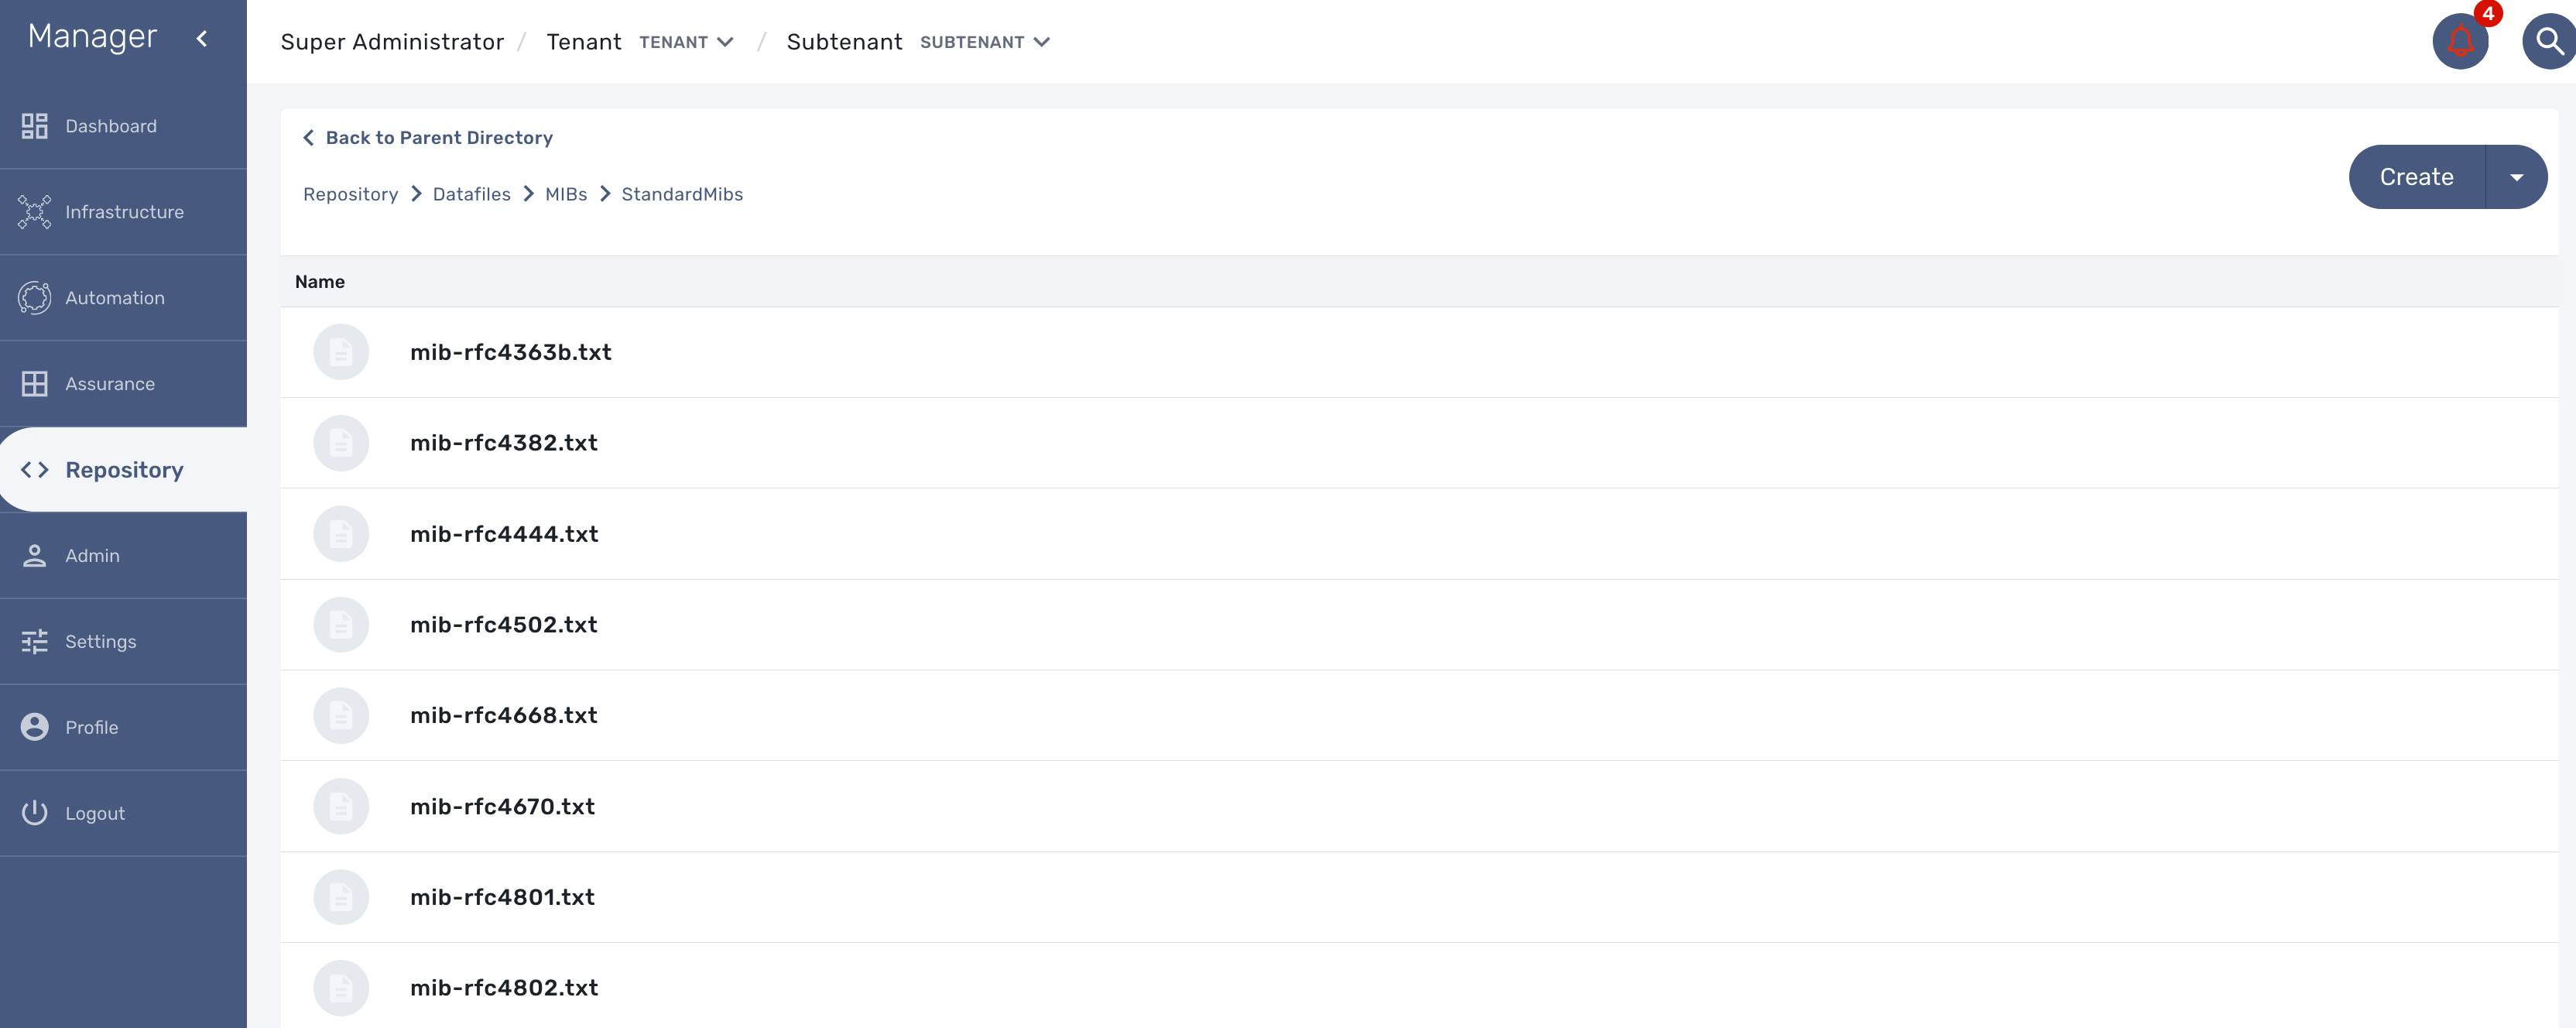
The translation process is reading the text (*.txt) files in /opt/fmc_repository/Datafiles/MIBs/ in order to get the list of the available MIBs (recursive reading is supported)
Testing
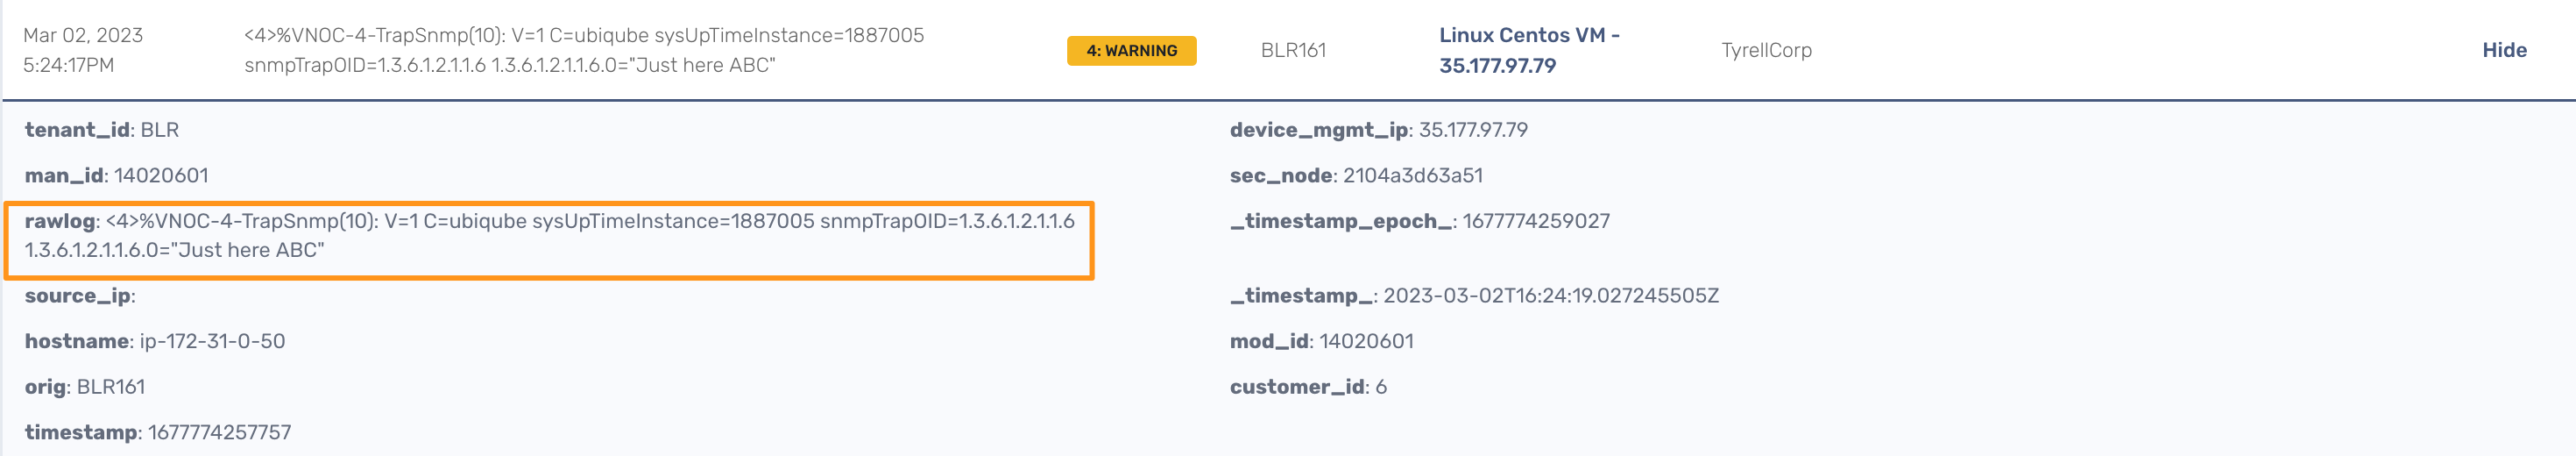
We can now launch a snmp trap command with OID 1.3.6.1.2.1.1.6
snmptrap -v2c -c ubiqube 3.10.63.66 "" 1.3.6.1.2.1.1.6 1.3.6.1.2.1.1.6.0 s "Just here ABC"
Without the translation, the UI shows
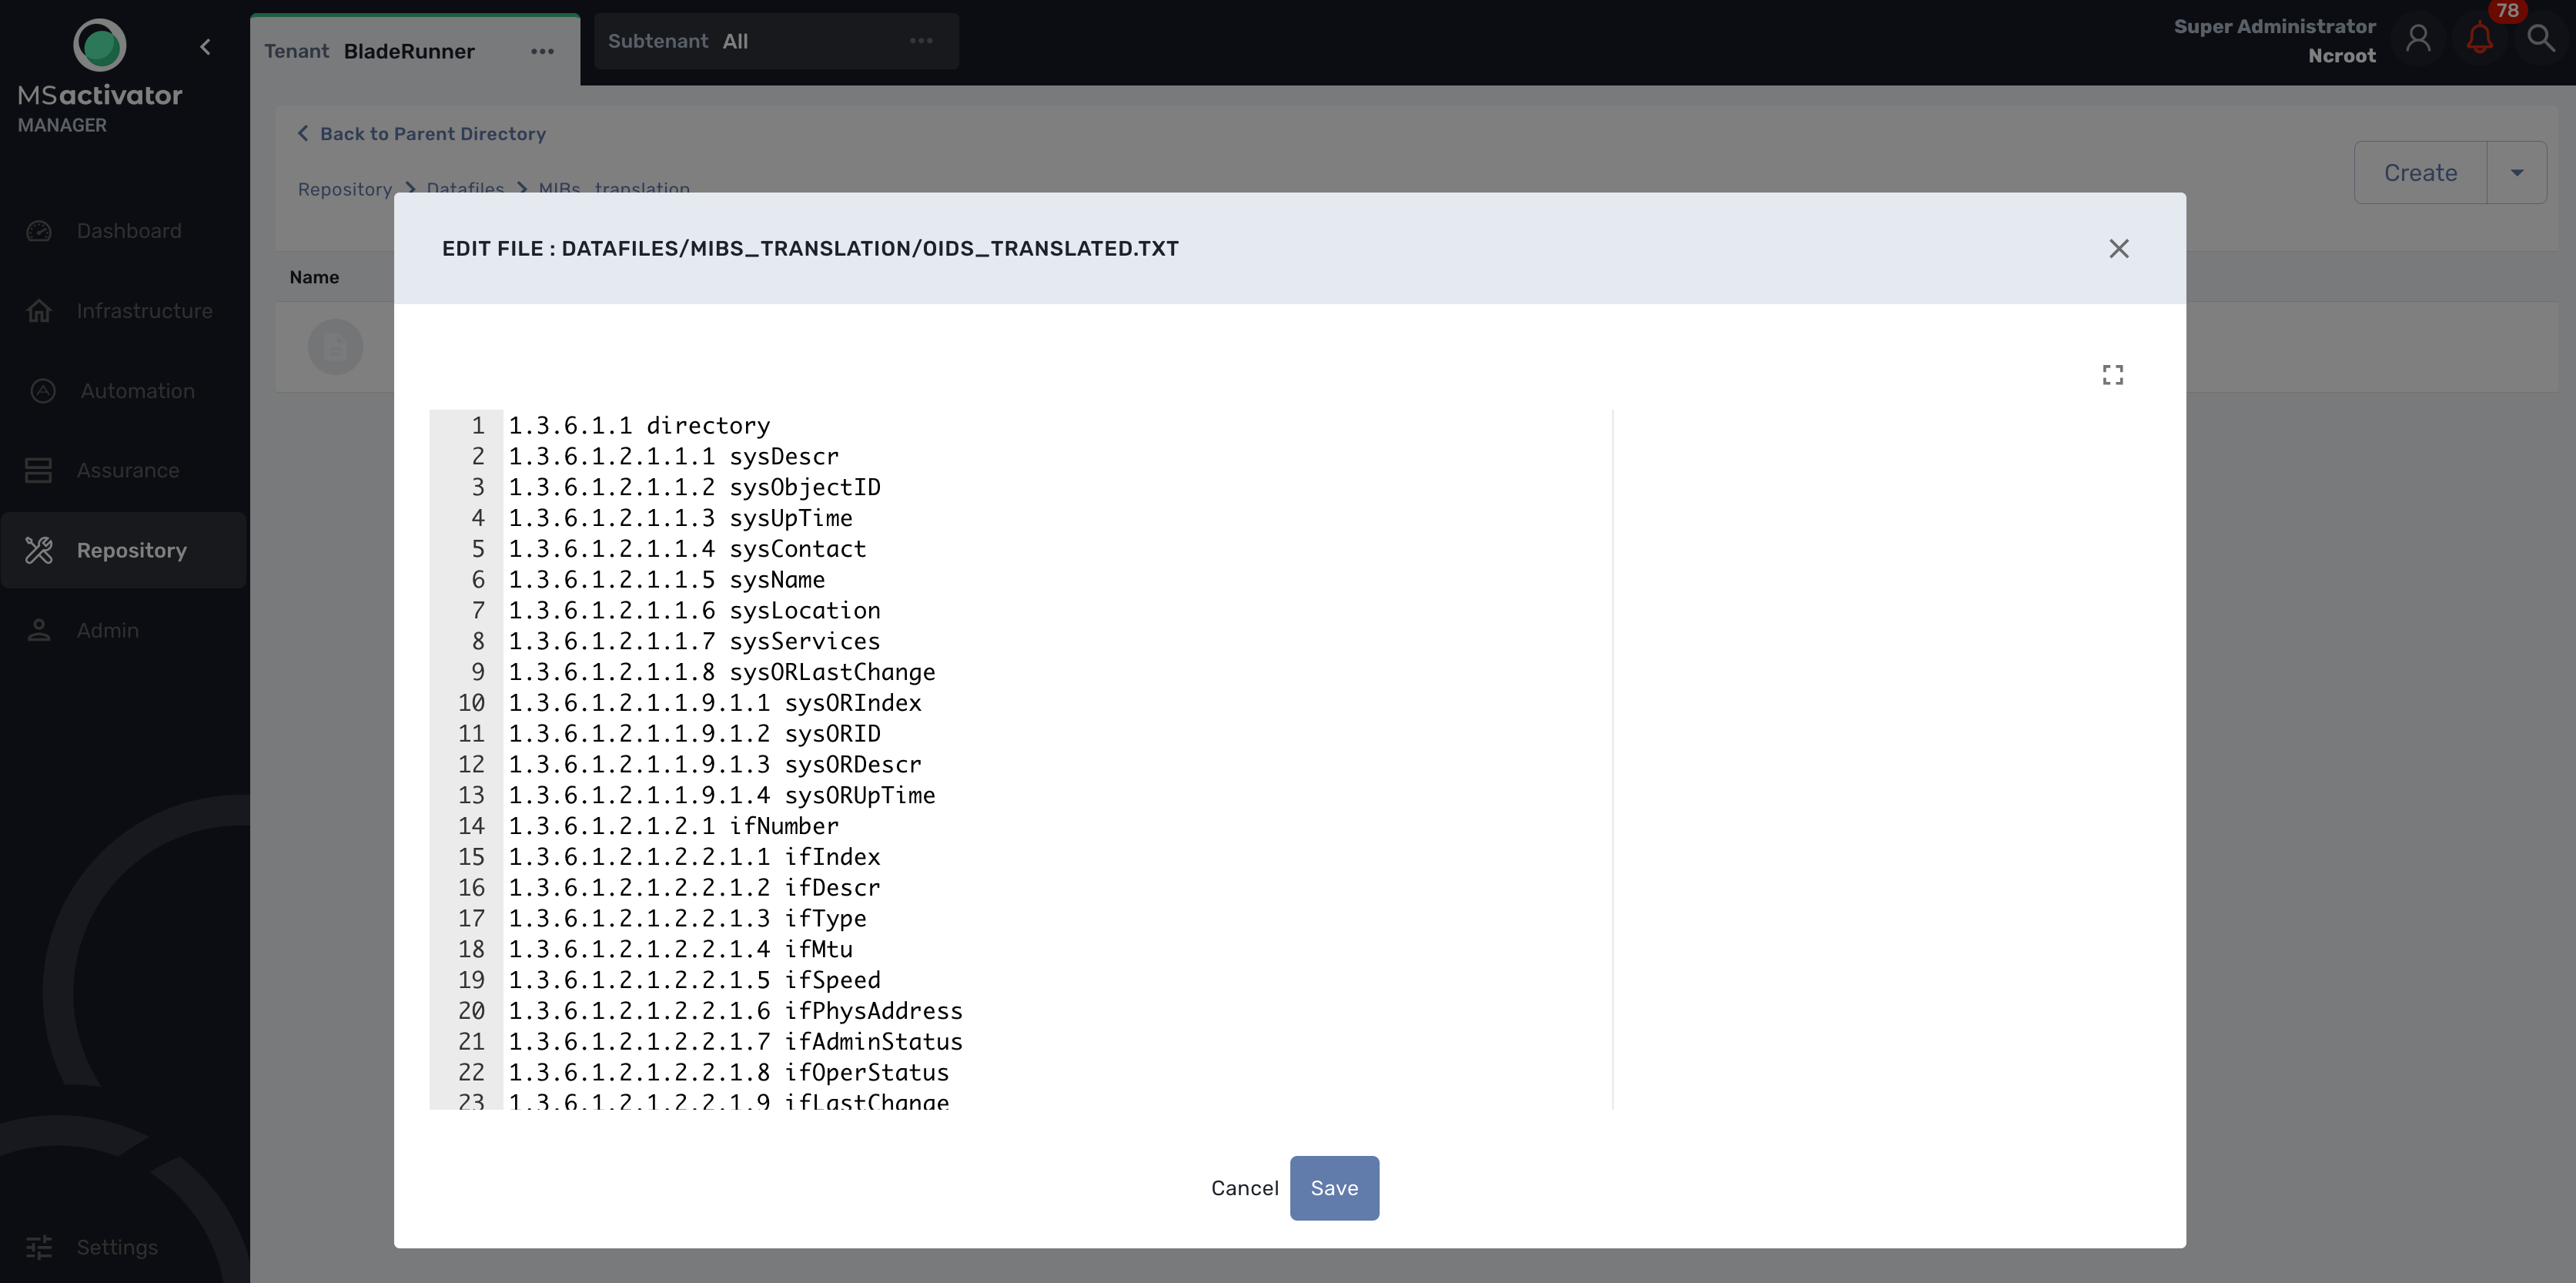
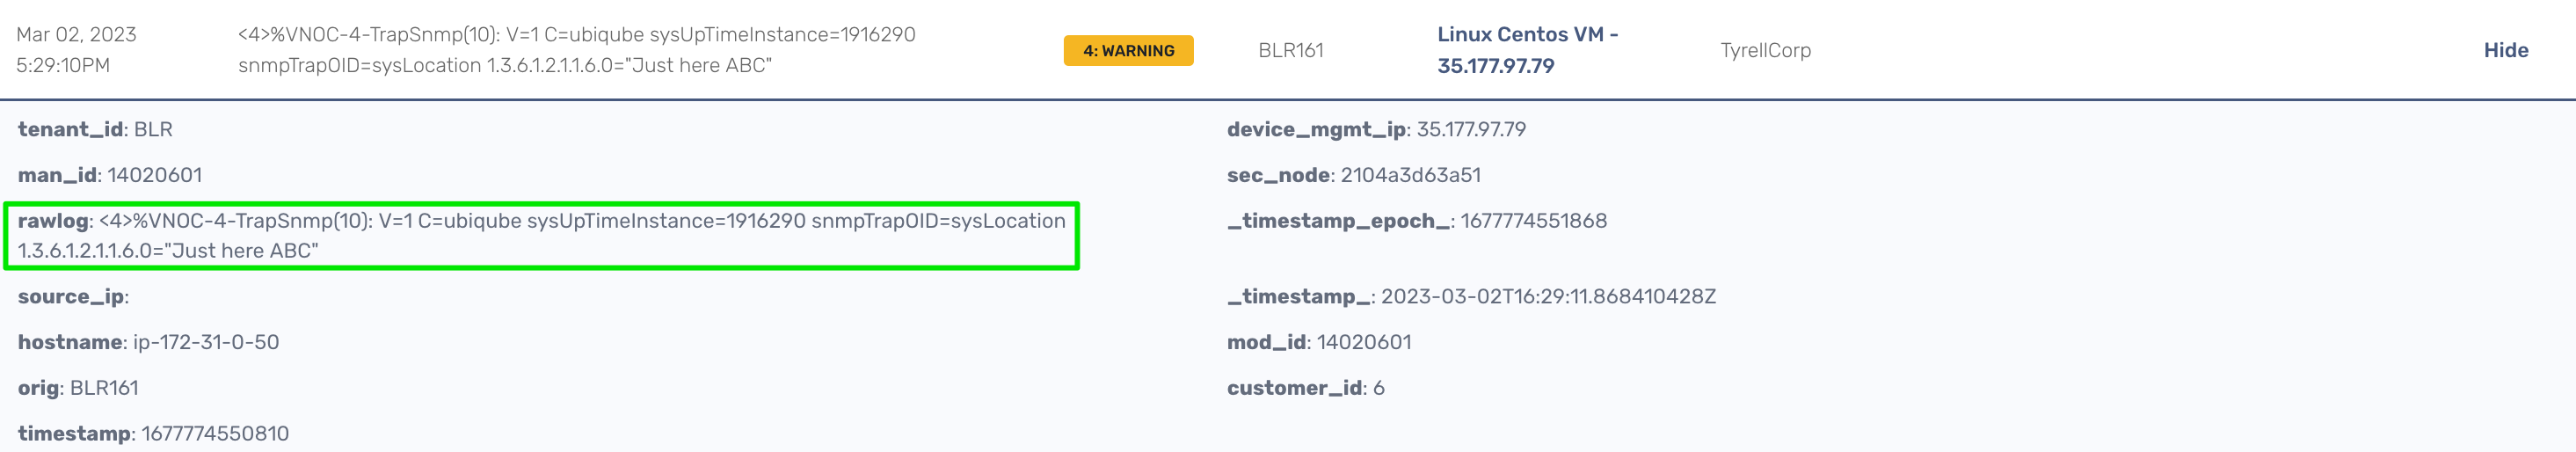
With the translation of 1.3.6.1.2.1.1.6 to sysLocation
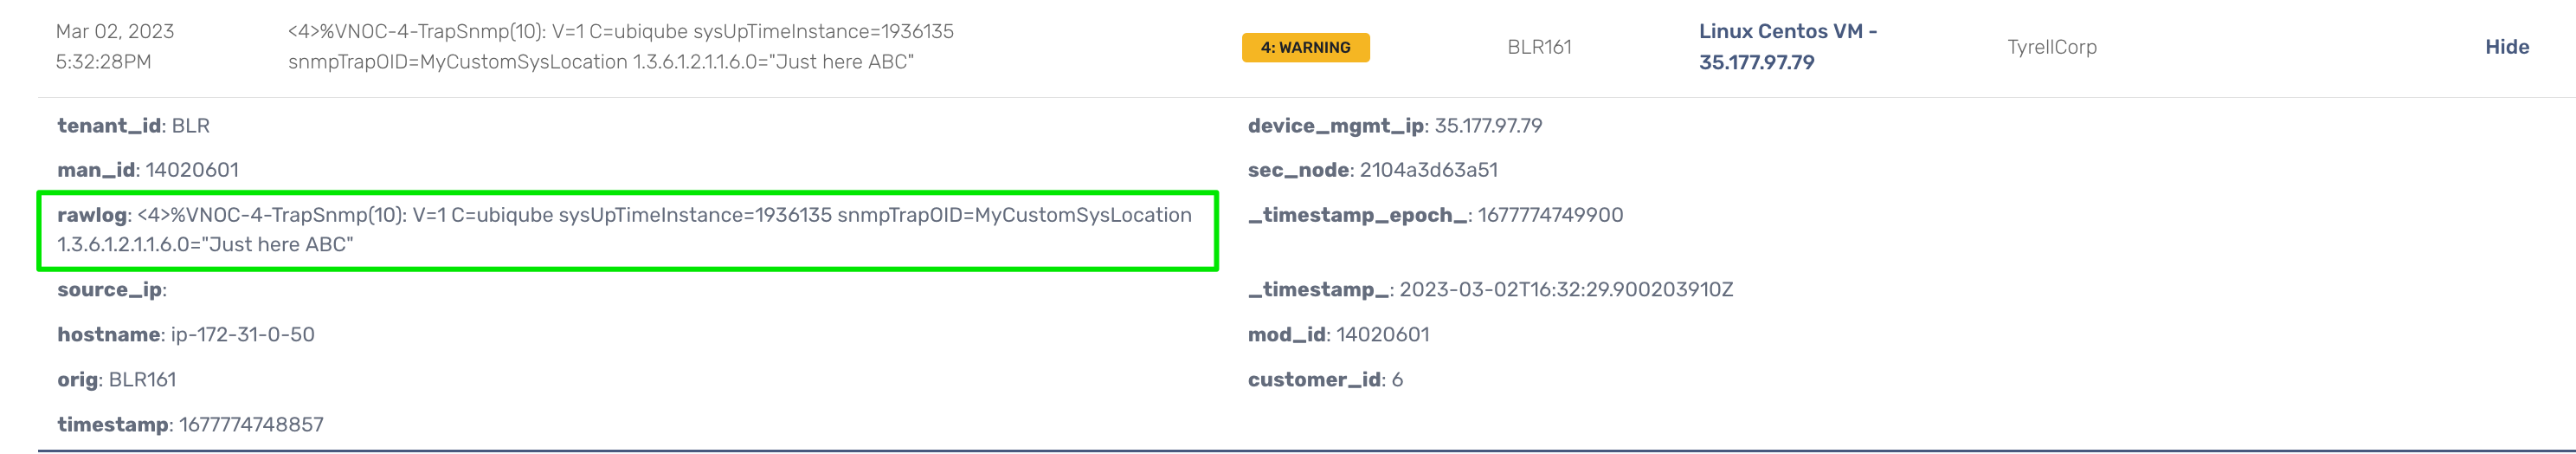
With a custom translation of 1.3.6.1.2.1.1.6 to MyCustomSysLocation
Log analytics
Overview
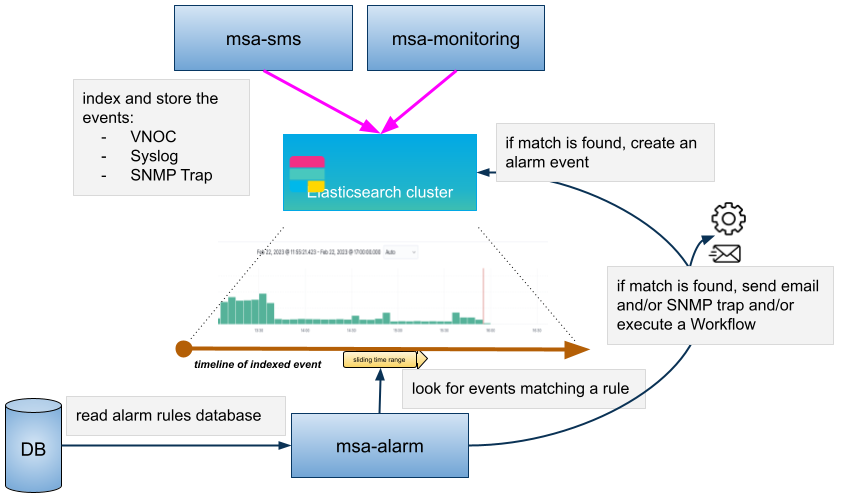
The MSactivator™ can collect, index and store events received from the managed entities. Once indexed, the logs are fully searchable from the user interface.
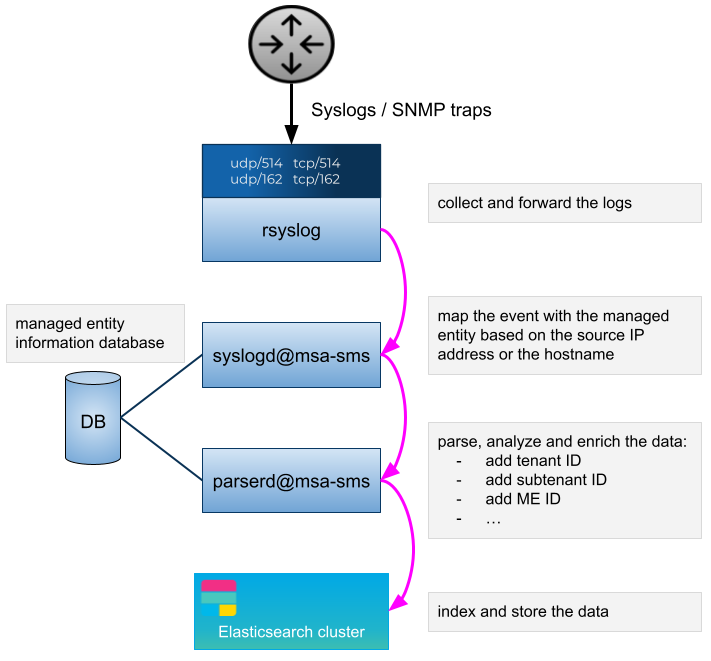
The diagram below shows the syslog processing steps from the device to Elasticsearch.
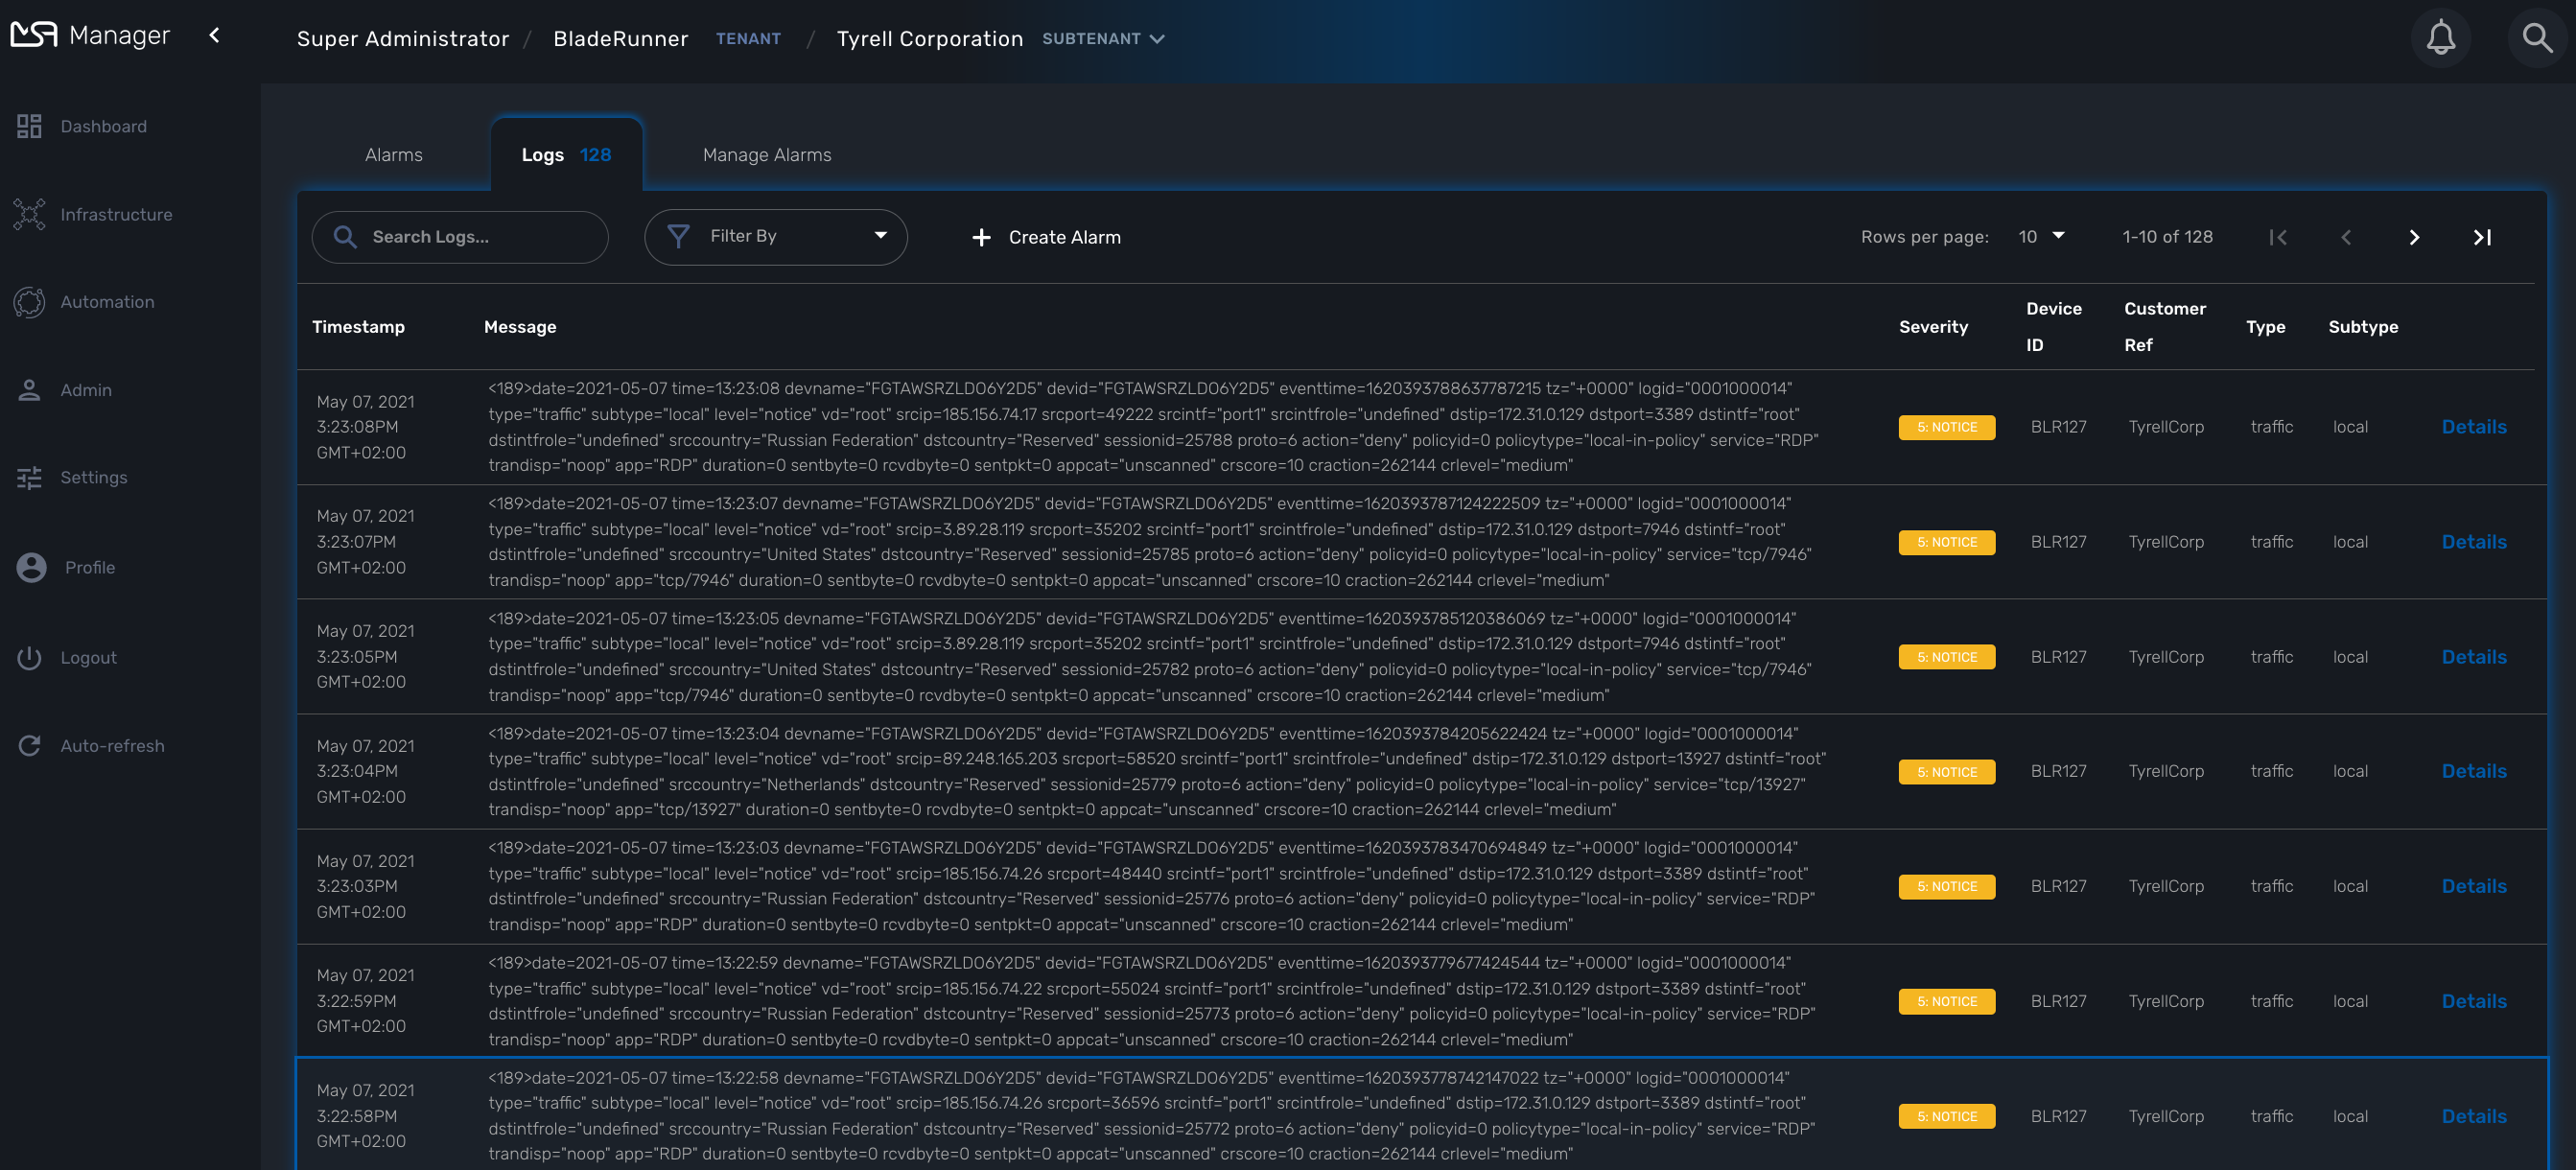
Search logs
To view and search the logs you can either access the global log and alarm view by clicking on the bell icon at the screen top right or by browsing to a specific managed entity and selecting the tab "Logs"
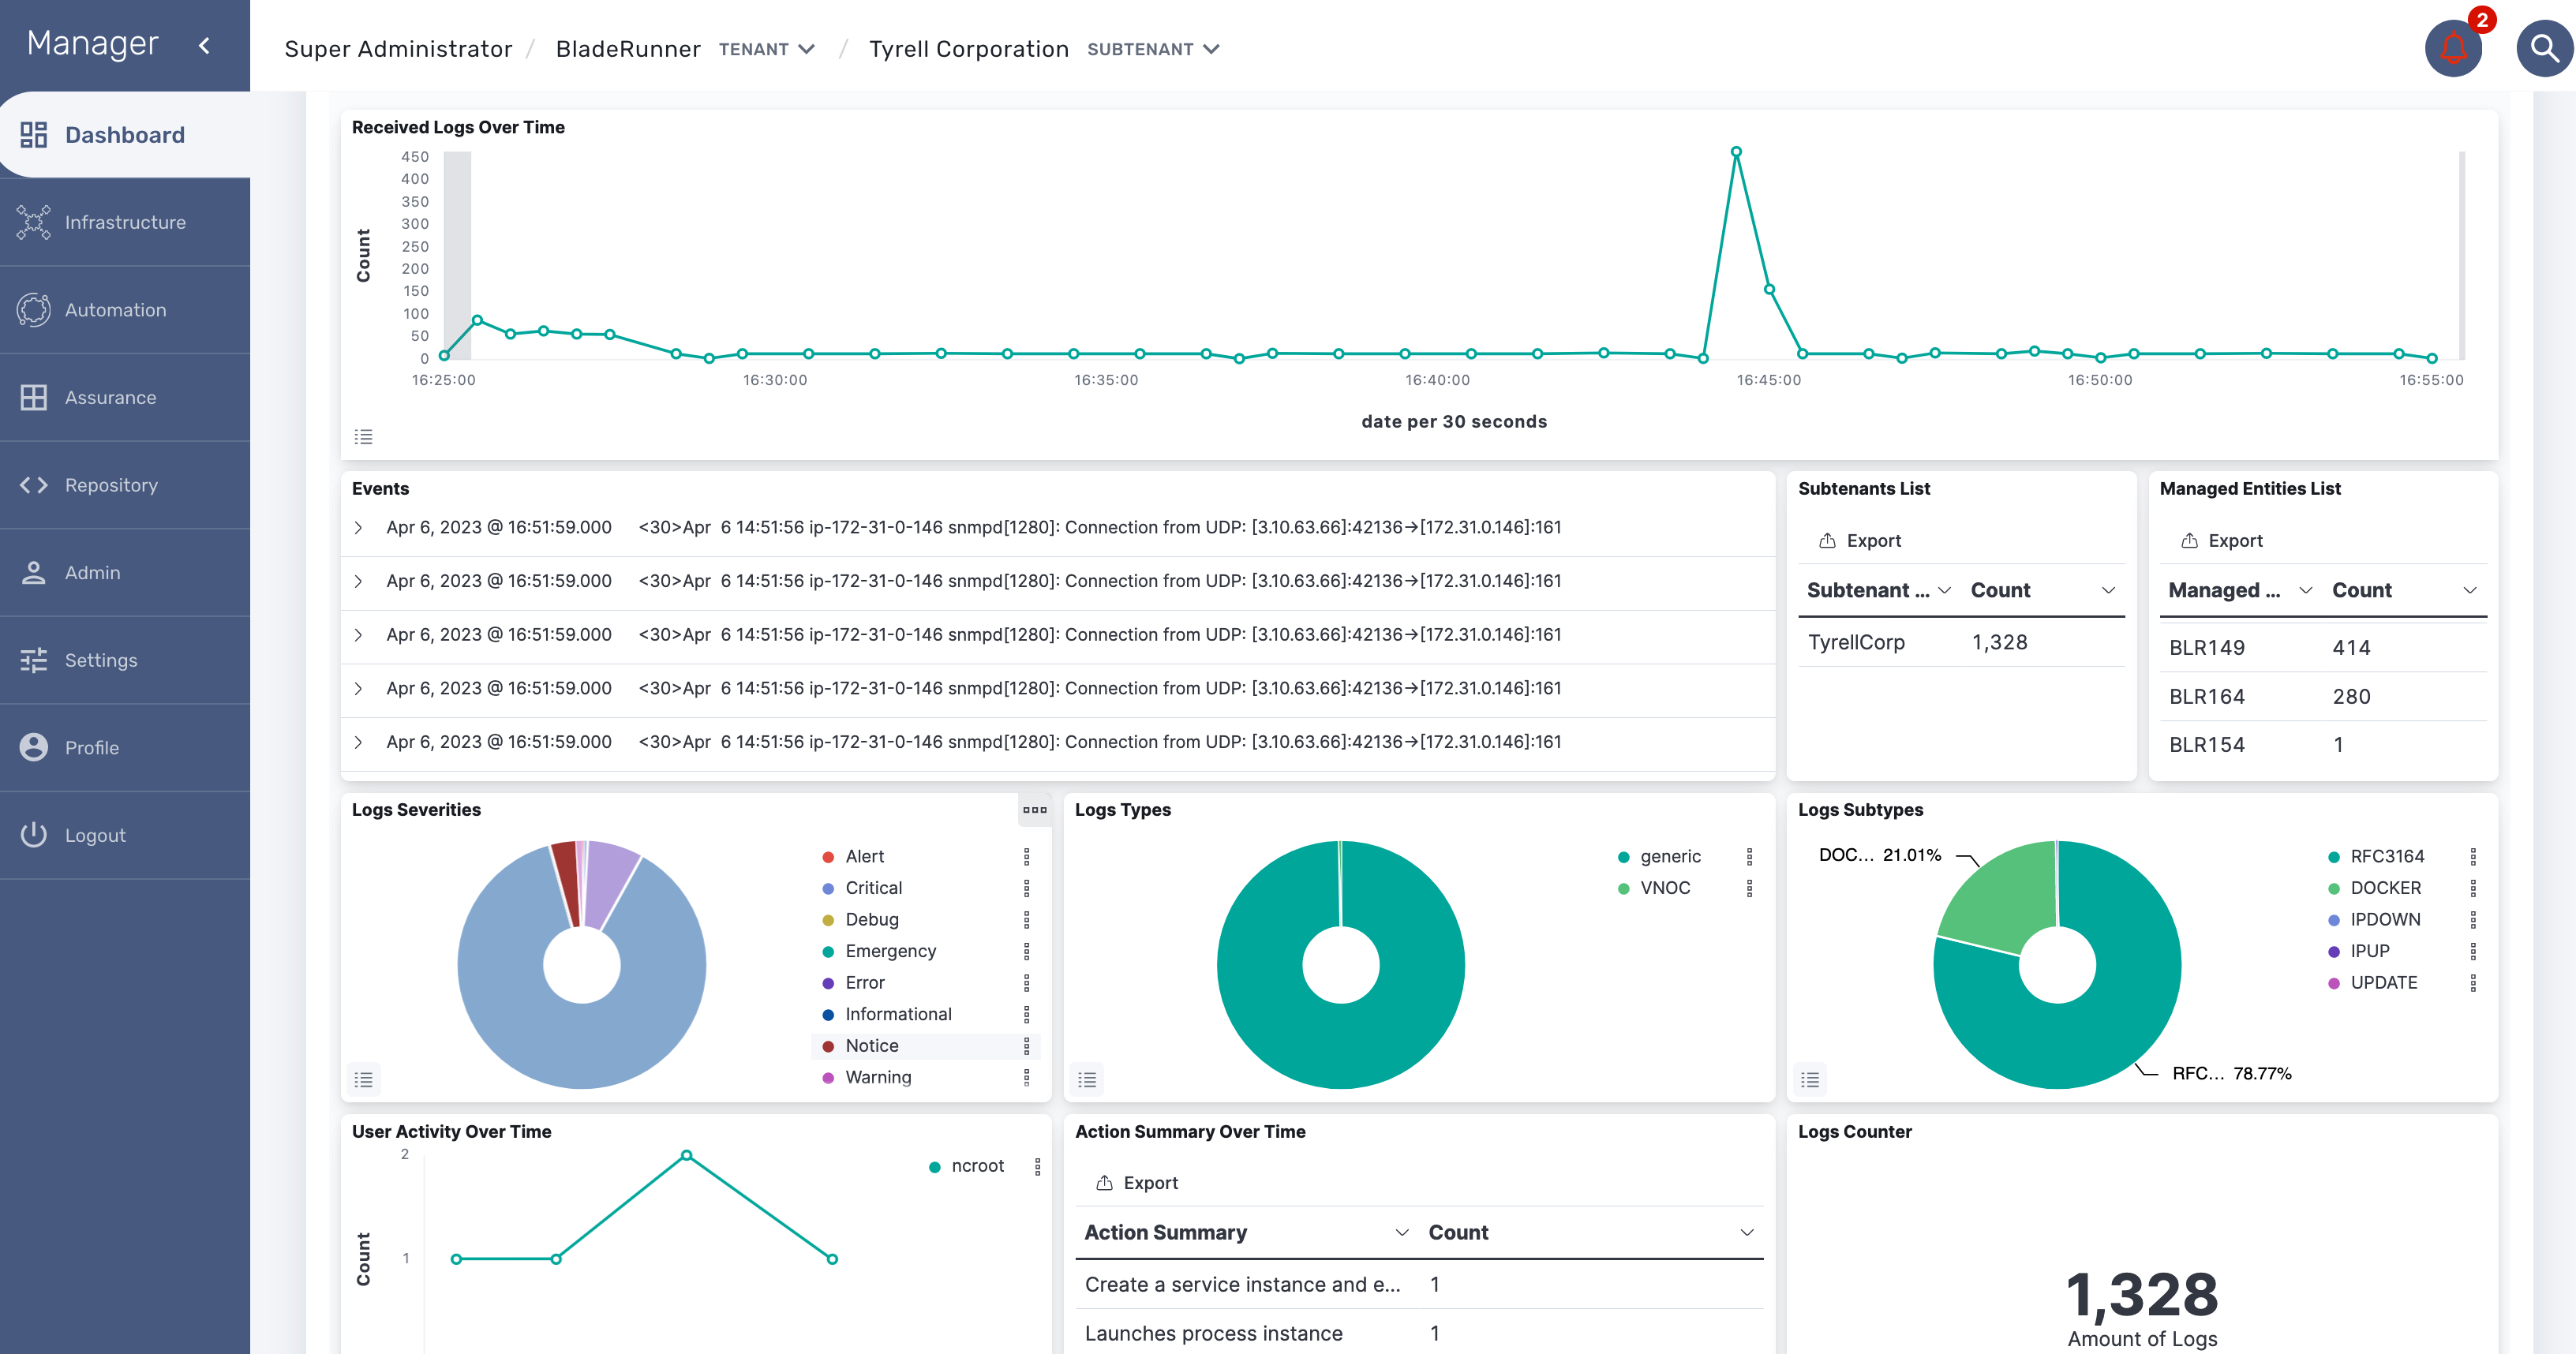
Dashboard
Dashboard will allow you to visualize the data store in Elasticsearch
You can access Kibana on port 5601 (https://localhost:5601/kibana) and use Kibana to:
-
discover the data indexed and stored in Elasticsearch
-
create your own dashboard templates
-
reuse or edit the dashboard included in the MSactivator™
Deploy an existing dashboard for a subtenant
You can use the workflow "Deploy Dashboard" to deploy the dashboards packaged in the MSactivator™.
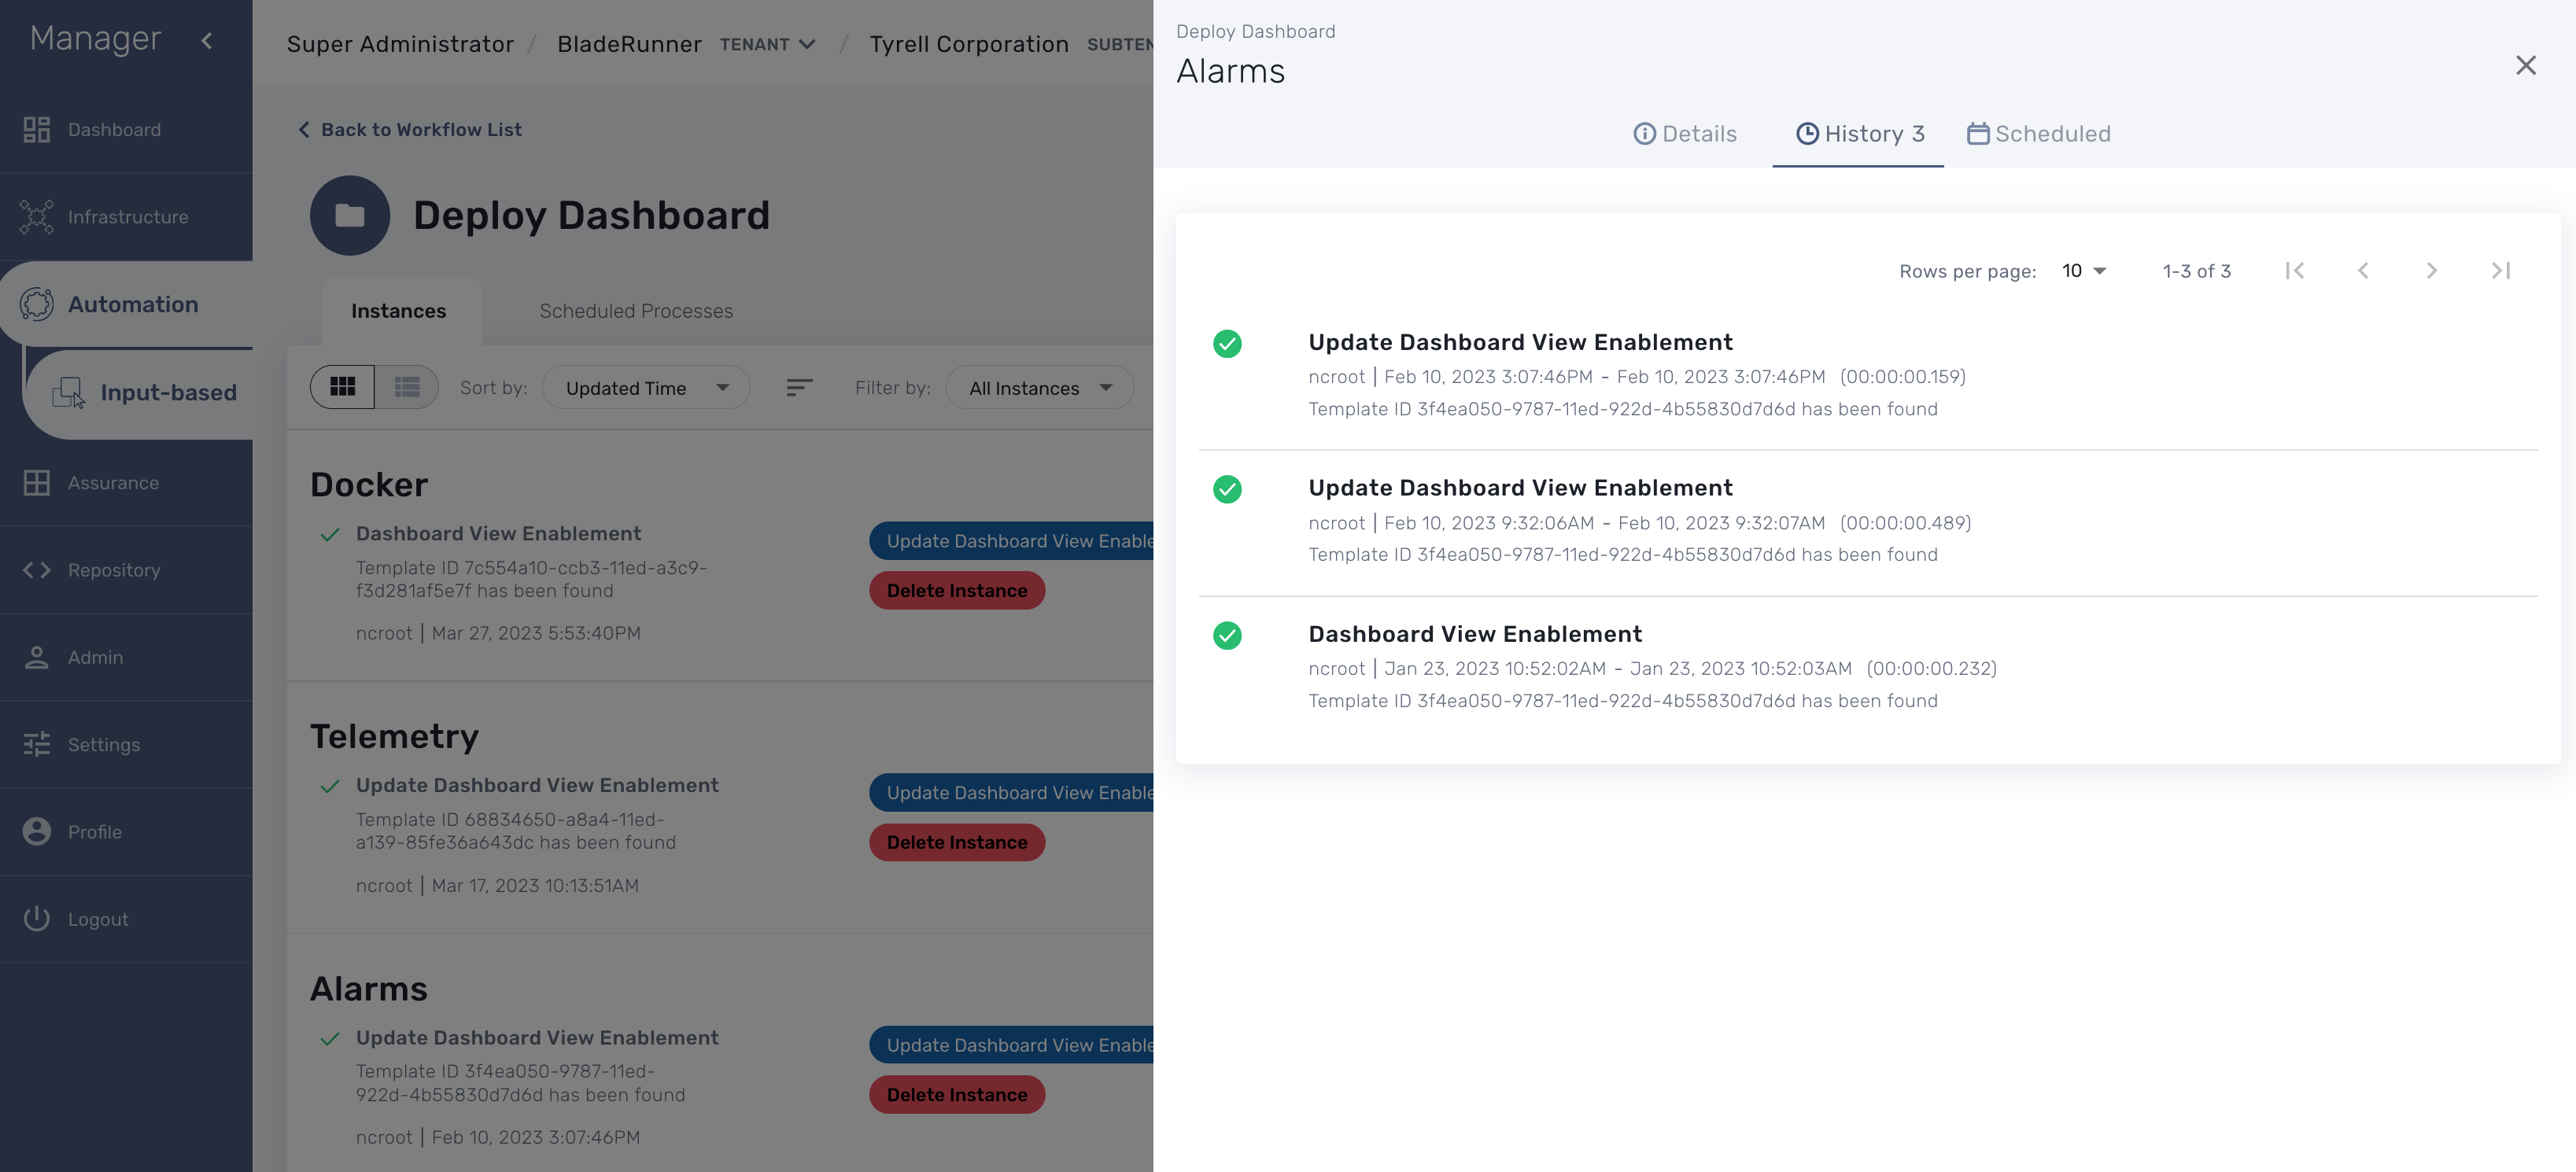
Use the Kibana URL from the workflow instance to browse to the Kibana dashboard
Alarm
Overview
The alarm management module is based on the detection of events which internal (VNOC), SNMP thresholds, or sylogs sent by the managed devices and collected by the MSactivator™. Alarm management is designed to provide email notifications to customers or managers or administrator
The detection of events relies on rules configured at the super administrator level.
Rule management is available for the super administrator (ncroot). The rules are defined globally and can be modified by the operation team.
The infrastructure management team can modify the setting of the notifications on a per-event and/or per-subtenant basis. The rules are executed on a periodic basis (the period frequency can be configured) and alarms are generated whenever a rule matches.
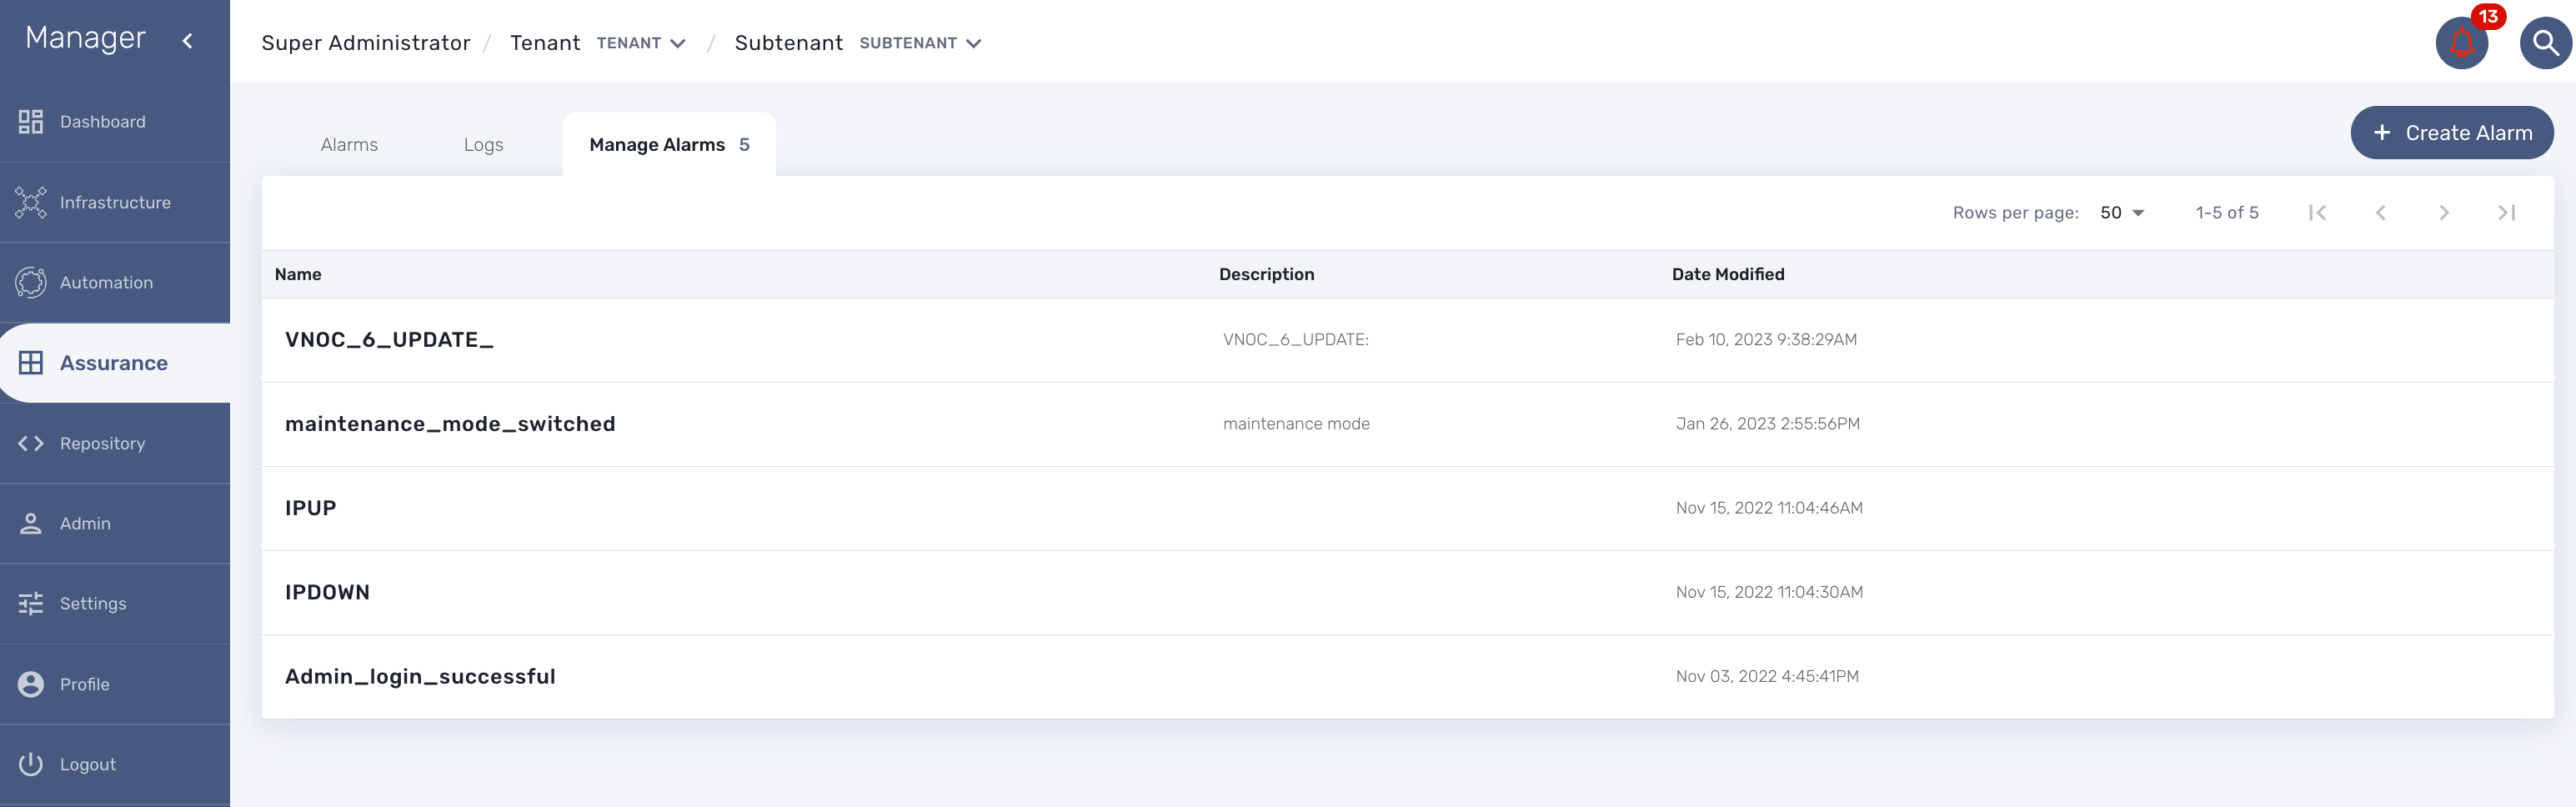
Manage alarm rules
The Alarm management screen is available by clicking on the bell icon on the top right of the screen.
Alarm Rule can be created from the Manage Alarms tab, as show in the below screen shot. Alarm Name should be Unique across the MSactivator™ and it should not contain space.
Create or edit an alarm
Alarm creation contains Four sections below
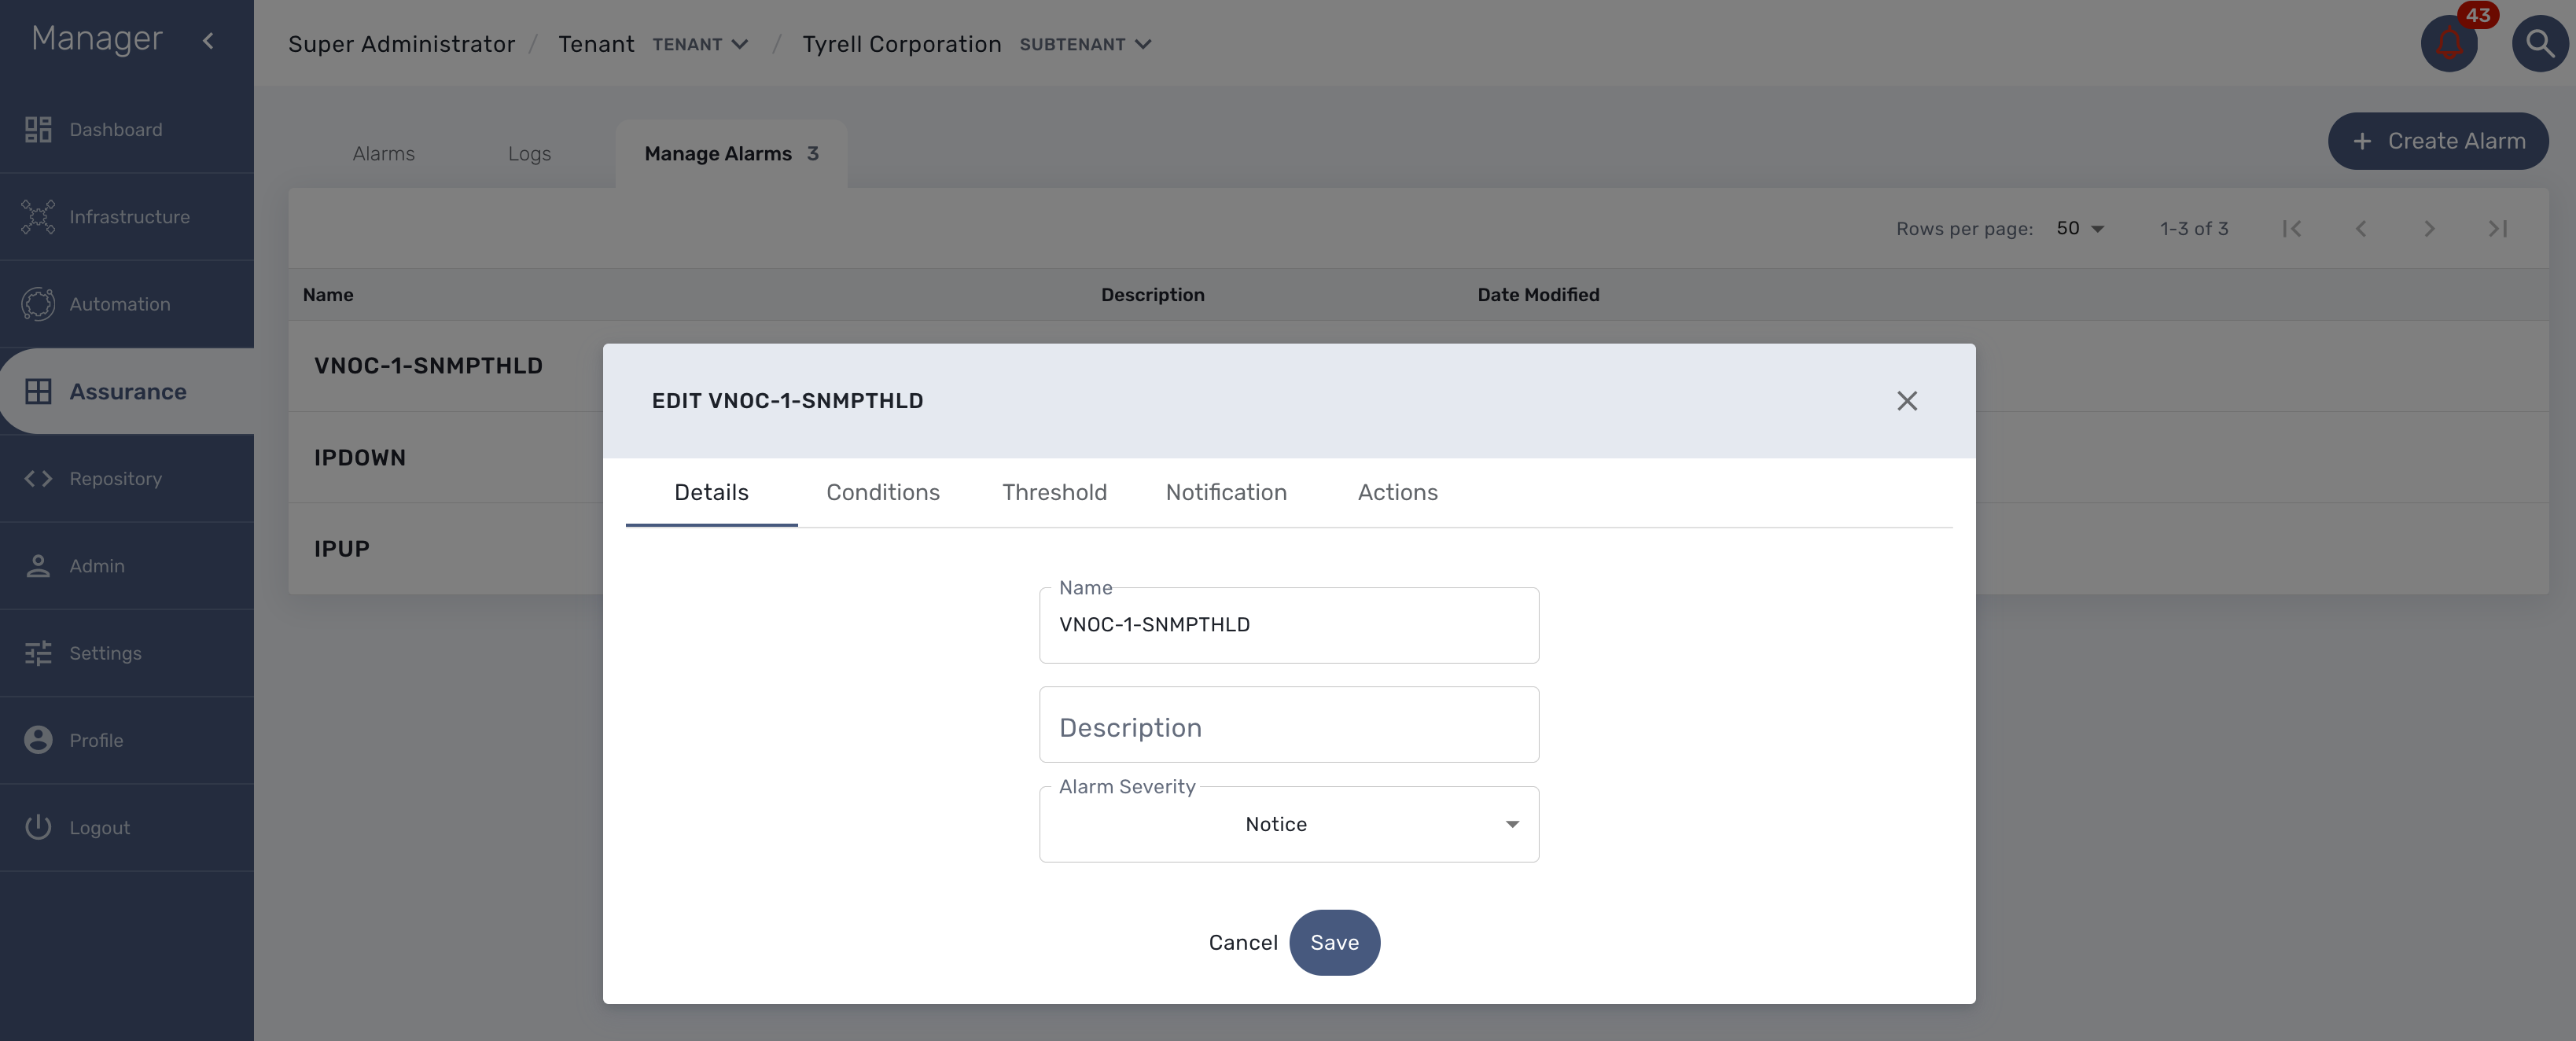
Detail
Provide a name for the alarm and the alarm severity.
Alarm severity selection will allow you to decide what will be the severity of the alarm.
Conditions
This is where we define the matching rules for the alarm.
A text that will used to search in the incoming logs to generate alarm.
If selected, the logs search for the alarm triggering will be considered only for the Manage Entity that belongs to that subtenant
If selected, the logs search for the alarm triggering will be considered only for that Manage Entity
If selected, alarm wil be triggered for the logs with only those Severities.
Threshold
Define the number of events and the time period to consider for triggering one workflow.
With the default value 0 log within 0 minute, no workflow process execution will be triggered so you need to set it at least as 1 log within 1 minute.
Notification
Select the user roles that will be notified by email when an alarm is raised.
| make sure that you have set an email to your user |
Actions
Choose the workflow and the process to execute when an alarm is triggered.
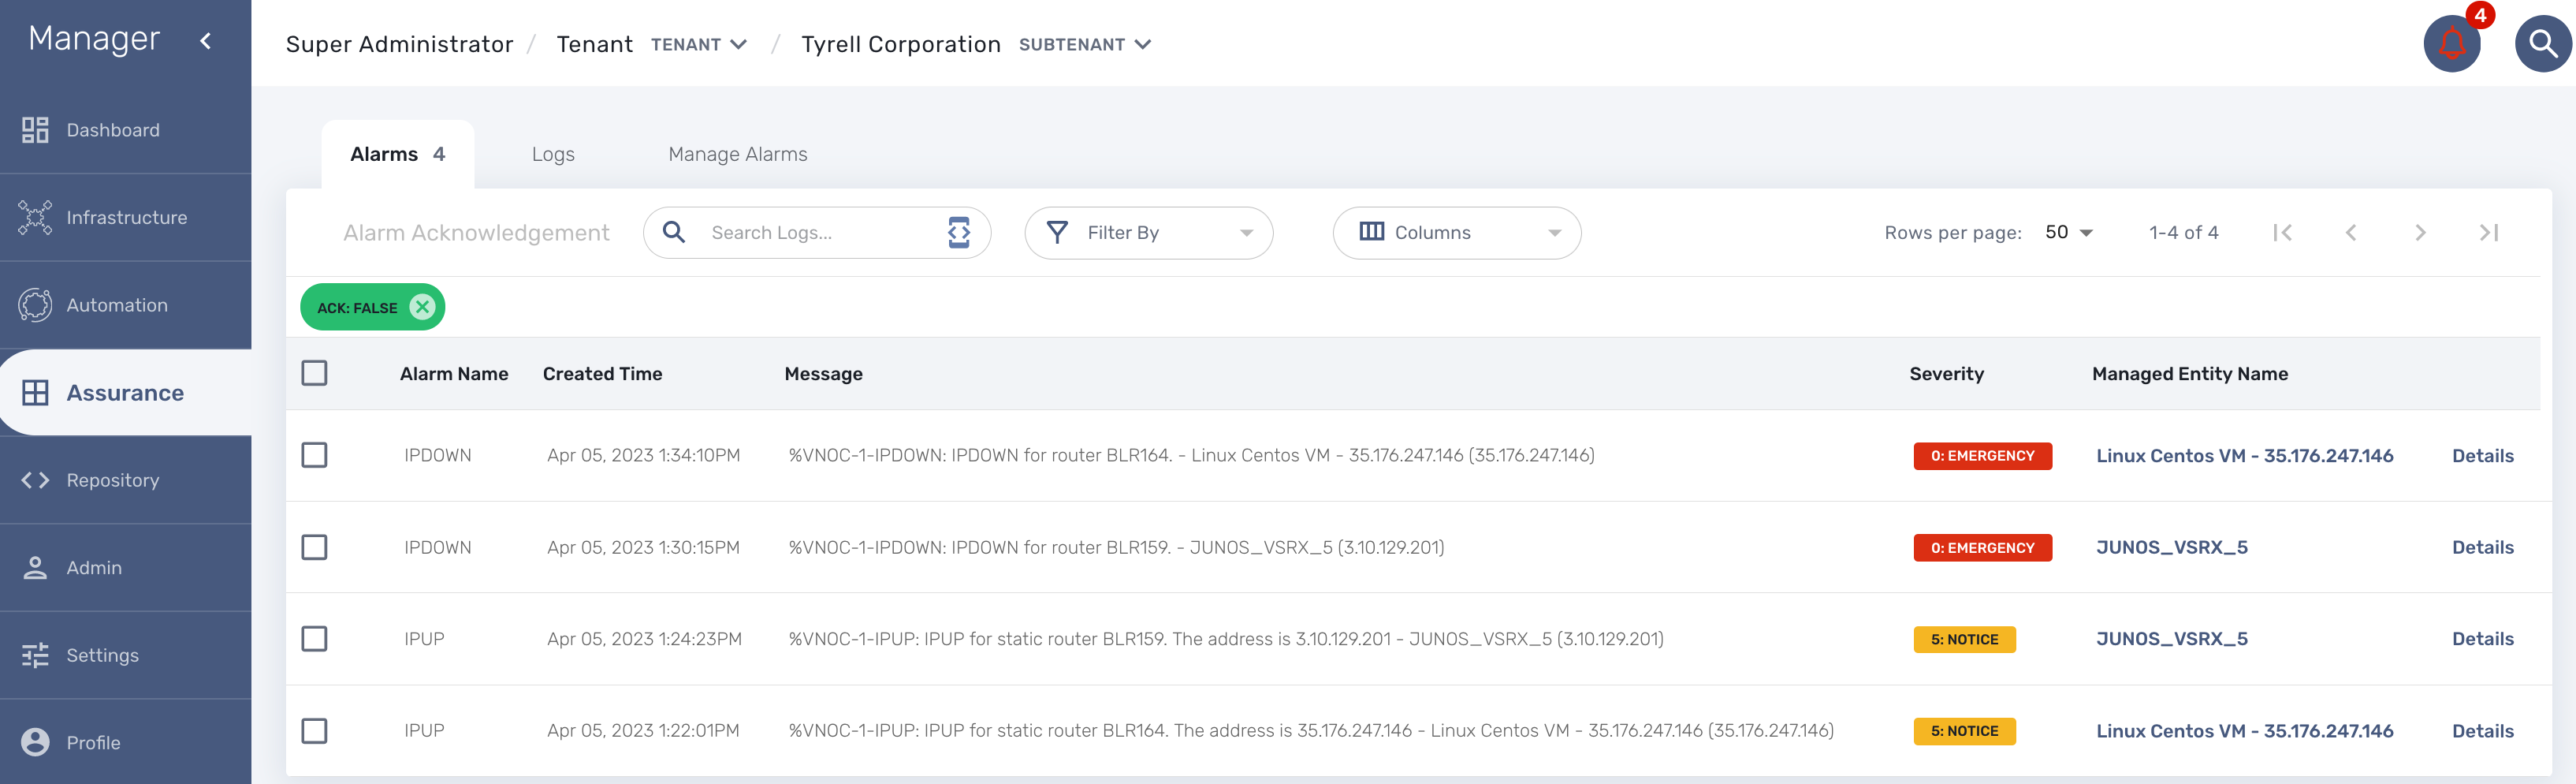
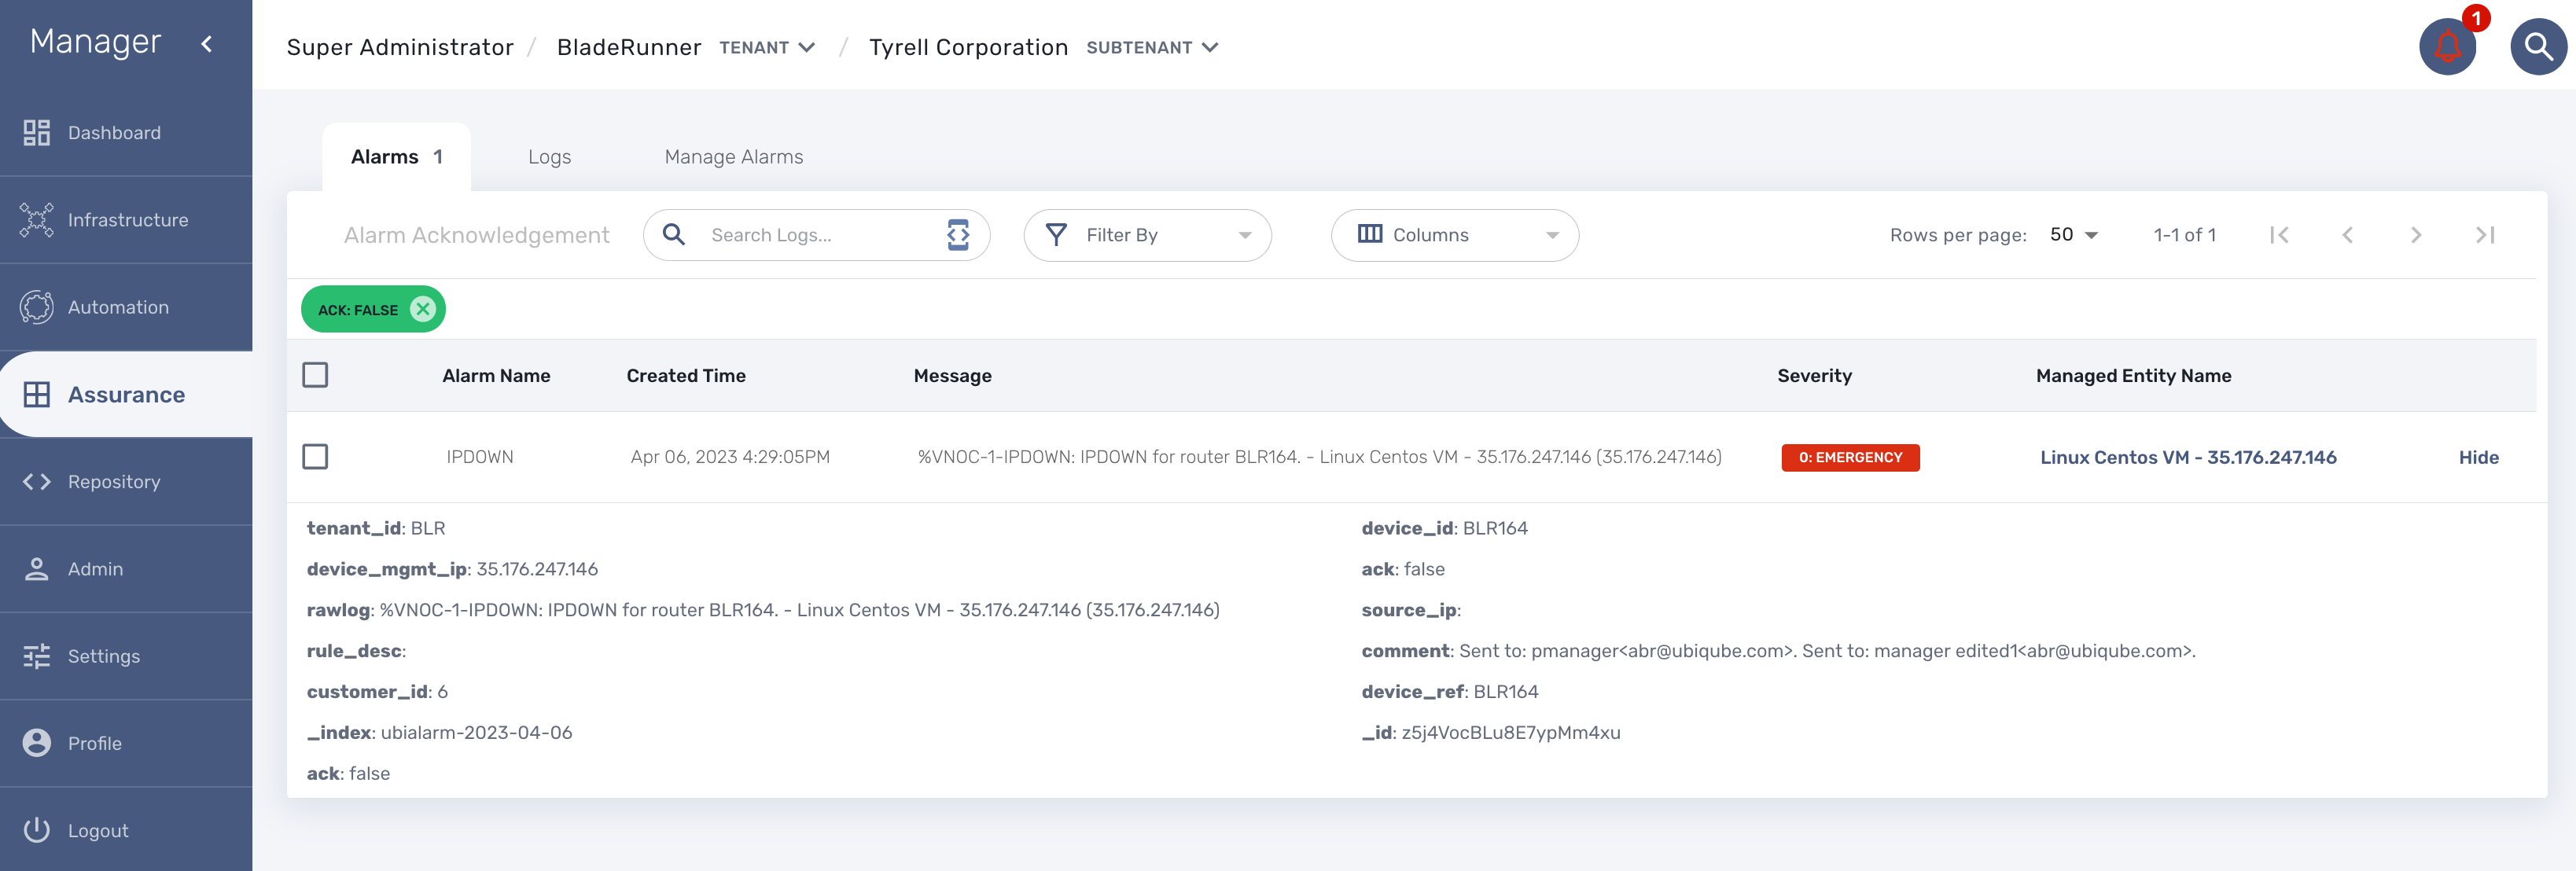
Alarm acknowledgement
As soon as an event is detected to be an alarm, a notification badge will appear at the top right of the screen showing the number of new alarm that require an user action (acknowledgement)
You have the possibility to edit an alarm, add a comment and acknowledge the alarm.
Testing
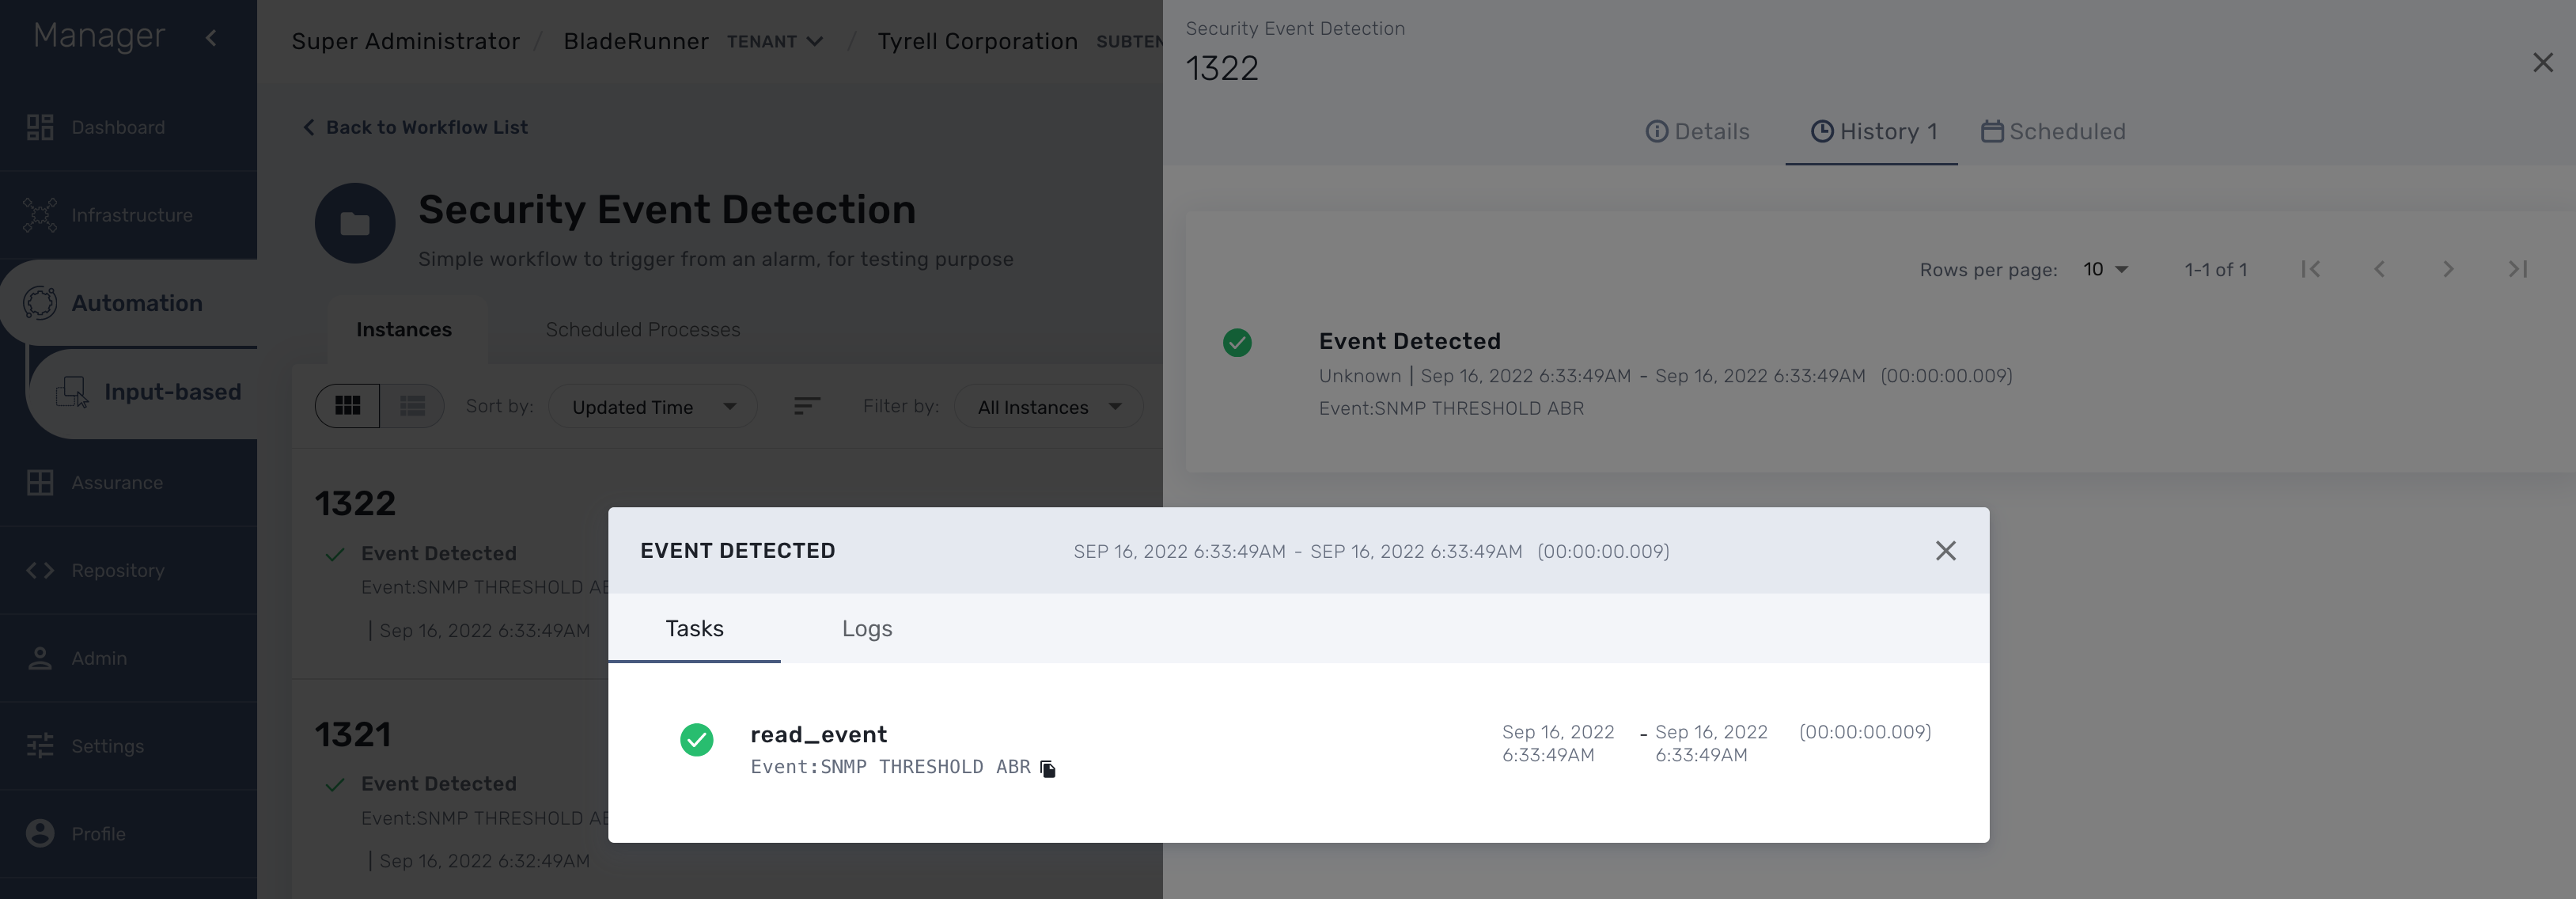
You can test the triggering of a process execution with the simple workflow "Security Event Detection" included in the mini-lab.
This workflow will execute a process to display the raw log that cause the alarm.
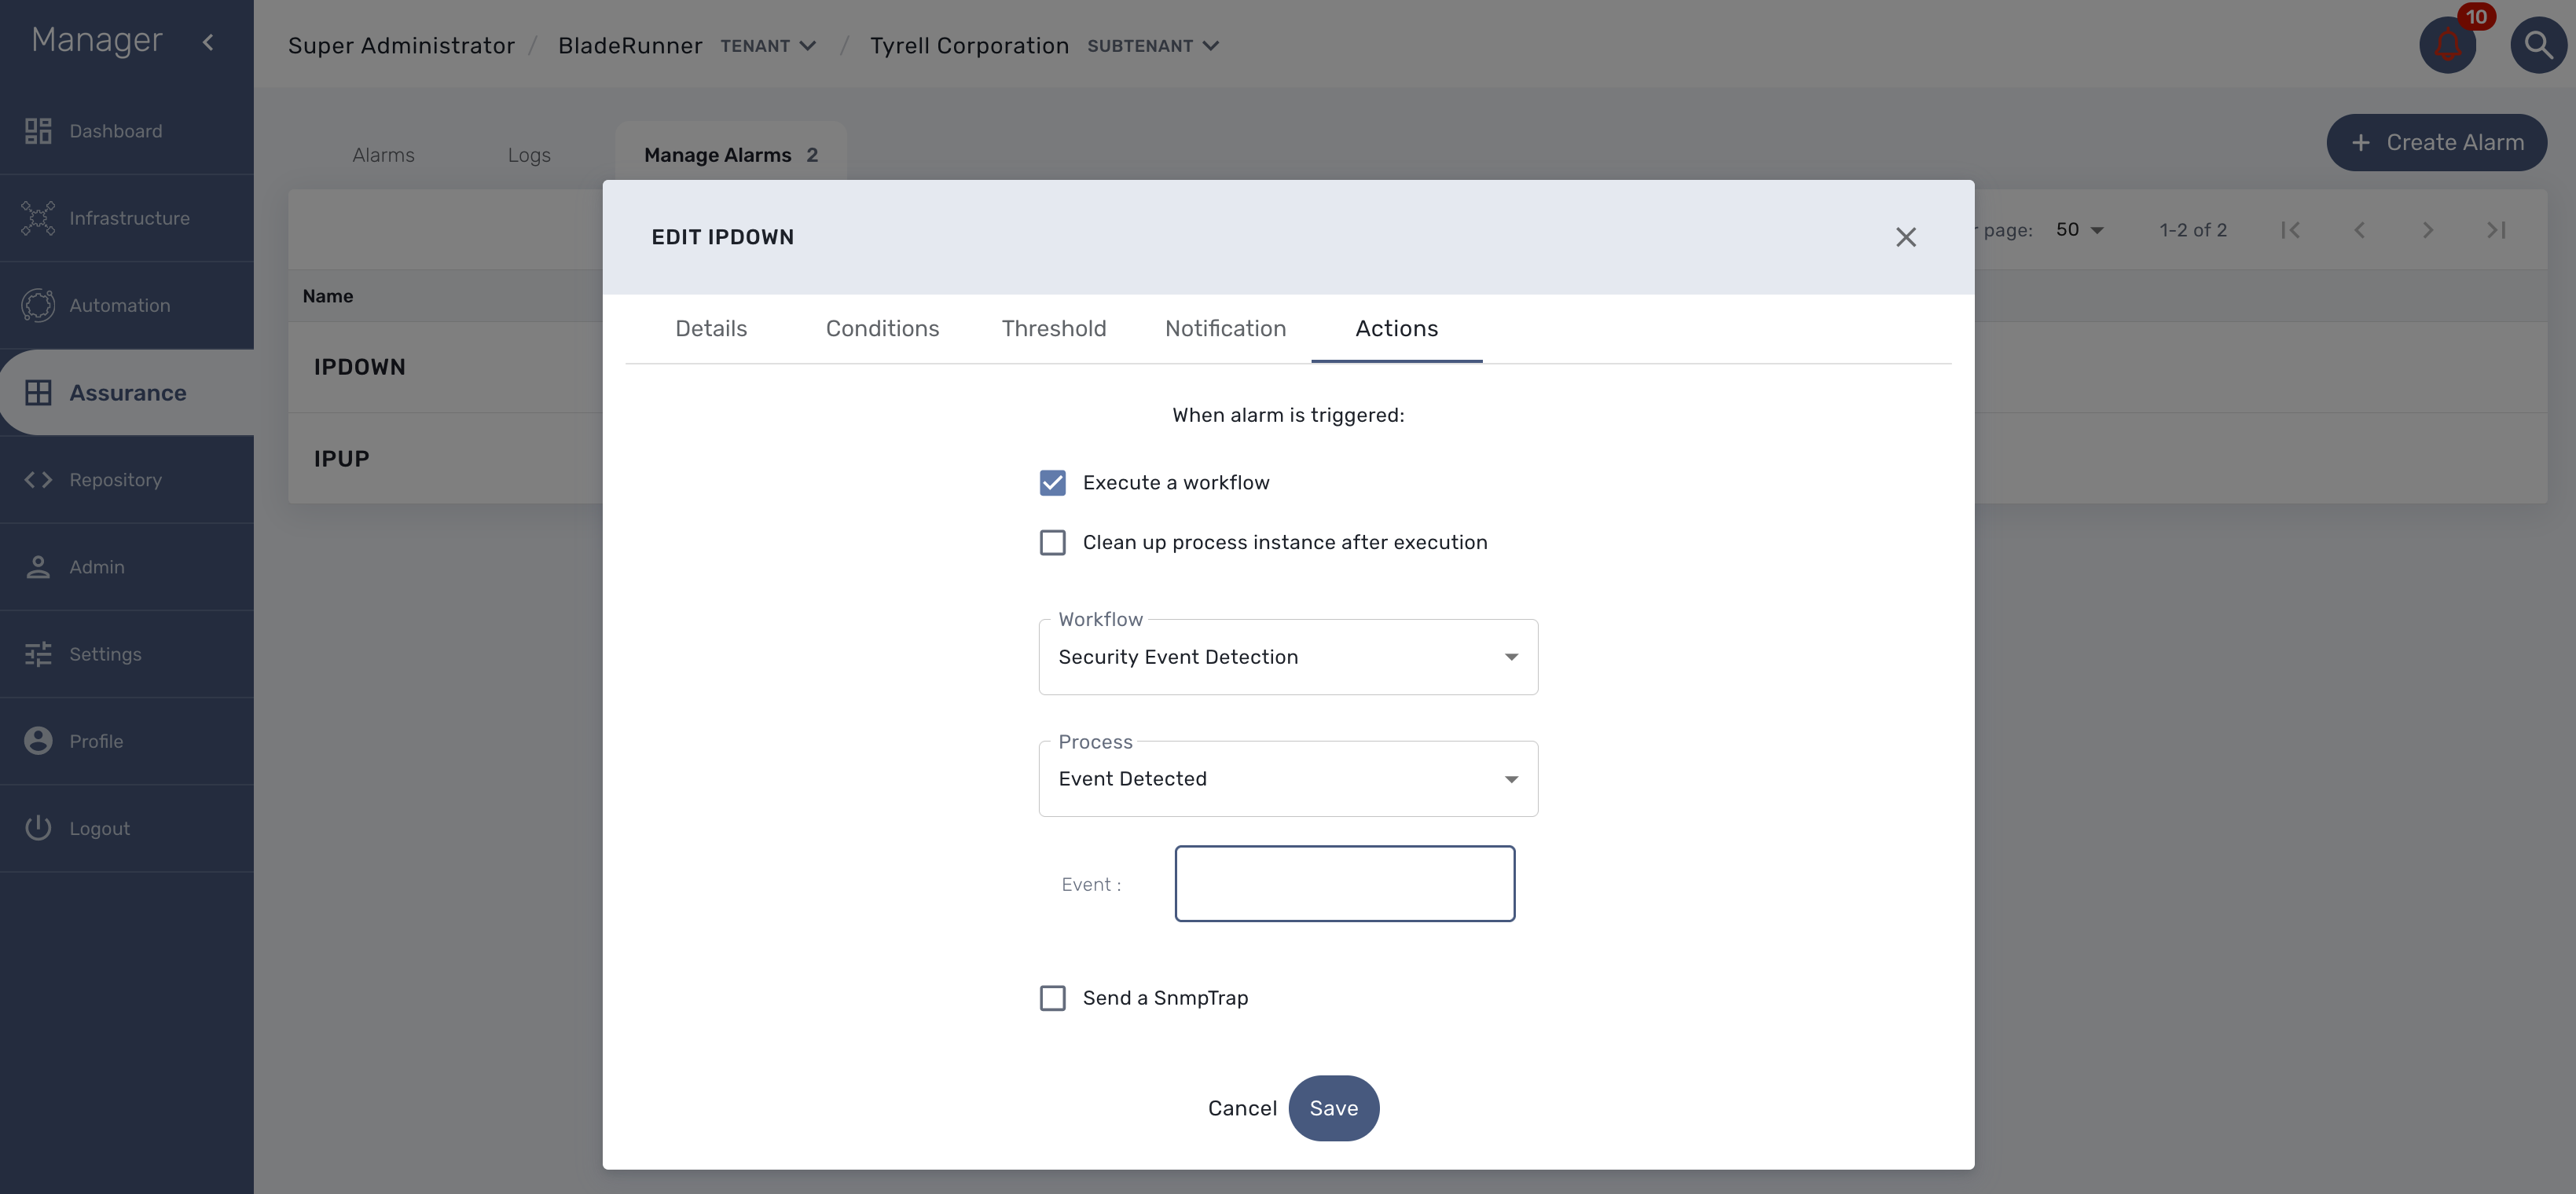
To trigger an event you can, for instance, stop one of the Linux container which will raise a IPDOWN event.
A new instance of the workflow should be created
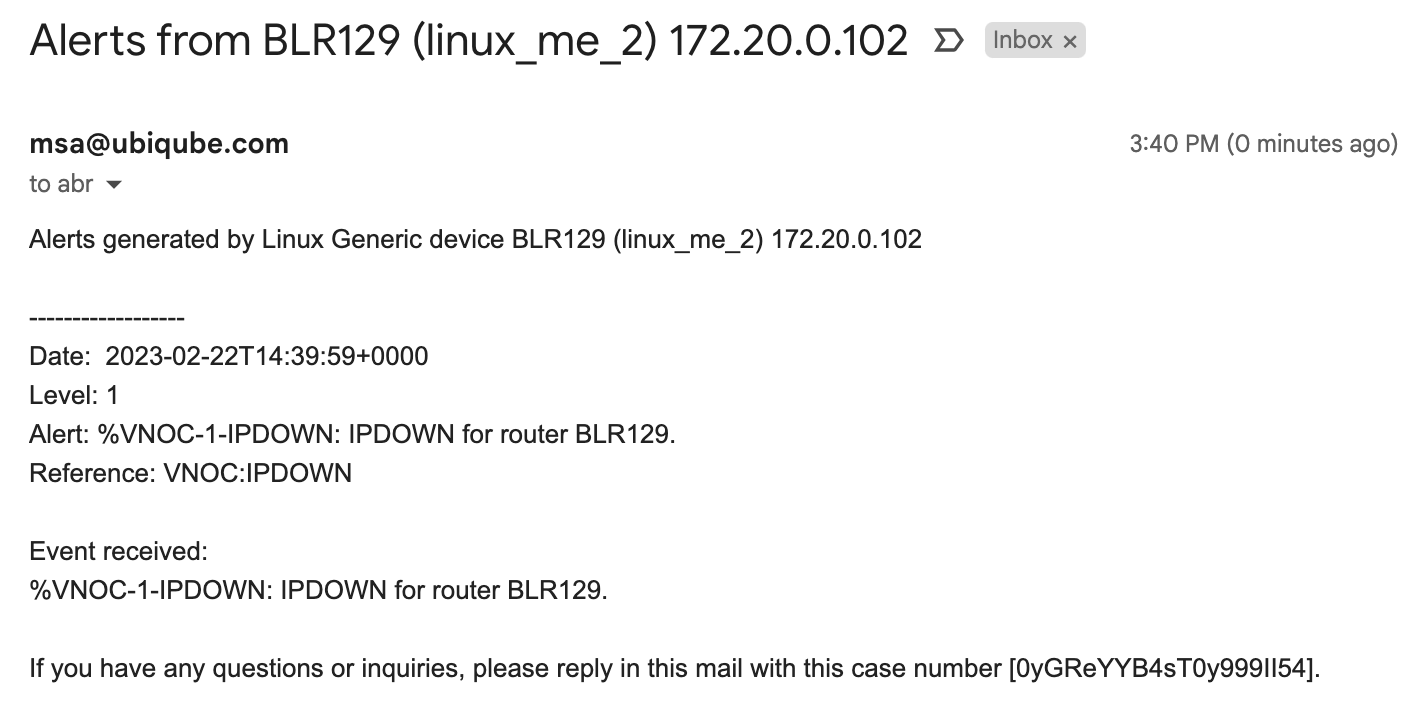
Email alerting: SMTP configuration
For alarms to be notified as email, we need the Docker host to be properly configured as a SMTP server or relay.
Alarm severity tuning
An alarm severity can be tuned by choosing the severity of the alarm when editing the alarm rule.
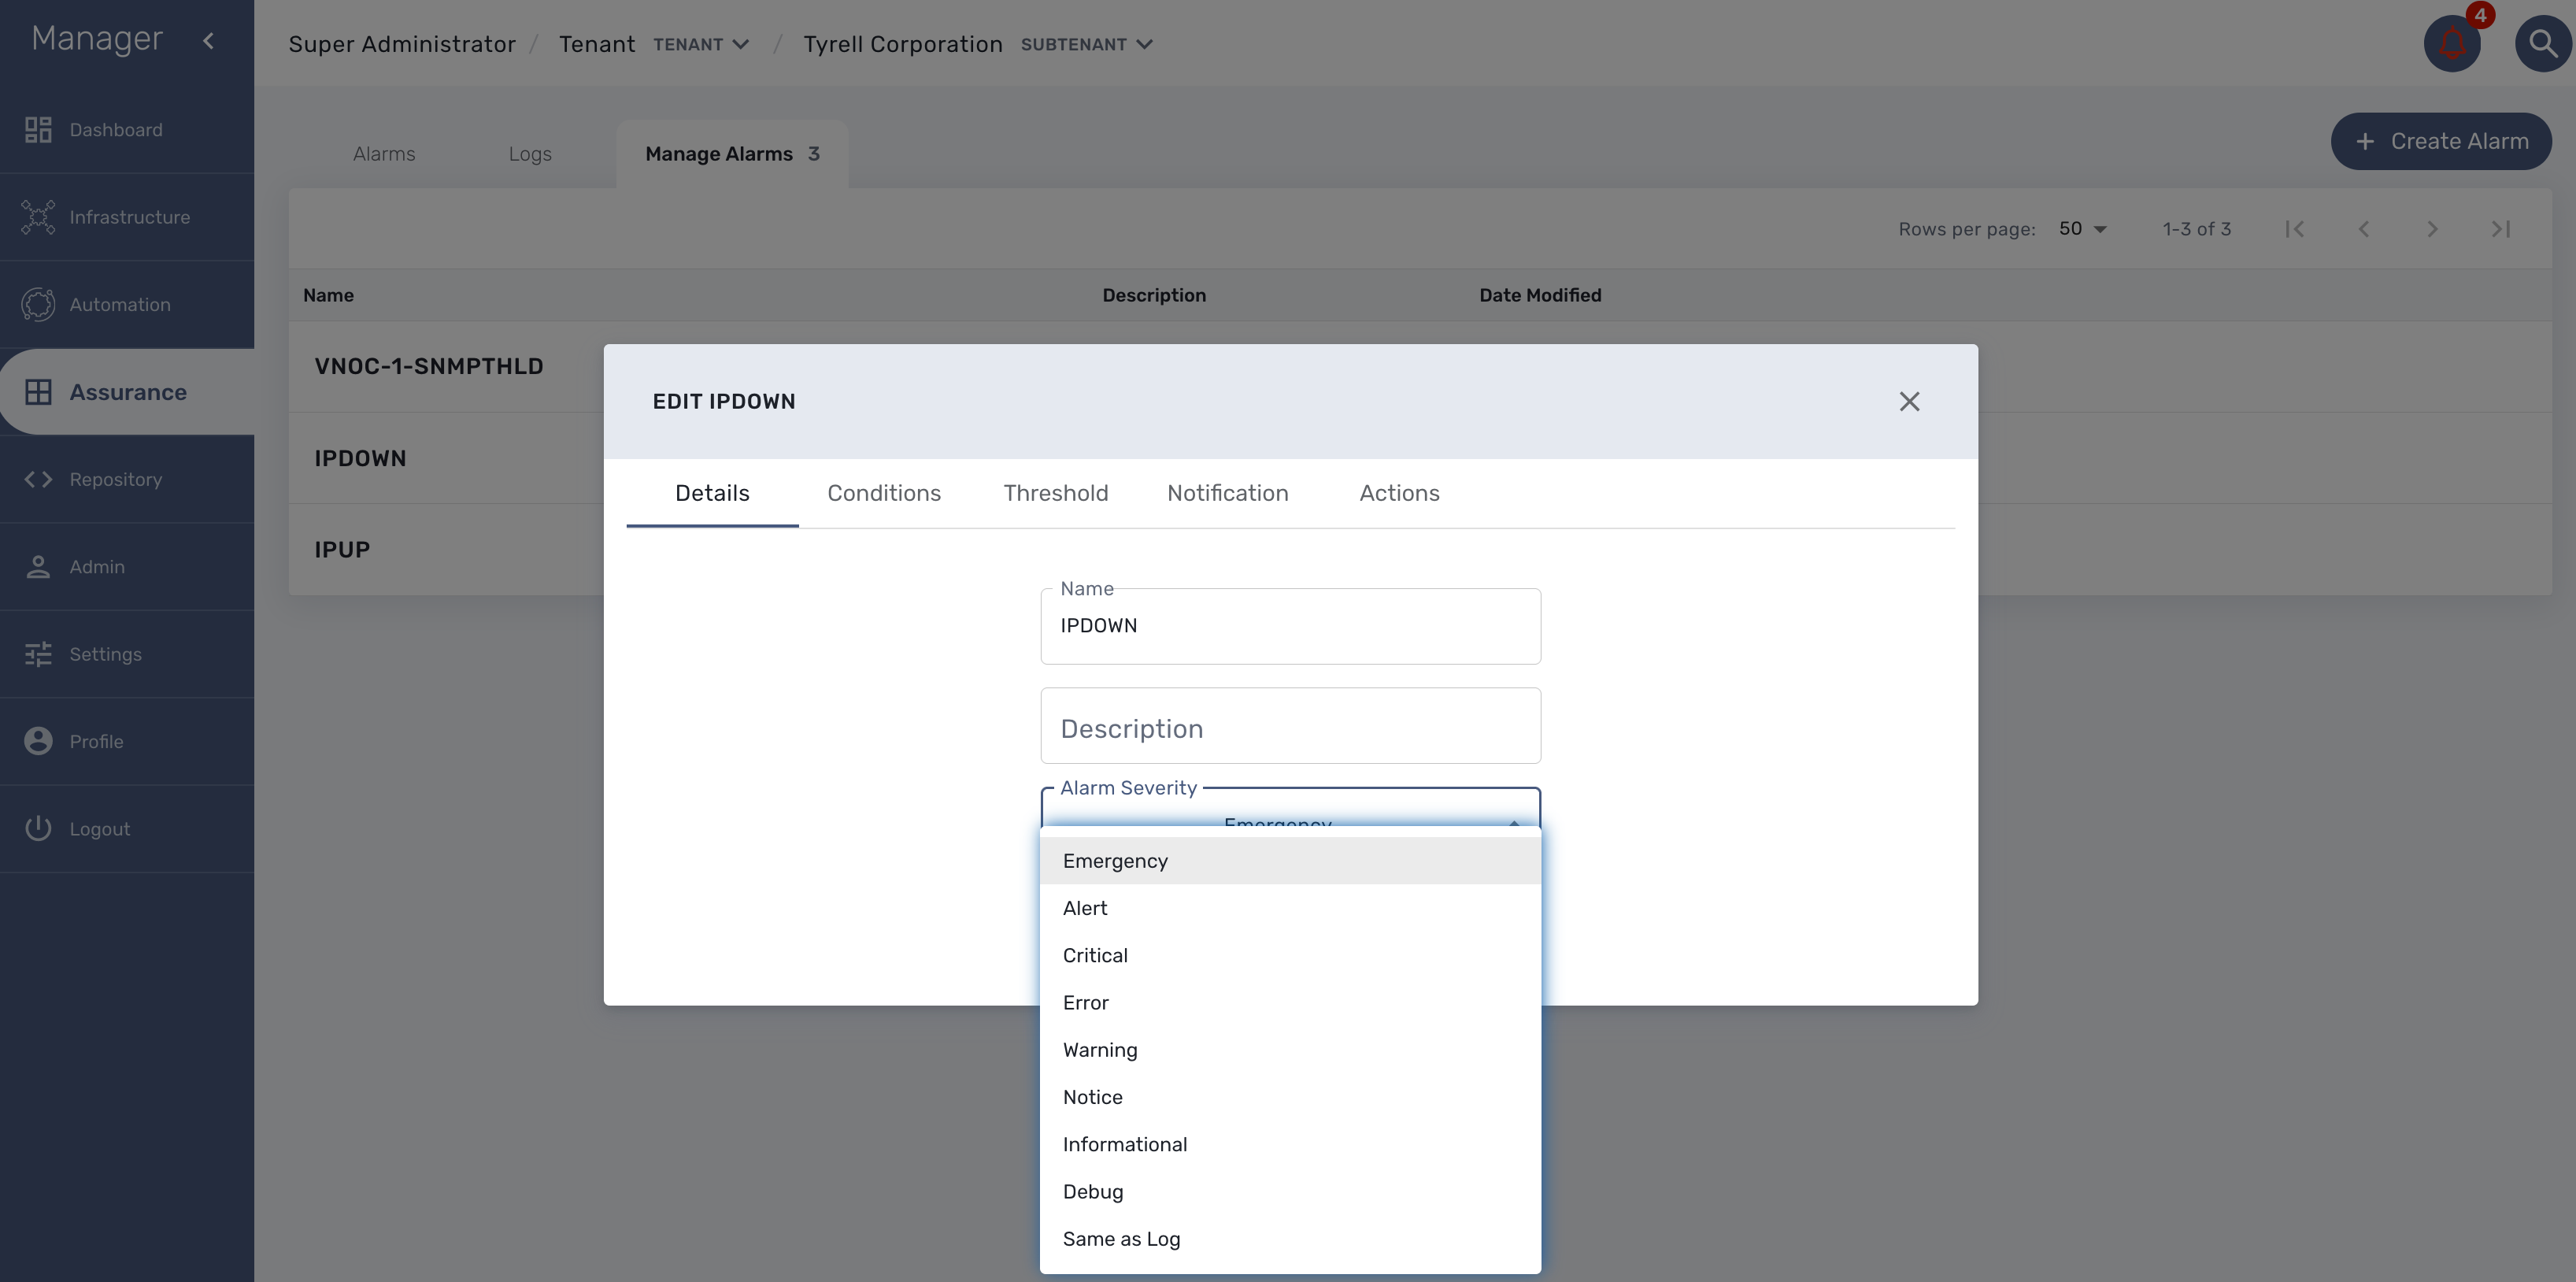
By default the alarm severity is the same as the severity of the source event but by selecting the severity, you can decide that an event with a high severity level should raise an alarm with a low severity level (or the other way around).
Example: it is possible to have an alarm rule to detect the VNOC event IPDOWN and configure the rule to have the highest level (Emergency) and an other alarm rule to detect the event IPUP with a lower severity (Informational)
This is very useful if SNMP traps are configured to be sent as you may not want to have all the SNMP traps detected with the same severity level.