|
|
|
The Installation and Configuration Guide will show you how to install, configure and activate the MSactivator™.
If you want to get started quickly, you can check the quickstart guide.
Architecture Overview
The MSactivator™ is an Integrated Automation Platform, which consists of several components running on Docker containers.
Overview of the platform
-
The MSactivator™ API server: this server provides a REST API layer on top of all the functions, it also provides the Workflow Engine responsible for executing the automated processes
-
The MSactivator™ Core Engine: this component, composed of several daemons is responsible for the configuration of the Managed Entities, the assurance and collecting the syslogs.
-
A PostgreSQL database: the MSactivator™ stores its state in a PostgreSQL database.
-
An Elasticsearch cluster: the MSactivator™ collects and stores the events and the alarms in an Elasticsearch server.
-
A BPM engine based on Camunda, fully integrated with Workflow Engine.
-
A Subversion based server to store the history of the configurations of the Managed Entities
-
REST API and UI: To control the MSactivator™, you can use either the web based interface or the REST API.
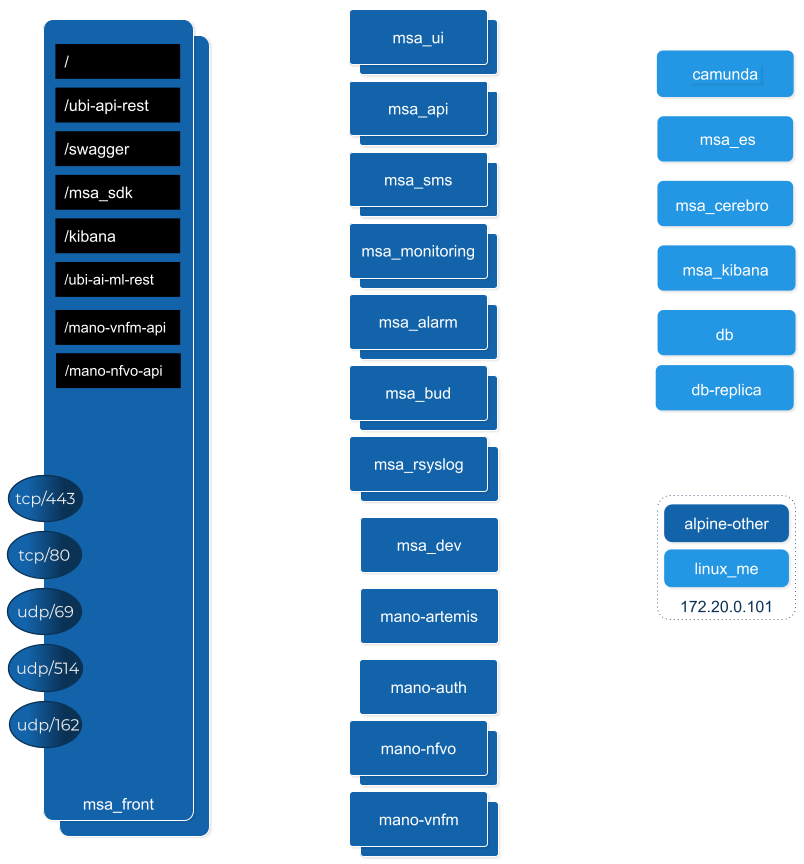
Overview of the docker containers
Containers description
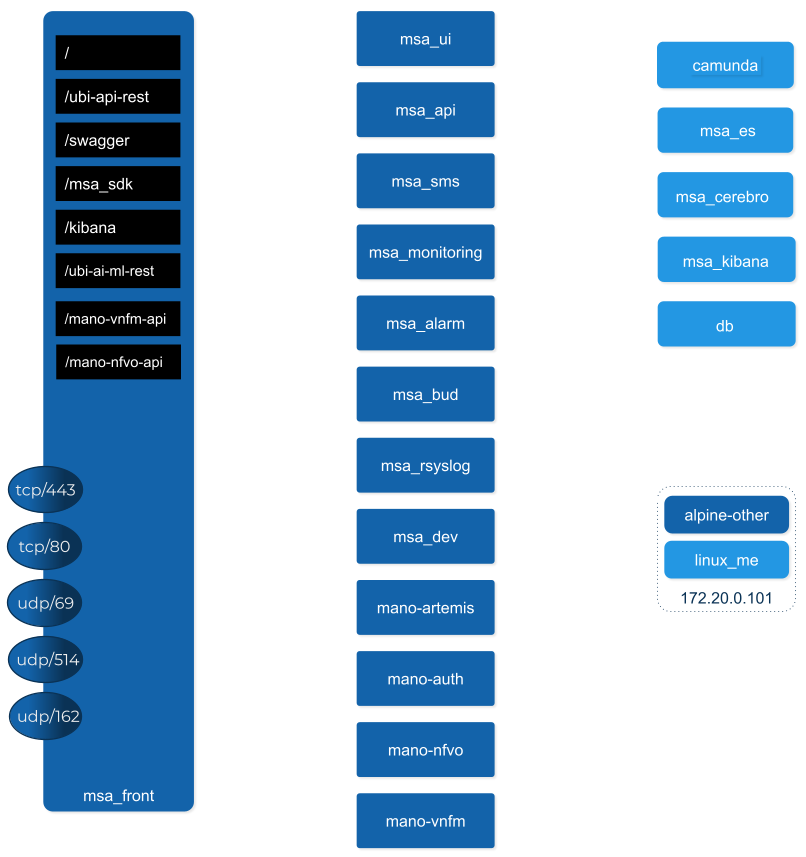
msa-front
Runs NGINX and act as the front end to route the requests to the internal containers.
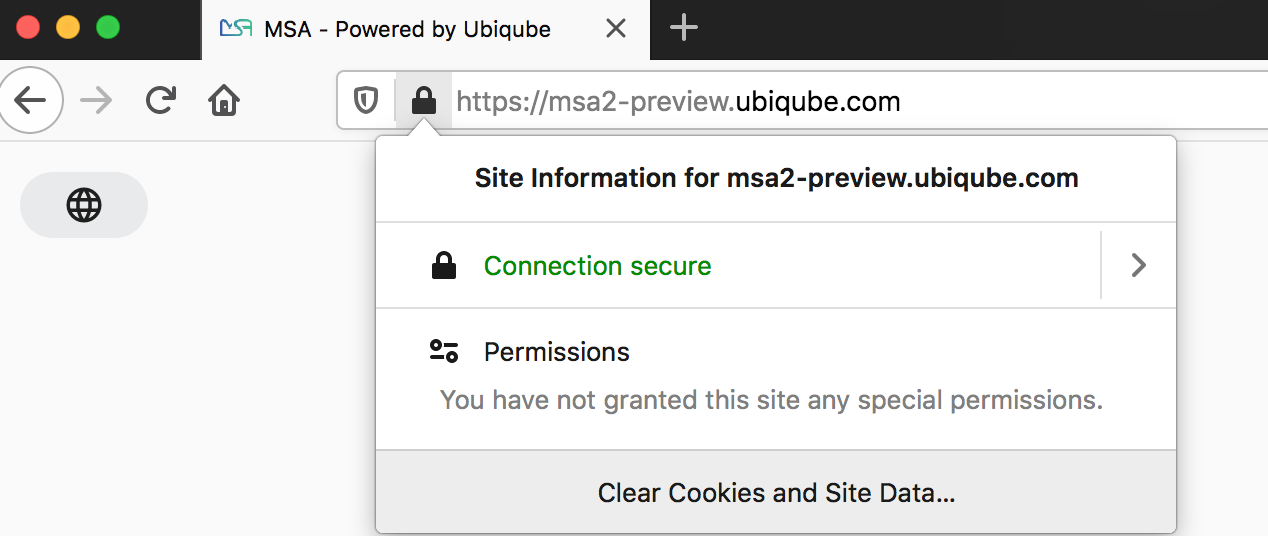
The NGINX server is configured with a self-signed SSL certificate to allow HTTPS connection. When you access the UI for the first time after the installation of the product, your browser will problably show a warning message and you will have to accept this certificate to access the web UI.
msa-ui
Runs the MSactivator™ web based interface. On a local setup you can connect to the UI with https://localhost.
msa-api
Runs the REST API on a Wildfly based container.
This container is in charge of exposing the REST API used by the web UI, the workflows or any other third party tool willing to integrate with the MSactivator™.
msa_api also runs all the business logic such as the scheduling of the workflow and the BPM execution, the execution of the microservice logic,…
This container is also taking care of the token based authentication
msa-sms
Runs the CoreEngine for configuration and assurance of the managed entities.
This container is in charge of getting the microservice request for configuration and transforming them, by making use of the relevant adapter, into the managed entity management language (specific CLI command, REST API,…)
This container will also poll the device for assurance KPI and collect/analyse the syslogs sent by the managed entities.
msa-monitoring
In charge of monitoring the managed entities either based on default KPI (ICMP and/or SNMP) or on custom monitoring profile as well as executing the asset management scripts provided by the adapters.
msa-alarm
Takes care of event detection to create alarm and execute workflow or send email notifications
msa-bud
Takes care of cross table data synchronization and consistency in the database
msa-rsyslog
In charge of collecting syslogs and SNMP traps and forward them to the msa-sms for parsing
msa-dev
A linux based container used for storing the assets shared across containers such as microservices, workflows, adapters code,…
This is the container you need to use for your own devOps related work such as installing a new adapter, pulling or pushing code to a git repository, installing some new workflow or microservices from a git repository,…
camunda
Runs the BPM engine
msa-ai-ml
Runs the AI engine (prototype - not supported in current version)
msa-es, msa-cerebro and msa-kibana
Run the Elasticsearch container, Cerebro and Kibana.
db
Runs the PostgreSQL database when the MSactivator™ administrative data and configuration data is stored.
alpine-other, linux-me
Additional containers for testing, prototyping and training
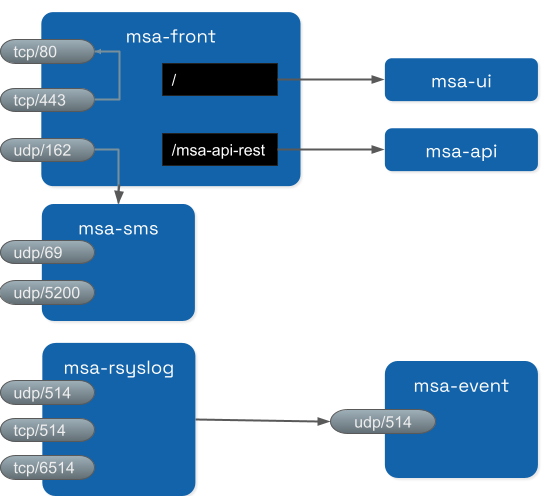
Networking and connectivity
Incoming traffic
By default the whole network traffic coming from external systems goes through the msa_front container, this includes proxying the TCP/443 and TCP/80 traffic access to:
-
/: Manager and Developer portal running on containermsa_ui -
/ubi-api-rest: REST API running in containermsa_api -
/kibana: Kibana running in containermsa_kibana -
/swaggerREST API Swagger documentation and/msa_sdkWorkflow Python SDK documentation are both inmsa_frontcontainer
It also includes the network traffic coming from the managed entities:
-
syslog coming from managed entities on port udp/514
-
SNMP traps coming from managed entities or a third party OSS element on port udp/162
-
TFTP request coming from managed entities or a third party OSS element on port udp/69
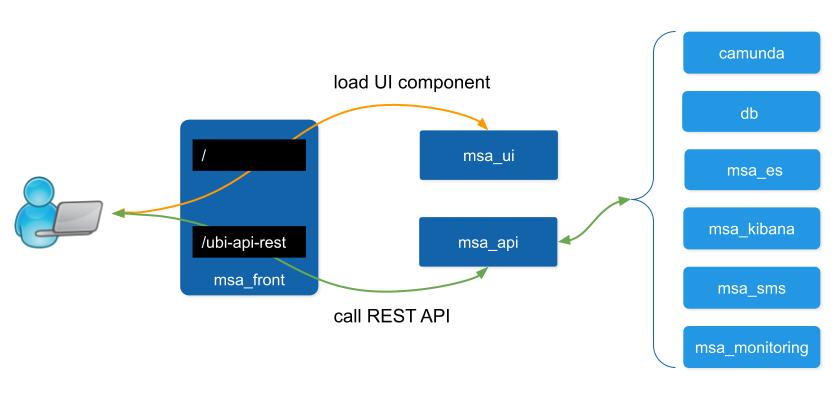
Ingress traffic
Ingress traffic is mainly composed by traffic coming from the end user browser accessing the web portal or by external third party system calling the REST API. Ingress traffic also includes traffic coming from managed entities sending syslogs or SNMP traps.
Web portal use
When an user browser accesses the web UI, all requests coming from the browser will be redirected to the REST API container (/ubi-api-rest).
-
BPM executions are proxied by the container msa_api to the
camundacontainer. -
Log and alarm search queries are proxied by the container msa_api to the
msa_escontainer. -
Actions related to the managed entities are proxied by the container msa_api to the
msa_smsormsa_monitoringcontainers.
Managed entities
Network packet incoming flow
Entity management includes the activation, microservice configuration and import, monitoring syslog collection and alarm triggering.
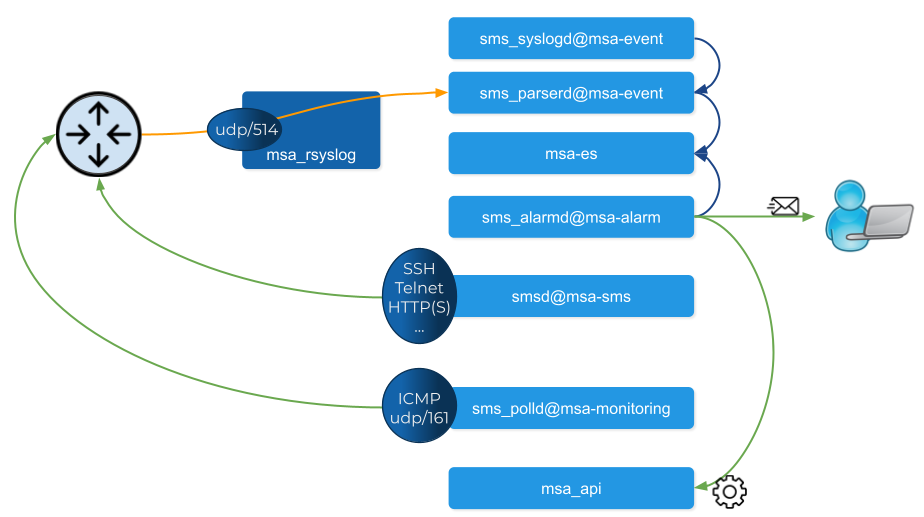
Activation (aka initial provisioning) usually includes a verification of the connectivity between the msa_sms container and the managed entity.
Depending on the vendor and model, the protocol used for the connection usually varies between SSH, Telnet or HTTP/HTTPS (this distinction is done at the adapter layer).
The configuration based on microservices is usually based on the same protocol as the initial connection.
The actions related to configuring the managed entities or pull its configurations are handled by the process smsd running in the msa_sms container
KPI monitoring is based on ICMP for the availability as well as SNMP (UDP/161) requests for the other KPI (traffic, CPU, memory,…).
The monitoring process is sms_polld, running in msa_monitoring container.
Syslog are collected on the port 514 exposed by msa-rsyslog container and forwarded to the container msa_event.
In msa_event, the syslogs are processed by 2 processes: msa_syslogd and msa_parserd.
The alarm definition stored in the database are used by the process sms_alarmd in msa_alarm container.
This process identifies the logs that should trigger an alarm it will create a new alarm in a dedicated Elasticsearch index in msa_es container.
Based on the alarm definition, the process will send an email to the end user and/or execute a workflow by call a REST API in msa_api container.
Volumes and data
In order to persist the data, the MSactivator™ uses docker volumes:
These volumes are declared at the end of the docker-compose file:
volumes:
  msa_api:          (1)
  msa_db:           (2)
  msa_dev:          (3)
  msa_entities:     (4)
  msa_repository:   (5)
  msa_es:           (6)
  msa_api_logs:     (7)
  msa_sms_logs:     (8)
  msa_bud_logs:     (9)
  mano_db:          (10)
  mano_nfvo:        (11)
  mano_vnf:         (12)
| 1 | volume shared by the containers msa_api and msa_dev to store the adapter configuration for the UI |
| 2 | database volume used by the container db |
| 3 | volume shared by the containers msa_dev and msa_sms, used to store the adapter git repository. This is where you can store your other DevOps related files. |
| 4 | volume shared by the containers msa_dev, msa_api and msa_sms, used to store the associations between the managed entities and the deployment settings as well as the subtenants and the workflows |
| 5 | volume shared by the containers msa_dev, msa_api and msa_sms, used to store the sources of the microservices, the workflows, the BMP,… |
| 6 | volume used by Elasticsearch to store the indexed data. |
| 7 | volume for storing API and workflow process logs |
| 8 | volume for storing CoreEngine logs |
| 9 | volume for storing Batchupdated daemon logs |
| 10 | volume for mano database |
| 11 | volume to persist nfvo files |
| 12 | volume to persist vnf viles |
Installation and Configuration
The installation and configuration guide will show you how to install, configure and activate the MSactivator™.
Installation
For installing a standalone setup, you can check the quickstart guide.
For installing an HA setup, you can check the high availability installation guide.
Configuration
Once installed, the MSactivator™ settings can be updated.
Global Settings
While logged in as the super-user (ncroot), the user can now change MSActivator settings, namely those settings for the MSActivator instance itself, in the new “MSA Variables” section found on the “Settings” screen.
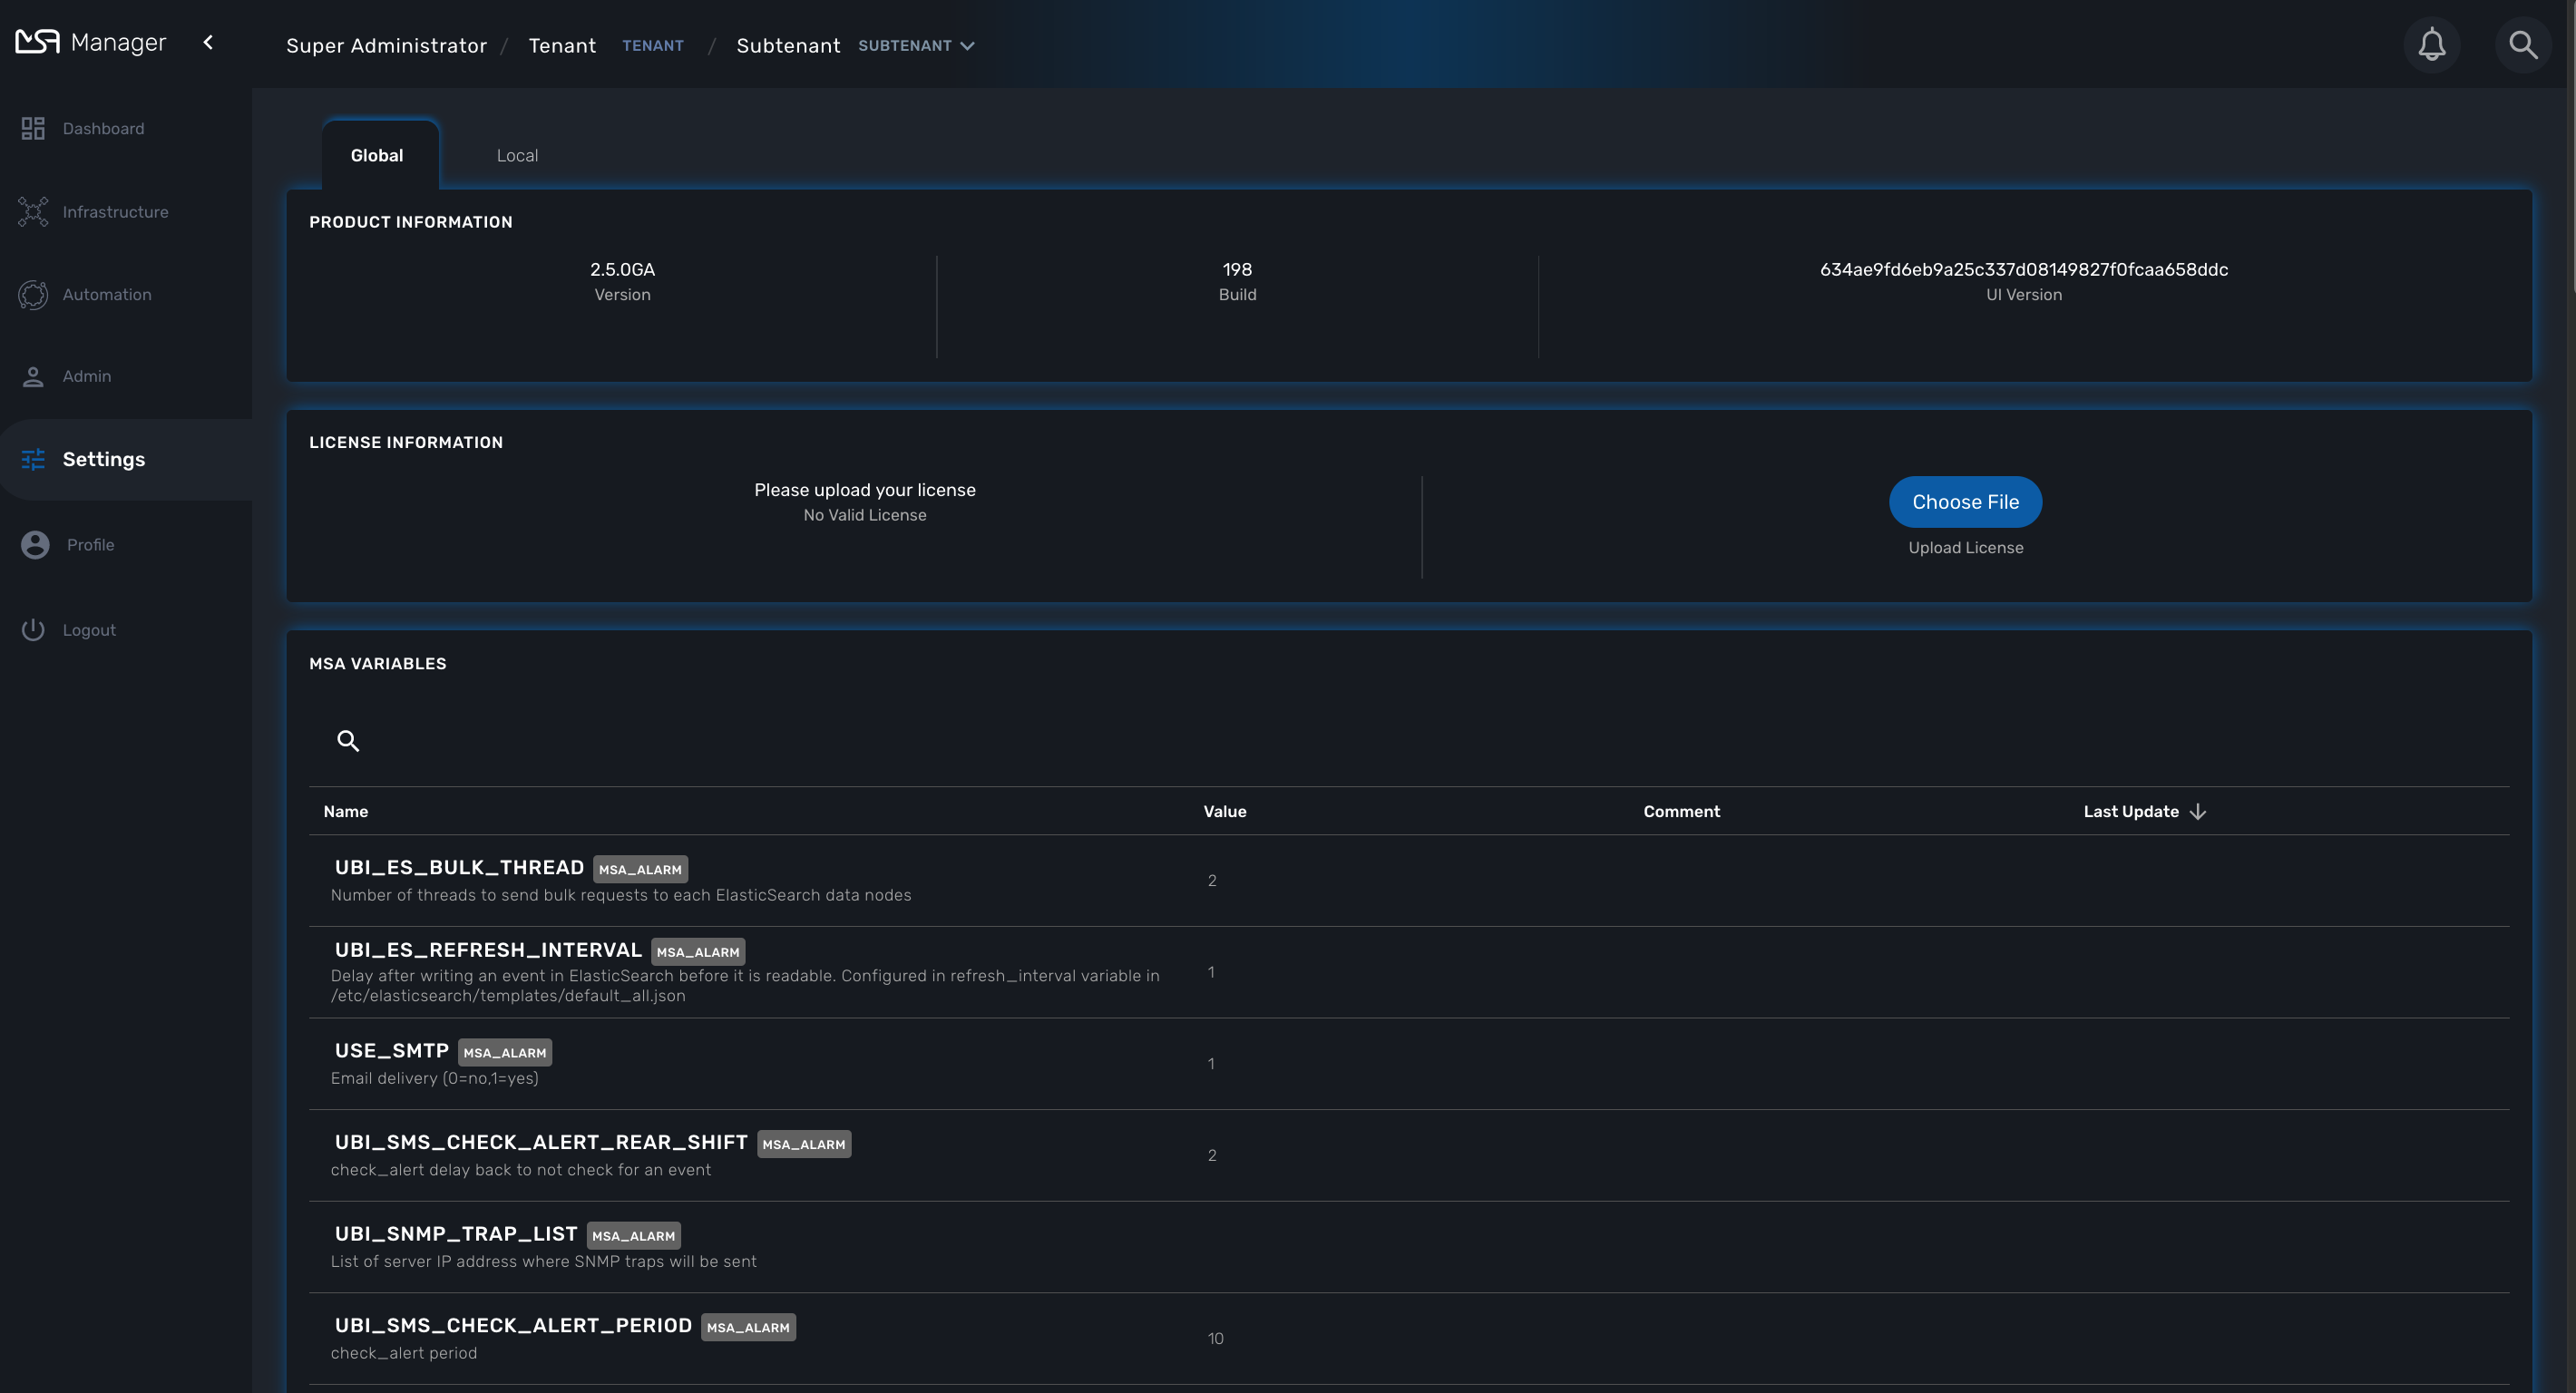
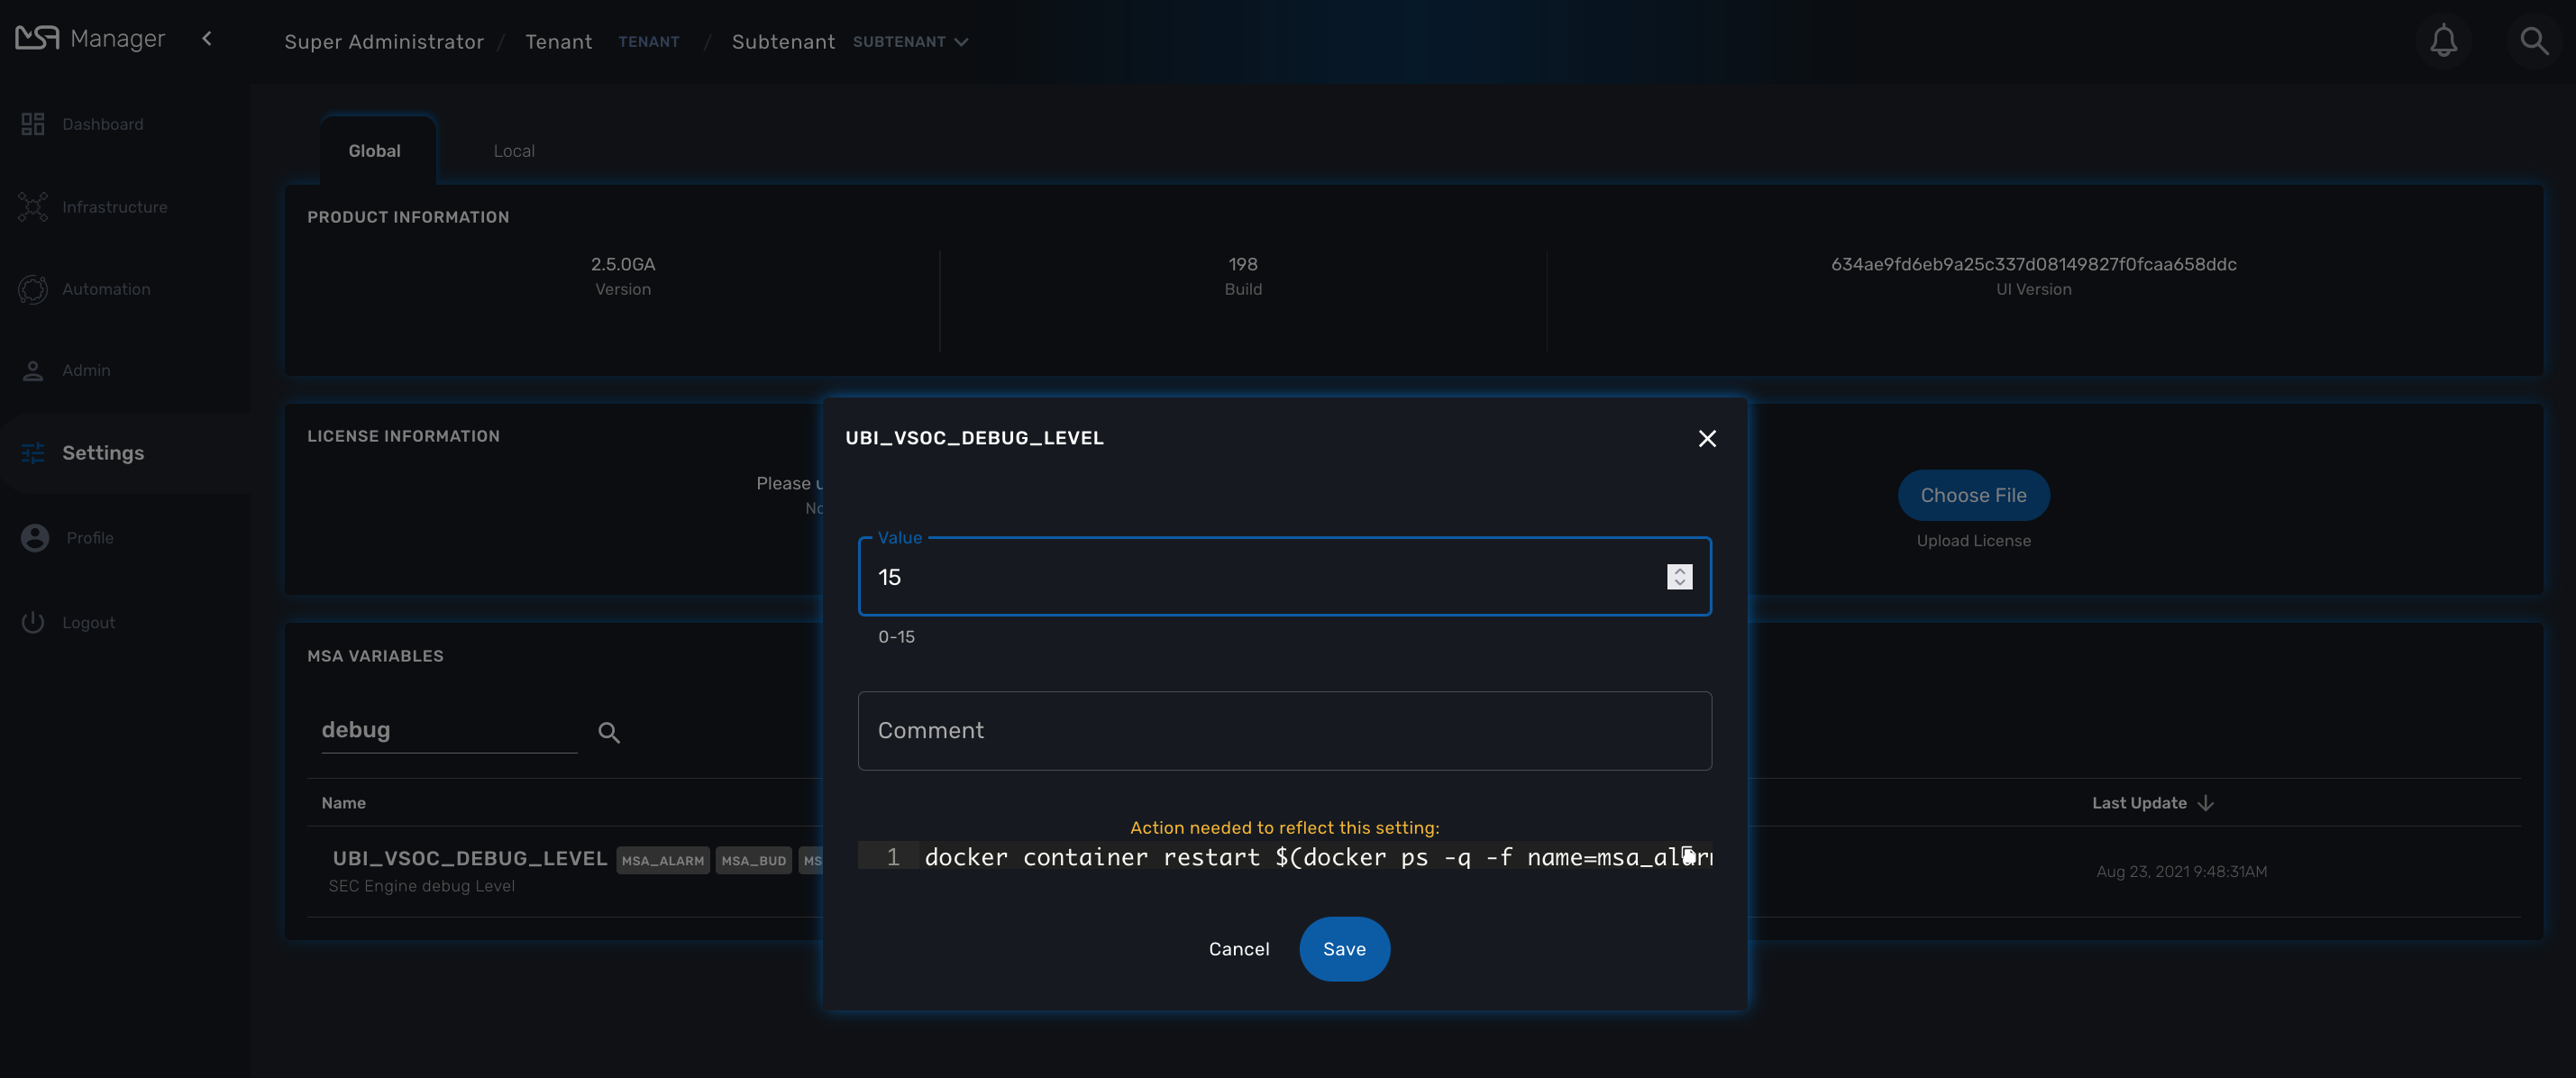
If any additional steps are required for any of those global settings, for example container restarts, those steps will be provided in the same screen the user uses to edit the values.
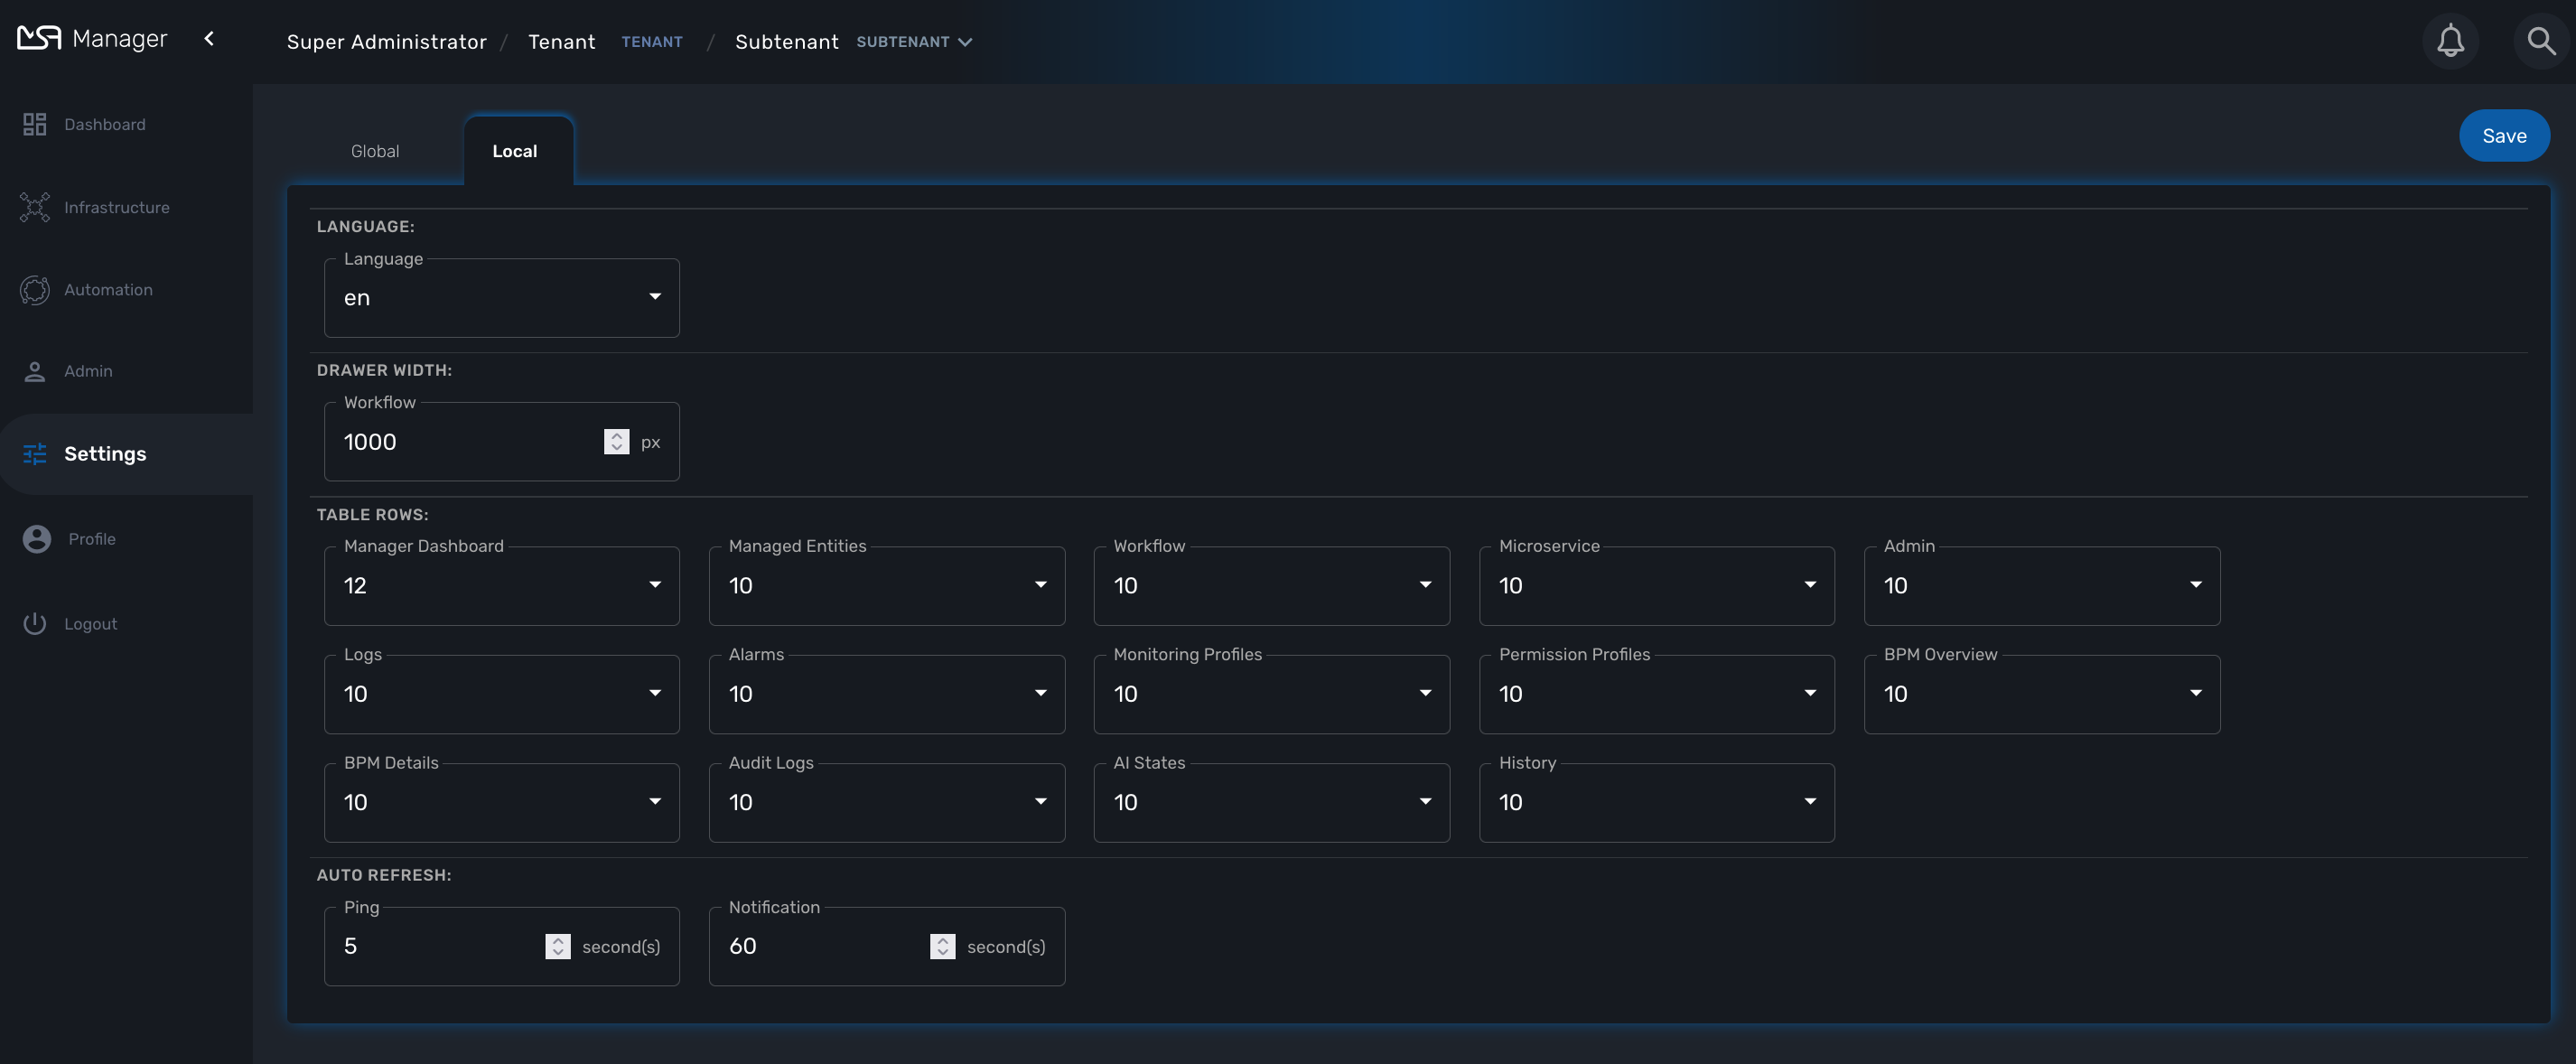
Local Settings
There is also a “Local” tab, in which you can find optional settings for the MSActivator UI. It is fine to leave these with the default settings, however, MSActivator super-users now have the ability to tweak these settings if required.
License Activation
Whether you have installed the MSactivator™ with the quickstart or started to do a longer PoC you need a license. Quickstart environment comes with a trial license installed automatically and valid for 30 days limited to 5 managed entities. If you do not have your license yet, for a production license contact your sales representative, otherwise for a free trial license please visit: ubiqube.com/free-trial.
This documentation discusses the activate of a new license.
License types
PROD (Production): for production setups.
A production license controls the maximum number of device that can be managed at the same time by the MSactivator™.
When this limit is reached, the user won’t be able to create any new devices but he will be able to delete some devices in order to free a few license slot.
When the expiration date is reached, the MSactivator™ will continue to work as usual but the product upgrade won’t be allowed
POC: for Proof of Concept
A PoC license controls the maximum number of device that can be managed at the same time by the MSactivator™.
When this limit is reached, the user won’t be able to create any new devices but he will be able to delete some devices in order to free a few license slot.
When the expiration date is reached:
-
the MSactivator™ will switch to a "degraded mode": device configuration with microservice is deactivated.
License activation
You must be connected as a privileged administrator (ncroot) to install the license.
As a privileged administrator, click on the link "Setting" on the left menu.
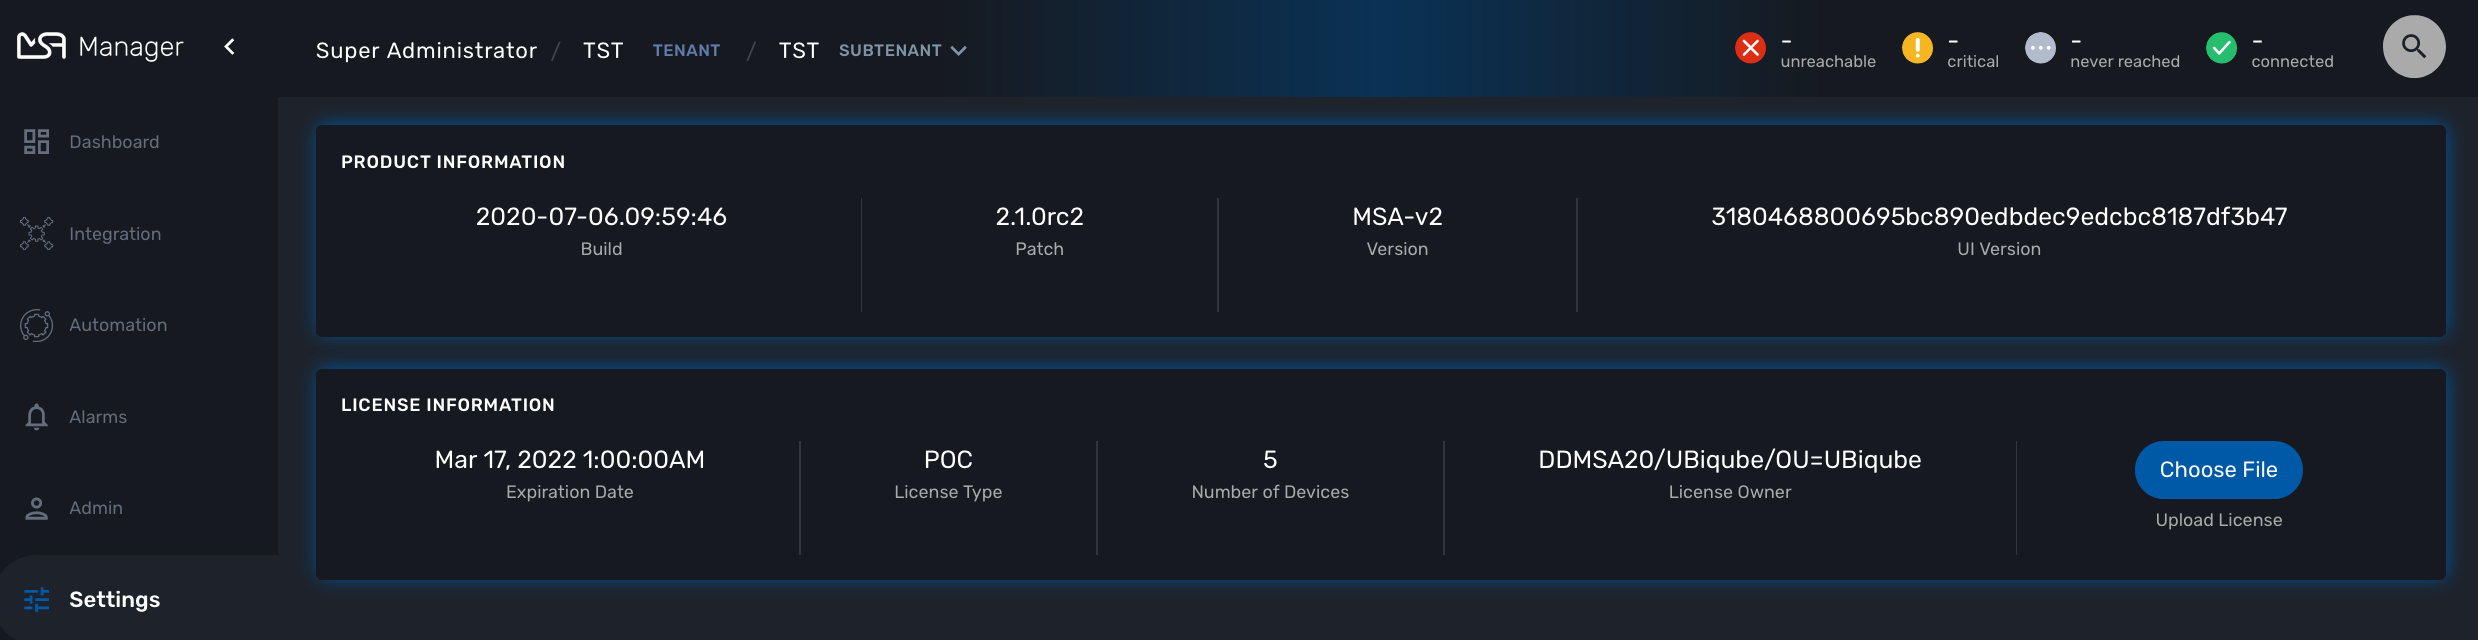
Click on "Choose file…" and select your license file (.lic).
If the license is valid, the web page will display the license information otherwise the license activation will be refused.
High Availability Installation Guide
The MSactivator™ provides support for high availability, based on "Docker Engine Swarm" mode.
Overview
The MSactivator™ provides support for high availability, based on "Docker Engine Swarm" mode.
Manager nodes handle cluster management tasks such as:
-
maintaining cluster state
-
scheduling services
-
serving swarm mode HTTP API endpoints
⇒ A swarm with 3 managers will tolerates a maximum loss of 1 manager
⇒ Adding more managers does NOT mean increased scalability or higher performance. In general, the opposite is true.
Worker nodes are also instances of Docker Engine but their sole purpose is to execute containers. Worker nodes don’t participate in the Raft distributed state, make scheduling decisions, or serve the swarm mode HTTP API.
Configure manager nodes for fault tolerance
Based on docker documentation, it’s better to maintain an odd number of managers in the swarm to support manager node failure.
-
Smarm size : number of manager nodes in your HA setup
-
Majority : minimum number of manager nodes required for the stability of HA platform (quorum)
-
Fault tolerance: number of manager nodes you can lose and still have a stable setup
| Swarm Size | Majority | Fault Tolerance |
|---|---|---|
1 |
1 |
0 |
2 |
2 |
0 |
3 |
2 |
1 |
4 |
3 |
1 |
5 |
3 |
2 |
6 |
4 |
2 |
Roles of each container
Refer to the architecture overview to see the list of the containers and their roles.
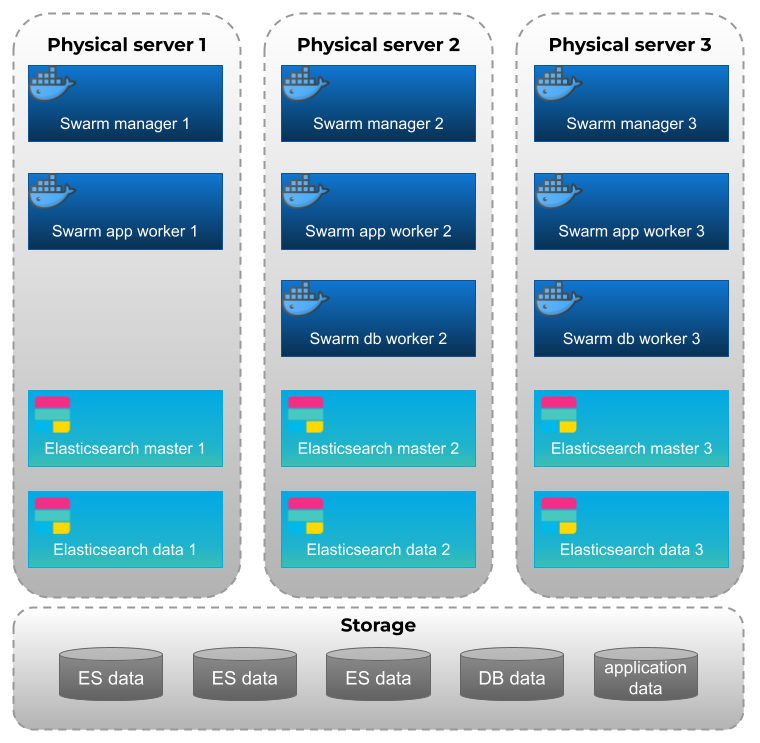
Prerequisites
MSactivator™ High Availability is based on Docker Engine Swarm mode, and requires:
Swarm nodes
To provide proper availability the swarm nodes (VM) should be distributed over 3 physical server
A minimum of 8 VMs deployed and distributed over the physical servers.
-
3 Docker Swarm manager
-
3 Docker Swarm worker for application containers
-
2 Docker Swarm worker for database containers (primary and replica)
Volumes
A shared mount point (from a NAS or Global File System):
Mount point on all VMs is /mnt/NASVolume. Those directories must be created manually to have HA platform working correctly
On Linux, you can use this bash command to create the directories
sudo mkdir -p /mnt/NASVolume/msa_db  \
/mnt/NASVolume/msa_es  \
/mnt/NASVolume/msa_entities  \
/mnt/NASVolume/msa_ai_ml_db  \
/mnt/NASVolume/msa_dev  \
/mnt/NASVolume/mano_db  \
/mnt/NASVolume/mano_vnfm  \
/mnt/NASVolume/mano_nfvo  \
/mnt/NASVolume/msa_dev  \
/mnt/NASVolume/msa_repository  \
/mnt/NASVolume/rrd_repository  \
/mnt/NASVolume/msa_svn  \
/mnt/NASVolume/msa_svn_ws  \
/mnt/NASVolume/msa_api_keystore \
/mnt/NASVolume/msa_api  \
/mnt/NASVolume/msa_sms_logs/snmp \
/mnt/NASVolume/msa_front_conf \
/mnt/NASVolume/kafka_data \
/mnt/NASVolume/mano_artemis \
/mnt/NASVolume/msa_api_logs
Set owner to the PostgreSQL service
sudo chown 70 /mnt/NASVolume/msa_db
sudo chown 70 /mnt/NASVolume/mano_db
Set owner the other services
sudo chown 1000.1000 /mnt/NASVolume/msa_dev \
/mnt/NASVolume/msa_es \
/mnt/NASVolume/msa_entities \
/mnt/NASVolume/msa_ai_ml_db \
/mnt/NASVolume/msa_repository \
/mnt/NASVolume/mano_db  \
/mnt/NASVolume/mano_vnfm  \
/mnt/NASVolume/mano_nfvo  \
/mnt/NASVolume/msa_api  \
/mnt/NASVolume/msa_svn_ws  \
/mnt/NASVolume/rrd_repository \
/mnt/NASVolume/msa_api_keystore \
/mnt/NASVolume/msa_svn \
/mnt/NASVolume/msa_front_conf \
/mnt/NASVolume/msa_api_logs
sudo chown -R 1001.0 /mnt/NASVolume/kafka_data
sudo chown -R 1001.1001 /mnt/NASVolume/mano_artemis
Networking
The IP addresses of the manager machine must be assigned to a network interface available to the host operating system. All nodes in the swarm need to connect to the manager at the IP address.
The other nodes contact the manager nodes on their IP addresses therefore you should use a fixed IP address.
Firewall
The following ports must be available on Manager node (see below configure the firewall on how to configure this on CentOS 7):
-
TCP port 2377 for cluster management communications
-
TCP and UDP port 7946 for communication among nodes
-
UDP port 4789 for overlay network traffic
| If you plan on creating an overlay network with encryption (--opt encrypted), you also need to ensure ip protocol 50 (ESP) traffic is allowed. |
More information about Docker Engine Swarm available here: swarm tutorial.
Elasticsearch nodes
To provide proper availability the elasticsearch nodes (VM) should be distributed over 3 physical server
A minimum of 6 VMs deployed and distributed over the physical servers.
-
3 Elasticsearch master nodes
-
3 Elasticsearch data nodes
Installing the application in HA mode
Enable Docker swarm mode
To enable swarm mode on the "Docker Swarm Manager" machine:
$ sudo docker swarm init --advertise-addr <SWARM MANAGER IP>Replace SWARM MANAGER IP with your Swarm Manager IP address.
Normal output contains "docker swarm join" command:
Swarm initialized: current node (efkok8n0eiy4f6xu48zaro3x8) is now a manager.

To add a worker to this swarm, run the following command:

    docker swarm join --token SWMTKN-1-4okdpjkrwzocwgqor1o9r5ck0xah646emhtgf9d3t4f4n11jgn-5a9ms5okxyxzjmcbz09pc9ujq <SWARM MANAGER IP>:2377

To add a manager to this swarm, run 'docker swarm join-token manager' and follow the instructions.
To enable swarm mode on Workers:
$ sudo docker swarm join --token SWMTKN-1-4okdpjkrwzocwgqor1o9r5ck0xah646emhtgf9d3t4f4n11jgn-5a9ms5okxyxzjmcbz09pc9ujq <SWARM MANAGER IP>:2377Normally you should see:
This node joined a swarm as a worker.| In case of any error like: Error response from daemon: rpc error: code = Unavailable desc = all SubConns are in TransientFailure, latest connection error: connection error: desc = "transport: Error while dialing dial tcp 10.31.1.172:2377: connect: no route to host" Check for Iptables rules on the manager node. |
To disable the swarm mode $ sudo docker swarm leave --force
|
Starting MSA from the "Docker Swarm Manager" machine
The quickstart project provides a sample docker compose file to help you getting started with MSactivator™ on Docker Swarm
-
$ sudo docker node lsto check if all nodes are connected and active. -
$ git clone https://github.com/ubiqube/quickstart.gitclone git repository. -
$ cd ./quickstart/to change directory. -
$ sudo docker stack deploy --with-registry-auth -c docker-compose.ha.yml msato run installation. -
Verify:
$ sudo docker stack services msa
ID                  NAME                MODE                REPLICAS            IMAGE
7c5x50tjvmmj        msa_msa_ui          replicated          1/1                 ubiqube/msa2-ui:45b85fa03ade5a070f8df3a08c3ab64e315e38c9
ac3mb7fhhivu        msa_camunda         replicated          1/1                 camunda/camunda-bpm-platform:latest
e0rxtyv10lzi        msa_msa_front       replicated          1/1                 ubiqube/msa2-front:0576df6db6445ac10dd5e4503c3867e216db4302
elx9q04c9jb8        msa_msa_linux       replicated          1/1                 efeubiqube/linuxe2e:latest
qmrw49j2ejto        msa_msa_api         replicated          3/3                 ubiqube/msa-api:642242a9cc03553cd31436635853bd739fff420e
s72z7aux2jox        msa_msa_bud         replicated          1/1                 ubiqube/msa2-bud:42951df0800592a00a651717ab4a13573562e63c
tz6qsmts59z4        msa_db              replicated          1/1                 ubiqube/msa2-db:a04c9cf8ac13fe28e2d02cc2a37d1552ee6bdb44
widazn0p3smq msa_msa_sms replicated 1/1 ubiqube/msa2-sms:3e32150a5202db71211d2bd453af883894c52513| on CentOS 7 you need to configure the firewall to allow Docker Swarm. |
OpenMSA library
To have predefined Device Adapters, Microservices and Workflows from https://github.com/openmsa, on the node where msa_dev is running, execute this command
docker exec $(docker ps -q -f name=msa_dev) /usr/bin/install_libraries.sh
Once done, restart msa_api and msa_sms services
docker service update --force devmsaha_msa_api
docker service update --force devmsaha_msa_sms
Fix swarm route
In order to fix routes on swarm, after installation, upgrades or restart:
$ ./scripts/swarm-fix-all-nodes.sh
Backup
How to backup the swarm environment:
In order to perform a backup please refer to backup the swarm which will give you the information you need.
Commands and tips
docker swarm init --advertise-addr 10.31.1.172
docker stack deploy --with-registry-auth -c docker-compose.simple.ha.yml ha
(Token retrieve after executing swarn init on the manager)
docker swarm join --token SWMTKN-1-5s84r5gaj2vh6t3duf1ed5vrh7paj6vacmdihtnmxzyzojvp75-aepejepsfgw8ffz38ajentpia 10.31.1.172:2377
(Token retrieve after executing swarm join-token manager on the manager)
docker swarm join --token SWMTKN-1-5s84r5gaj2vh6t3duf1ed5vrh7paj6vacmdihtnmxzyzojvp75-aepejepsfgw8ffz38ajentpia 10.31.1.172:2377
# docker node ls
ID                            HOSTNAME            STATUS              AVAILABILITY        MANAGER STATUS      ENGINE VERSION
1s9p18pjsl7og0xw5xw5yqpbh *   QA-UBI-HADKR-MAN1   Ready               Active              Leader              19.03.12
3v5r08jy7hvktdgl59bco75vl     QA-UBI-HADKR-MAN2   Ready               Active              Reachable           19.03.12
mmq5197bflac56ry8dpsl6hef     QA-UBI-HADKR-MAN3   Ready               Active              Reachable           19.03.12
# docker service ls
ID                  NAME                MODE                REPLICAS               IMAGE                                                            PORTS
qyse3efoadw6        ha_camunda          replicated          1/1 (max 1 per node)   camunda/camunda-bpm-platform:latest
vdjii0atvfmr        ha_db               replicated          1/1                    ubiqube/msa2-db:2b7c486764c882abe1a720094ec5159d3bd75389
whb2cd6aepnt        ha_msa_api          replicated          1/1 (max 1 per node)   ubiqube/msa-api:01c2449225961e288c0d0e47795193b97da28a8c
ikoxzkf15hdc        ha_msa_bud          replicated          1/1                    ubiqube/msa2-bud:26cf8835dadb548dd8c23edc8b7d671c1489d10b
prl9sferl4fm        ha_msa_cerebro      replicated          1/1 (max 1 per node)   lmenezes/cerebro:latest                                          *:9000->9000/tcp
nesi7prjk38a        ha_msa_dev          replicated          1/1                    ubiqube/msa2-linuxdev:f1da0641d2dc5af04d98559c7540cdbac7393a33
e008xt6hirr4        ha_msa_es           replicated          1/1 (max 1 per node)   ubiqube/msa2-es:037a2067826b36e646b45e5a148431346f62f3a6
bpipa8eiljjq        ha_msa_front        replicated          1/1 (max 1 per node)   ubiqube/msa2-front:d0285edfb9d59047b006da091a28b7ea7c1ead2e
q4286mbi47j6        ha_msa_linux        replicated          1/1                    efeubiqube/linuxe2e:latest
xi0m7pmk6pwn        ha_msa_sms          replicated          1/1 (max 1 per node)   ubiqube/msa2-sms:feefa4f1f72a0c28d8f01aaa455ec2f834becbed
a4te8kezivvu        ha_msa_ui           replicated          1/1 (max 1 per node)   ubiqube/msa2-ui:4ab34eda0af7540a3c19ccc657b0ec2e3fd3d57
docker swarm leave --force
# To scale msa_api to 3 instances
docker swarm scale ha_msa_api=3
Change the docker-compose file alter the "replicas" number and run docker stack deploy --with-registry-auth -c docker-compose.simple.ha.yml ha
Firewall configuration
Firewalld is the default firewall application on CentOS 7, but on a new CentOS 7 server, it is disabled out of the box. So let’s enable it and add the network ports necessary for Docker Swarm to function.
use yum install firewalld to Firewalld if it’s not installed yet.
|
Before starting, verify its status (use sudo if you don’t have root privileges):
systemctl status firewalld
Start firewalld:
systemctl start firewalld
Then enable it so that it starts on boot:
systemctl enable firewalld
On the node that will be a Swarm manager, use the following commands to open the necessary ports:
firewall-cmd --add-port=2376/tcp --permanent
firewall-cmd --add-port=2377/tcp --permanent
firewall-cmd --add-port=7946/tcp --permanent
firewall-cmd --add-port=7946/udp --permanent
firewall-cmd --add-port=4789/udp --permanent
Note: If you make a mistake and need to remove an entry, type: firewall-cmd --remove-port=port-number/tcp -permanent.
|
Afterwards, reload the firewall:
firewall-cmd --reload
Then restart Docker.
systemctl restart docker
Then on each node that will function as a Swarm worker, execute the following commands:
firewall-cmd --add-port=2376/tcp --permanent
firewall-cmd --add-port=7946/tcp --permanent
firewall-cmd --add-port=7946/udp --permanent
firewall-cmd --add-port=4789/udp --permanent
Afterwards, reload the firewall:
firewall-cmd --reload
Restart Docker.
systemctl restart docker
Ouside network access
If you’ll be testing applications on the cluster that require outside network access, be sure to open the necessary ports.
For example, if you’ll be testing a Web application that requires access on port 80, add a rule that grants access to that port using the following command on all the nodes (managers and workers) in the cluster:
firewall-cmd --add-port=80/tcp --permanent
Remember to reload the firewall when you make this change.
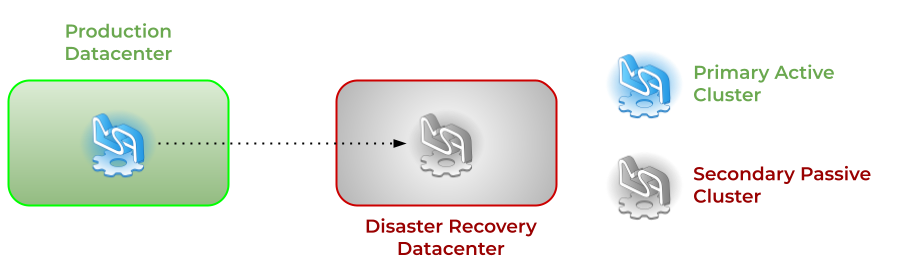
Cross-Cluster Replication (CCR)
The MSactivator™ provides support for cross-cluster replication.
Cross-Cluster replication can be used within a single site, typically on dedicated physical servers but the typical use case is about using CCR to replicate and secure the service continuity between 2 geographically separated site or datacenters.
Overview
Organizations today face several challenges that threaten business continuity. One such challenge is downtime. While disasters are inevitable, unplanned downtime disrupts normal business processes, reducing employee productivity with risks of increasing client dissatisfaction and financial loss.
To minimize downtime and sustain business operations, you must back up your organization’s critical data and ensure redundant IT infrastructure is implemented. Geo-redundancy and backups are a crucial part of any business continuity and disaster recovery plan to help businesses bounce back quickly from unplanned disruptions such as natural disasters, technical glitches or power outages.
What Is geo-redundancy?
Geo-redundancy is the distribution of mission-critical components or infrastructures, such as servers, across multiple clusters that reside in different geographic locations. Geo-redundancy acts as a safety net in case your primary site fails or in the event of a disaster or an outage that impacts an entire region.
Should a workload fail due to hardware, networking, power or some other issues, it can failover to one of the alternate locations with minimal impact to the service. That way, your business continues to function as normal (ultimately leading to improved end-user experience).
What Does Failover Mean?
Failover in computing is the ability to automatically switch over to a redundant or secondary site (a standby server, computer system) when the primary server, application, hardware component or network is unavailable. Failover helps eliminate the negative impact on end users that arises due to system failure.
A failover process initiated by IT administrators for scheduled maintenance or system upgrades is known as planned failover. When failover is triggered due to a failure or when critical applications, server or hardware stops functioning abnormally, it is considered an unplanned failover.
How does geo-redundancy work?
Geo-redundancy works by duplicating IT infrastructure, such as servers and network resources, and storing them as a backup in two clusters located in different regions, thus making the components simultaneously available.
By hosting IT infrastructure not only in a primary site but also in a secondary site, geo-redundant storage (GRS) helps improve your organization’s resiliency and provides better protection. GRS enables you to restore applications and data quickly by initiating failover to the secondary cluster during unplanned disruptions or in case your primary site fails.
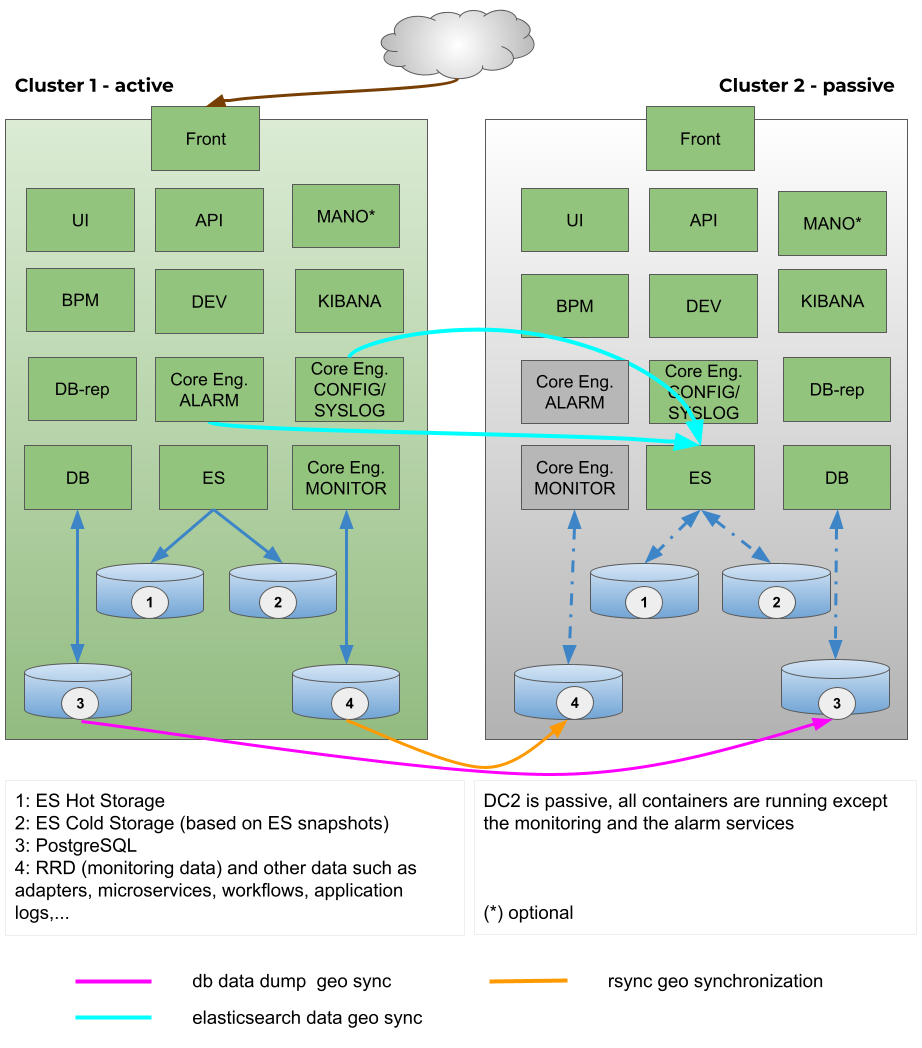
Switching cluster roles: failover and revert
Switching cluster roles is necessary for several reasons such as maintenance activity or technical issues on the primary cluster.
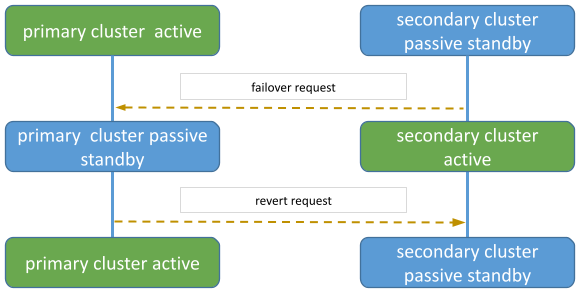
Cluster failover
This section provides the generic steps to execute the cluster failover operation in order to change DC2, the secondary passive cluster, to be the primary active cluster.
Steps for reverting to the initial state (DC1 primary active and DC2 secondary passive) are also documented.
Failover to the secondary cluster DC2 should be executed by running a script from one of the Swarm manager nodes in DC2.
The diagram below shows the steps and actions that are executed on both clusters during the failover activity.
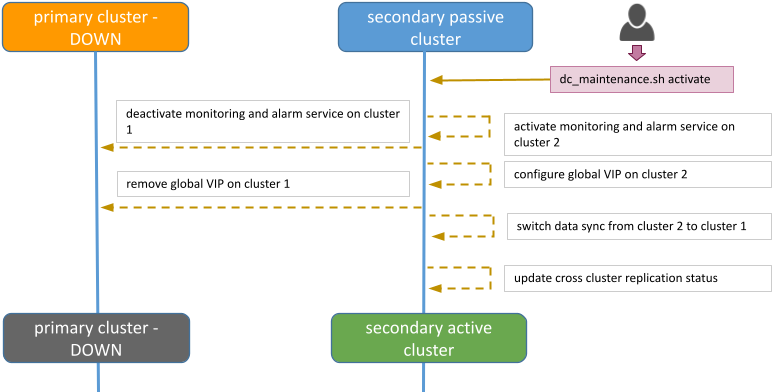
Execute the maintenance script
Assumptions
The connectivity between KVDC and BRF is working. If these assumptions are not met, the failover can still be executed but manual interventions on KVDC will have to be executed (cf below for details).
Connect to secondary passive DC2
Connect as root user to Swarm manager node 1 (SM01).
$ssh root@SM01
root@SSM01 ~ #
root@SSM01 ~ # cd /root/sas-replication/
root@SSM01 ~/sas-replication # ls -l
total 60
-rwxr-xr-x 1 root root  2354 Dec  3 06:38 backup_db.sh
-rw-r--r-- 1 root root   171 Dec  8 23:35 common.inc
-rw-r--r-- 1 root root  1612 Nov 29 22:41 common_lib.inc
drwxr-xr-x 2 root root  4096 Dec  8 20:00 cron.d
-rw-r--r-- 1 root root   164 Nov  3 16:46 dc_maintenance.inc
-rwxr-xr-x 1 root root 11668 Dec  8 20:00 dc_maintenance.sh
drwxr-xr-x 2 root root  4096 Dec  3 23:20 logs
lrwxrwxrwx 1 root root    11 Dec  8 20:00 msa_sync_db.sh -> msa_sync.sh
lrwxrwxrwx 1 root root    11 Dec  8 20:00 msa_sync_file.sh -> msa_sync.sh
-rwxr-xr-x 1 root root  4211 Dec  8 02:18 msa_sync.sh
-rwxr-xr-x 1 root root  2743 Nov 24 18:55 restore_db.sh
-rw-r--r-- 1 root root  7536 Dec  8 22:30 sas-replication_MY_DC.tar.gz
drwxr-xr-x 2 root root  4096 Dec  8 20:00 MY_DC
Execute the script dc_maintenance.sh
root@SM01:~/sas-replication# ./dc_maintenance.sh activate
[dc2] Sanity check
[dc2] Sanity check OK
[dc2] Starting services on dc2
Updating service msa_msa-cerebro (id: ra45zrqoff8g3d8p5i4f243yr)
Updating service msa_msa-monitoring (id: zobnrq658gtasrs60qzwbwfv1)
Updating service msa_msa-dev (id: ud3mz5a55x49sgp3kan8aj6ns)
Updating service msa_msa-es (id: 9qm9cyanqn78osk7e8ekhxhmu)
Updating service msa_msa-front (id: x4we14z18e6chr7k0ajg0pita)
Updating service msa_msa-sms (id: e240k1kzc5s1hm980gf7hfg3q)
Updating service msa_msa-alarm (id: psodwffmxl9nh2ltone1wlh95)
Updating service msa_msa-kibana (id: ha4fh8fbnvpteubaurp4zbwno)
Updating service msa_camunda (id: f1saqort094lj5eq9oy7i12kj)
Updating service msa_db (id: qpc1aed4yeitvv6qfkw860oxy)
Updating service msa_mano-nfvo-dc1 (id: qpnt6jsq5qko3x5lrwugagvmj)
Updating service msa_msa-bud (id: ukyzgde3ehvmmc783bn2rugrz)
Updating service msa_msa-api (id: tcyycu9g0axy5swwaq0jght8d)
Updating service msa_msa-rsyslog (id: v1my7owis0zqpo0414fstj44l)
Updating service msa_msa-ui (id: kd1mi01c2dn7kg6029h0c3uuv)
Updating service msa_db-replica (id: 7fb38i1kzhadch509e454m14h)
[dc2] Services on dc2 started
[dc2] Stopping services on dc1
[dc2] Stopping global VIP on dc1
[dc2] Starting global VIP on dc2
[dc2] Sanity check
[dc2] Sanity check OK
[dc2] Stopping services on dc1
[dc2] Services on dc1 stopped
[dc2] Get Data Center status
[dc2] Get Data Center status OK
[dc2]
{"dc2":"active","dc1":"passive"}
[dc1]
[dc1]
dc2:active
dc1:passive
Failover procedure is over, primary DC1 is passive and secondary DC2 is active
Datacenter revert
Datacenter revert allows the role of primary activate cluster to be reverted from DC2 to DC1.
This is done the same way from the failover procedure: by running a script from one of the Swarm manager nodes in DC1.
The diagram below shows the steps and actions that are executed on both clusters during the failover activity.
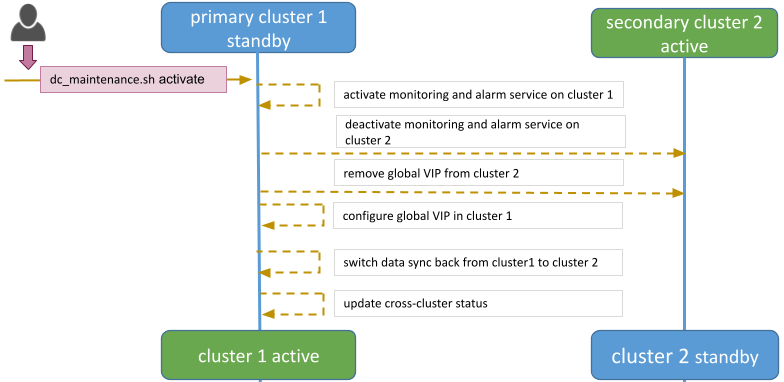
Execute the maintenance script
Assumptions
The connectivity between DC1 and DC2 is working.
The data synchronization from BRF to KVDC is working.
For that it is useful to check the log files in /var/log/sas-replication/*.log
Connect to primary passive DC1
Connect as root user to Swarm manager node 1 (SM01).
Go to directory /root/sas-replication
cd /root/sas-replication/
Execute the maintenance script
./dc_maintenance.sh activate
Revert procedure is over, primary DC1 is active and secondary DC2 is passive
Security Configuration
Before installing MSA there are some host configurations that are needed.
Standalone
Install and configure Audit
-
Mount
/var/lib/dockeras a separete partition -
Install audit
-
# yum install audit
-
-
Edit (or create if does not exist)
/etc/audit/rules.d/audit.rulesadd lines:
-w /usr/bin/dockerd -k docker
-w /usr/bin/docker -k docker
-w /var/lib/docker -k docker
-w /etc/docker -k docker
-w /usr/lib/systemd/system/docker.socket -k docker
-w /usr/lib/systemd/system/docker.service -k docker
-w /etc/docker/daemon.json -k docker
-w /etc/default/docker -k docker

# restart audit service
# service auditd restart| Auditing can generate large log files. You should ensure that these are rotated and archived periodically. A separate partition should also be created for audit logs to avoid filling up any other critical partition. |
Configure docker daemon
-
Edit (or create if does not exist) /etc/docker/daemon.json and add
{"icc": false, "userns-remap": "default", "log-driver": "syslog", "live-restore": true, "userland-proxy": false}Configure sysctl
-
Add "user.max_user_namespaces=15000" to /etc/sysctl.conf and reload (
# sysctl -p)
Reload services
-
# sysctl -p -
# systemctl restart docker
Swarm mode
Install and configure Audit
-
Mount
/var/lib/dockeras a separete partition -
Install audit
-
# yum install audit
-
-
Edit (or create if does not exist)
/etc/audit/rules.d/audit.rulesadd lines:
-w /usr/bin/dockerd -k docker
-w /usr/bin/docker -k docker
-w /var/lib/docker -k docker
-w /etc/docker -k docker
-w /usr/lib/systemd/system/docker.socket -k docker
-w /usr/lib/systemd/system/docker.service -k docker
-w /etc/docker/daemon.json -k docker
-w /etc/default/docker -k docker

# restart audit service
# service auditd restart| Auditing can generate large log files. You should ensure that these are rotated and archived periodically. A separate partition should also be created for audit logs to avoid filling up any other critical partition. |
Configure docker daemon
-
Edit (or create if does not exist) /etc/docker/daemon.json and add
{"icc": false, "userns-remap": "default", "log-driver": "syslog", "userland-proxy": false}Configure sysctl
-
Add "user.max_user_namespaces=15000" to /etc/sysctl.conf and reload (
# sysctl -p)
Reload services
-
# sysctl -p -
# systemctl restart docker
Swarm manager should run in auto-lock mode
-
When creating a swarm run:
# docker swarm init --autolock -
if swarm already exist:
# docker swarm update --autolock
Encrypted overlay network
-
Before starting swarm:
# docker network rm ingress
    WARNING! Before removing the routing-mesh network, make sure all the nodes in your swarm run the same docker engine version. Otherwise, removal may not be effective and functionality of newly create ingress networks will be impaired.
    Are you sure you want to continue? [y/N] y
    ingress

# docker network create --ingress --driver overlay --opt encrypted ingress
Support and Troubleshooting Guide
Support
How to install a custom SSL certificate
The container msa_front is installed with a default self-signed certificate to allow SSL when connecting to https://localhost. While this is fine for most of the lab trials, you may want to install your own certificate to ensure a certified connection to your setup.
Prerequisites
To install your certificate you need to have the certificate file (server.crt) and the associated private key (server.key)
Installation
Update the docker-compose file
In order to persist the certificate during the container image update you first need to update the docker-compose file.
Edit the file docker-compose.yml and add msa_front in the volumes section and update the service msa_front with
    volumes:
        - "msa_front:/etc/nginx/ssl"
Restart your setup with docker-compose up -d
If you are running a docker swarm then you’ll only have to update the service msa_front with
    volumes:
        - "/mnt/NASVolume/msa_front:/etc/nginx/ssl"
you need to create the director /mnt/NASVolume/msa_front manually first
|
Install the certificate
-
copy the two files server.crt and server.key on your docker host
-
copy the 2 files in the front container:
docker cp server.key server.crt $(docker ps | grep msa_front | awk '{print $1}'):/etc/nginx/ssl/ -
force recreate front to refresh certificates container:
docker service update --force FRONT_SERVICE_NAME -
browse to https://localhost (you may have to clean your cache)
How to support TFTP for managed entity operations
If a managed entity use TFTP protocol during backend operation, like a restore, an MSA variable must be set with the IP of the MSactivator™. Then msa_sms container must be restarted
POST https://localhost/ubi-api-rest/system-admin/v1/msa_vars
[
{ "name": "UBI_SYS_EQUIPMENTS_IP", "comment": "", "value": "<MSA_IP>" }
]
docker-compose restart msa_sms (standalone)
docker service update --force ha_msa_sms (HA)
Troubleshooting
Containers / Docker Engine
Install the MSactivator™ behind a proxy
Often the MSactivator™ has to be installed on a host that sits behind a proxy. This requires some specific configuration on the host, on docker and also on the MSactivator™ containers themselves:
Proxy setting on the host OS where the proxy needs to be specified and used. This is needed to download all the necessary docker packages as well as docker-compose on the machine. Those settings are different depending on the OS that might be used.
Once installed, docker does not inherit the proxy settings from the host machine. Proxy settings need to be specified in dockers configuration file to download the necessary MSactivator™ images.
However, along with that, the "no proxy" option should be specified for the internal container to containers communication. Falling to do so will result in all the traffic routed the proxy.
The easiest way to do that is to edit the file docker-compose.yml and add the following to the service msa_dev:
environment:
    http_proxy: "<PROXY URL>"
    https_proxy: "<PROXY URL>"
    no_proxy: "localhost,127.0.0.1,linux_me_2,linux_me,msa_cerebro,camunda,msa_alarm,db,msa_sms,quickstart_msa_ai_ml_1,msa_ui,msa_dev,msa_bud,msa_kibana,msa_es,msa_front,msa_api"
If your proxy also rewrites the SSL certificates you will face errors such as fatal: unable to access 'https://github.com/openmsa/Workflows.git/': Peer’s Certificate issuer is not recognized. when installing the MSactivator™.
To solve this you also need to add the following to the msa_dev environment.
GIT_SSL_NO_VERIFY: "true"
How do I check that the Docker containers are deployed ?
On a Linux system from the directory where you ran the docker-compose up -d command (working directory), run docker-compose images.
$ docker-compose images
       Container                    Repository                              Tag                        Image Id       Size
----------------------------------------------------------------------------------------------------------------------------
quickstart_camunda_1       camunda/camunda-bpm-platform   7.13.0                                     9c773d0a9146   257.7 MB
quickstart_db_1            ubiqube/msa2-db                c1aa0013c4d8b8c39682034a23d395be8e4d8547   48151f3aa621   158.2 MB
quickstart_linux_me_1      quickstart_linux_me            latest                                     3d0eb1ca1738   533.1 MB
quickstart_msa_api_1       ubiqube/msa2-api               6068794aa30160fb5696bb5c96253a4b1fb3536b   4f1ff5300692   1.179 GB
quickstart_msa_bud_1       ubiqube/msa2-bud               43ee454c22b9ed217dac6baba9a88a345a5422c2   d0b6a867c236   725.9 MB
quickstart_msa_cerebro_1   lmenezes/cerebro               0.9.2                                      cd2e90f84636   268.2 MB
quickstart_msa_dev_1       quickstart_msa_dev             latest                                     704b5286200a   521.2 MB
quickstart_msa_es_1        ubiqube/msa2-es                037a2067826b36e646b45e5a148431346f62f3a6   f99566a82028   862.6 MB
quickstart_msa_front_1     ubiqube/msa2-front             03f833a9c34c8740256162dee5cc0ccd39e6d4ef   0557476a3f74   28.91 MB
quickstart_msa_sms_1       ubiqube/msa2-sms               0107cbf1ac1f1d2067c69a76b107e93f9de9cbd7   e263e741f926   759.5 MB
quickstart_msa_ui_1 ubiqube/msa2-ui 47731007fb487aac69d15678c87c8156903d9f51 0f370eab1fe6 40.66 MB-
msa_front: runs NGINX web server
-
msa_api: runs the API
-
msa_sms: runs the CoreEngine daemons
-
msa_ui: runs the UI
-
db: runs the PostgreSQL database
-
camunda: runs the BPM
-
es: runs the Elasticsearch server
-
bud: runs the batchupdated daemon
Verify that all the containers are up.
This will also show you the network port mapping.
$ docker-compose ps
          Name                        Command               State                               Ports
----------------------------------------------------------------------------------------------------------------------------------
quickstart_camunda_1       /sbin/tini -- ./camunda.sh       Up      8000/tcp, 8080/tcp, 9404/tcp
quickstart_db_1            docker-entrypoint.sh postg ...   Up      5432/tcp
quickstart_linux_me_1      /sbin/init                       Up      0.0.0.0:2224->22/tcp
quickstart_msa_api_1       /opt/jboss/wildfly/bin/sta ...   Up      8080/tcp
quickstart_msa_bud_1       /docker-entrypoint.sh            Up
quickstart_msa_cerebro_1   /opt/cerebro/bin/cerebro - ...   Up      0.0.0.0:9000->9000/tcp
quickstart_msa_dev_1       /sbin/init                       Up
quickstart_msa_es_1        /usr/local/bin/docker-entr ...   Up      9200/tcp, 9300/tcp
quickstart_msa_front_1     /docker-entrypoint.sh ngin ...   Up      0.0.0.0:443->443/tcp, 0.0.0.0:514->514/udp, 0.0.0.0:80->80/tcp
quickstart_msa_sms_1       /docker-entrypoint.sh            Up      0.0.0.0:69->69/tcp
quickstart_msa_ui_1        /docker-entrypoint.sh ./st ...   Up      80/tcp
User Interface
I can’t login to the user interface (UI)
Here are a set of useful CLI commands that you can run from the working directory…
Check the status of the database:
$ sudo docker-compose exec db pg_isready
/var/run/postgresql:5432 - accepting connections
Monitor the logs of the API server. Run the cmd below and try to login. Report any error from the logs:
docker-compose exec msa-api tail -F /opt/jboss/wildfly/standalone/log/server.logIf the API server is not responding or if you can’t login after a few minutes, run the command below to restart the API server and monitor the logs:
$ docker-compose restart msa_api
Restarting quickstart_msa_api_1 ... done
Then monitor the logs as explained above.
Wildfly startup failure fatal KILL command
If Wildfly fails to start with an error similar to fatal KILL command then you probably haven’t allocated enough memory to your docker engine
The above steps should resolve common reasons why the MSactivator™ is not functioning properly. If there is something that is still not working properly, then please contact UBiqube.
CoreEngine
CoreEngine nor starting or restart fails
If the CoreEngine doesn’t (re)start properly, for instance when running
docker-compose exec msa-sms restart
you can check the CoreEngine configuration logs:
docker-compose exec msa-sms cat /opt/sms/logs/configure.log
How do I enable debug logs on the CoreEngine ?
The CoreEngine logs are available on the msa_sms container in the directory /opt/sms/logs.
If you are designing a Microservice or simply operating the MSactivator™, you might need to monitor the logs of the configuration engine.
Run the CLI command below to tail the logs
$ sudo docker-compose exec msa-sms tail -F /opt/sms/logs/smsd.logBy default, DEBUG logs are not enabled.
To enable the DEBUG mode, you need to connect to the container 'api' and execute the CLI command tstsms SETLOGLEVEL 255 255
$ sudo docker-compose exec msa-sms bash
[root@msa /]# tstsms SETLOGLEVEL 255 255
OK
[root@msa /]#
This will activate the DEBUG mode until the service is restarted.
Execute tstsms SETLOGLEVEL 255 0 to revert to the default log level.
| this will only enable DEBUG mode for the configuration engine (smsd.log) |
How do I permanently enable debug logs on the CoreEngine modules
The CoreEngine is in charge of configuration but also monitoring, syslog collecting, syslog parsing, alerting,…
The debug mode can also be enabled permanently for the various modules of the CoreEngine.
To enable the CoreEngine logs to debug mode, you need to set the global setting UBI_VSOC_DEBUG_LEVEL to 15 (default value is 0)
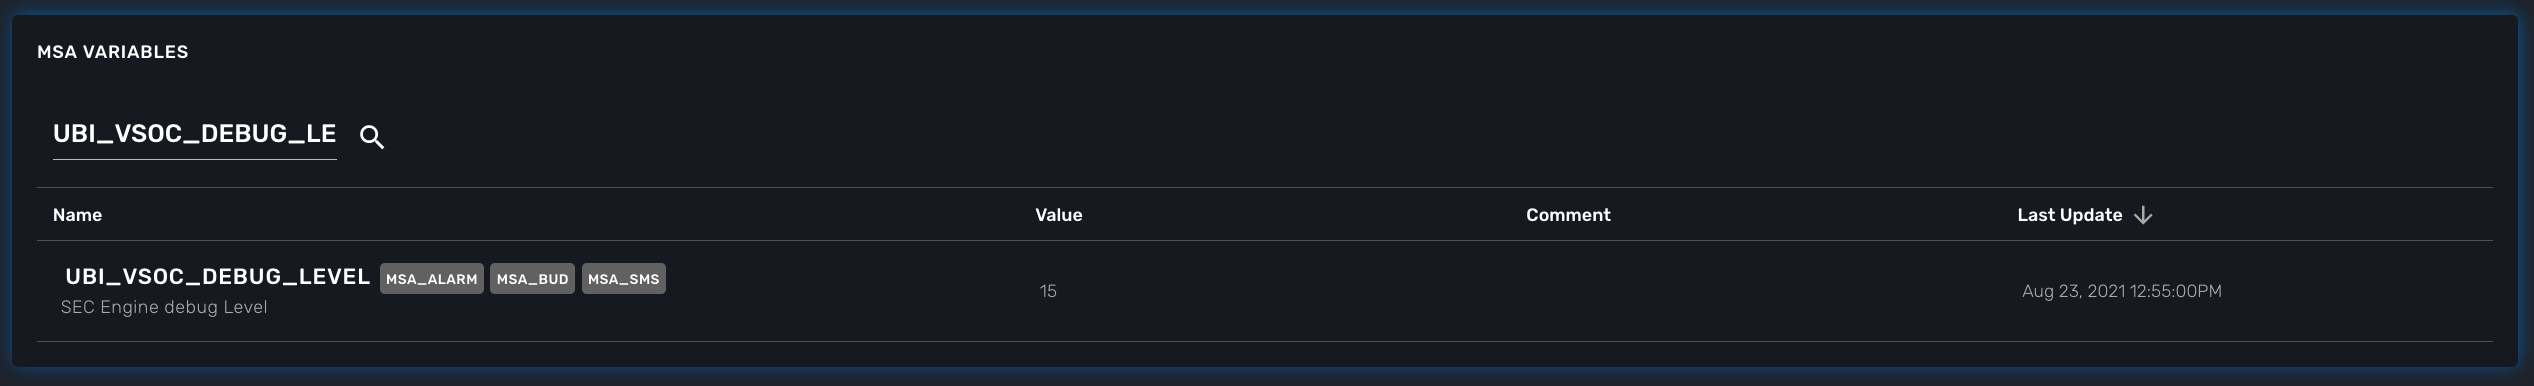
Restart the containers by using the action needed to reflect this setting.
docker container restart $(docker ps -q -f name=msa_alarm); $(docker ps -q -f name=msa_bud); $(docker ps -q -f name=msa_sms)
Monitor the configuration logs
docker-compose exec msa-sms tail -F /opt/sms/logs/smsd.logMonitor the SNMP monitoring logs
docker-compose exec msa-sms tail -F /opt/sms/logs/sms_polld.logMonitor the syslog parser logs
docker-compose exec msa-sms tail -F /opt/sms/logs/sms_parserd.logMonitor the syslog collecting logs
docker-compose exec msa-sms tail -F /opt/sms/logs/sms_syslogd.log| for monitoring, syslogs, parser, enabling the DEBUG logs may result in a huge volumes of logs so you need to use this carefully. To revert the configuration use the CLI cmd above with 1 instead of 15. |
Monitor the alarm logs
The Alarm module logs are available on the msa_alarm container in the directory /opt/alarm/logs.
docker-compose exec msa-alarm tail -F /opt/alarm/logs/sms_alarmd.logLDAP
This document describes the LDAP Integration in MSactivator™.
Overview
-
When LDAP is enabled, user creation in MSactivator™ is disabled.
-
When provided credentials authenticated successfully by LDAP server, and there is no corresponding user in MSactivator™, it will be created automatically at the time of login. For creating the user all the necessary LDAP attribute provided in the configuration should be available and should have valid values, if it is not the case, the user creation will fail, login will not be successful.
-
When creating admin, LDAP attribute provided for UBI_LDAP_ATTRIBUTE_MSA_TENANT value can have one or more tenant prefix separated by comma. When creating Manager, this attribute should have only one tenant. This attribute should be co-related with attribute for UBI_LDAP_ATTRIBUTE_MSA_ROLE.
-
It is recommended to delete all the existing internal users if exist, when enabling LDAP, because as there will be chances of username duplication. which will create some discrepancies
-
ncroot - super admin login authentication will always be a internal MSactivator™ DB Authentication.
Settings
LDAP Authentication is enabled in MSactivator™ by configuring MSactivator™ variables.
Description of how each variable can be obtained:
GET https://localhost/ubi-api-rest/system-admin/v1/product_name}_vars_definition

   {
        "name": "UBI_LDAP_ADMIN_DN",
        "type": "String",
        "regex": ".*|^$",
        "mandatory": false,
        "defaultValue": "",
        "group": "jentreprise,authentication",
        "description": "ldap admin domain name",
        "help": ""
    },
    {
        "name": "UBI_LDAP_ADMIN_PASSWORD",
        "type": "String",
        "regex": ".*|^$",
        "mandatory": false,
        "defaultValue": "",
        "group": "jentreprise,authentication",
        "description": "ldap admin password",
        "help": ""
    },
    {
        "name": "UBI_LDAP_ATTRIBUTE_MSA_PERMISSION",
        "type": "String",
        "regex": ".*|^$",
        "mandatory": false,
        "defaultValue": "",
        "group": "jentreprise,authentication",
        "description": "ldap attribute name for {product_name} permission",
        "help": "this attribute value in ldap should be id which represents permission profile Id of {product_name}, based on this value, the particular permission profile will be attached to created restricted manager, this value will be ignored when creating privilege manager"
    },
    {
        "name": "UBI_LDAP_ATTRIBUTE_MSA_ROLE",
        "type": "String",
        "regex": ".*|^$",
        "mandatory": false,
        "defaultValue": "",
        "group": "jentreprise,authentication",
        "description": "ldap attribute name for {product_name} role",
        "help": "this attribute value in ldap should be 3 or 4, based on this attribute value privilege manager or manager will be created in MSA"
    },
    {
        "name": "UBI_LDAP_ATTRIBUTE_MSA_SUB_TENANTS",
        "type": "String",
        "regex": ".*|^$",
        "mandatory": false,
        "defaultValue": "",
        "group": "jentreprise,authentication",
        "description": "ldap attribute name for {product_name} sub tenants",
        "help": "this attribute value in ldap should be \",\" separated id which represents sub tenant ids of {product_name}. based on this value, these list of subtenant will be attached to created restricted manager, this value will be ignored when creating privilege manager"
    },
    {
        "name": "UBI_LDAP_ATTRIBUTE_MSA_TENANT",
        "type": "String",
        "regex": ".*|^$",
        "mandatory": false,
        "defaultValue": "",
        "group": "jentreprise,authentication",
        "description": "ldap attribute name for {product_name} tenant",
        "help": "based on this attribute value in ldap, managers will be created under that tenant"
    },
    {
        "name": "UBI_LDAP_ATTRIBUTE_USER_NAME",
        "type": "String",
        "regex": ".*|^$",
        "mandatory": false,
        "defaultValue": "",
        "group": "jentreprise,authentication",
        "description": "ldap attribute for user name",
        "help": "this attribute value in ldap will used as a manager name in the manager creation"
    },
    {
        "name": "UBI_LDAP_ATTRIBUTE_USER_SEARCH",
        "type": "String",
        "regex": ".*|^$",
        "mandatory": false,
        "defaultValue": "",
        "group": "jentreprise,authentication",
        "description": "ldap unique attribute name for user search",
        "help": "this attribute will be used for user search in ldap"
    },
    {
        "name": "UBI_LDAP_ENABLE",
        "type": "Integer",
        "regex": "^[0-1]{1}$",
        "mandatory": false,
        "defaultValue": "0",
        "group": "jentreprise,authentication",
        "description": "enable or disable ldap authentication",
        "help": "value should be either 0 or 1 for disable or enable, ldap is disabled by default"
    },
    {
        "name": "UBI_LDAP_SERVER",
        "type": "String",
        "regex": ".*|^$",
        "mandatory": false,
        "defaultValue": "",
        "group": "jentreprise,authentication",
        "description": "ldap server ip or hostname",
        "help": ""
    },
    {
        "name": "UBI_LDAP_USER_OU",
        "type": "String",
        "regex": ".*|^$",
        "mandatory": false,
        "defaultValue": "",
        "group": "jentreprise,authentication",
        "description": "ldap organisation-unit name for users",
        "help": ""
    }
Value of each vars that can be set by below api:
POST https://localhost/ubi-api-rest/system-admin/v1/msa_vars

[
  {
    "name": "UBI_LDAP_ENABLE",
    "comment": "enable ldap authentication",
    "value": "1"
  },
  {
    "name": "UBI_LDAP_SERVER",
    "comment": "enable ldap authentication",
    "value": "ldap-host"
  },
  {
    "name": "UBI_LDAP_ADMIN_DN",
    "comment": "enable ldap authentication",
    "value": "cn=admin,dc=example,dc=org"
  },
  {
    "name": "UBI_LDAP_ADMIN_PASSWORD",
    "comment": "enable ldap authentication",
    "value": "admin"
  },
  {
    "name": "UBI_LDAP_USER_OU",
    "comment": "enable ldap authentication",
    "value": "ou=Users,dc=example,dc=org"
  },
  {
    "name": "UBI_LDAP_ATTRIBUTE_USER_SEARCH",
    "comment": "enable ldap authentication",
    "value": "cn"
  },
  {
    "name": "UBI_LDAP_ATTRIBUTE_USER_NAME",
    "comment": "enable ldap authentication",
    "value": "uid"
  },
  {
    "name": "UBI_LDAP_ATTRIBUTE_MSA_ROLE",
    "comment": "enable ldap authentication",
    "value": "employeeType"
  },
  {
    "name": "UBI_LDAP_ATTRIBUTE_MSA_TENANT",
    "comment": "enable ldap authentication",
    "value": "title"
  },
  {
    "name": "UBI_LDAP_ATTRIBUTE_MSA_SUB_TENANTS",
    "comment": "enable ldap authentication",
    "value": "initials"
  },
  {
    "name": "UBI_LDAP_ATTRIBUTE_MSA_PERMISSION",
    "comment": "enable ldap authentication",
    "value": "departmentNumber"
  }
]
LDAP Custom Attributes Checking on Authentication
List of custom LDAP user Attributes can be checked while authenticating the user, based on the user attributes and its values, LDAP authentication will decided
you can set the custom attributes in the below MSA Var, example attributes and values format should be like below
POST https://localhost/ubi-api-rest/system-admin/v1/msa_vars
 [
    {
        "name": "UBI_LDAP_AUTHENTICATION_CUSTOM_ATTRIBUTES",
        "value": "loginDisable:FALSE;memberOf:cn=developers,ou=group,o=data;ppIsSuspended:FALSE",
        "comment": ""
    }
]
In the above example LDAP authentication for the user will be successful only if the above attributes and values are matched.
LDAP-S
This document describes the procedure to follow in MSactivator™ to have secure ldap communication with LDAP server.
Changes to do on Client Side(API Container)
1) Update these variables in the MSactivator™ configuration
POST https://localhost/ubi-api-rest/system-admin/v1/msa_vars

[
  {
    "name": "UBI_LDAP_ENABLE",
    "comment": "enable ldap authentication",
    "value": "1"
  },
  {
    "name": "UBI_LDAPS_ENABLE",
    "comment": "enable ldap authentication",
    "value": "1"
  },
  {
    "name": "UBI_LDAP_SERVER",
    "comment": "enable ldap authentication",
    "value": "ldap.ubiqube.com"
  }
]
Note : UBI_LDAP_SERVER should be the fqdn used to generate the server certificate
2) Copy the CA certificate from ldap server to /etc/pki/jentreprise/ directory in api container
3) Import the CA certificate to jvm keystore
keytool -importcert -alias startssl -keystore /etc/pki/jentreprise/cacerts -storepass XXXXXX -storetype pkcs12 -noprompt -file /etc/pki/jentreprise/ca.cert.pem
4) Update /etc/hosts file in API container
update with
ldap_ip ldap.ubiqube.com
in order to avoid loosing the host entry on every restart or upgrade of the image, we can add this below extra_host in docker compose that add the entry in hosts file.
extra_hosts:
    - "ldap.ubiqube.com:172.18.0.5"
5) Restart the API Container
sudo docker-compose restart msa_api
Elasticsearch and Kibana
Overview
The MSactivator™ uses Elasticsearch and Kibana to provide data indexing and searching as well as the dashboards that can be customized and exposed with a custom manager dashboard.
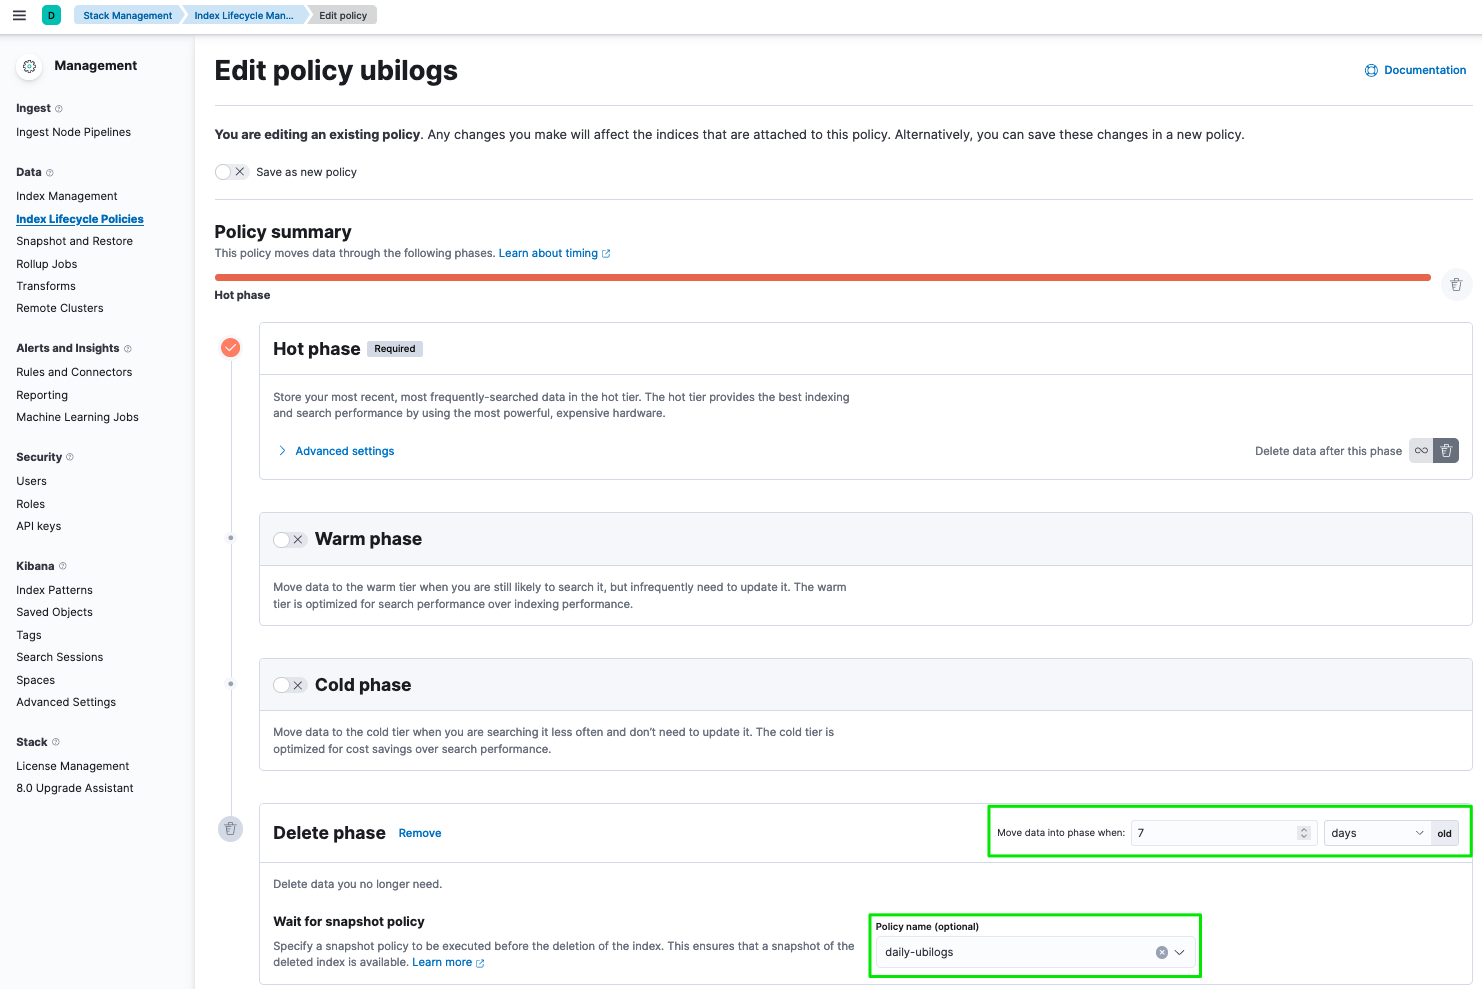
Data Retention Policy
Data retention policy allows to configure and manage the lifecycle of the indexes in Elasticsearch.
There are 3 main types of indexes such as the ones used for the syslogs (ubilogs-*), the alarms (ubialarms-*) or the audit logs (ubiaudit-*).
For each type, the data is stored in a daily index.
A new index is created every days.
A log retention policy can be configured for each type and a specific policy may be assigned for each index.
For example, you may want to keep the syslogs indexed and online (searchable with the MSactivator™ UI) for 3 months, but the alarms should be kept for a longer period of time like 1 year.
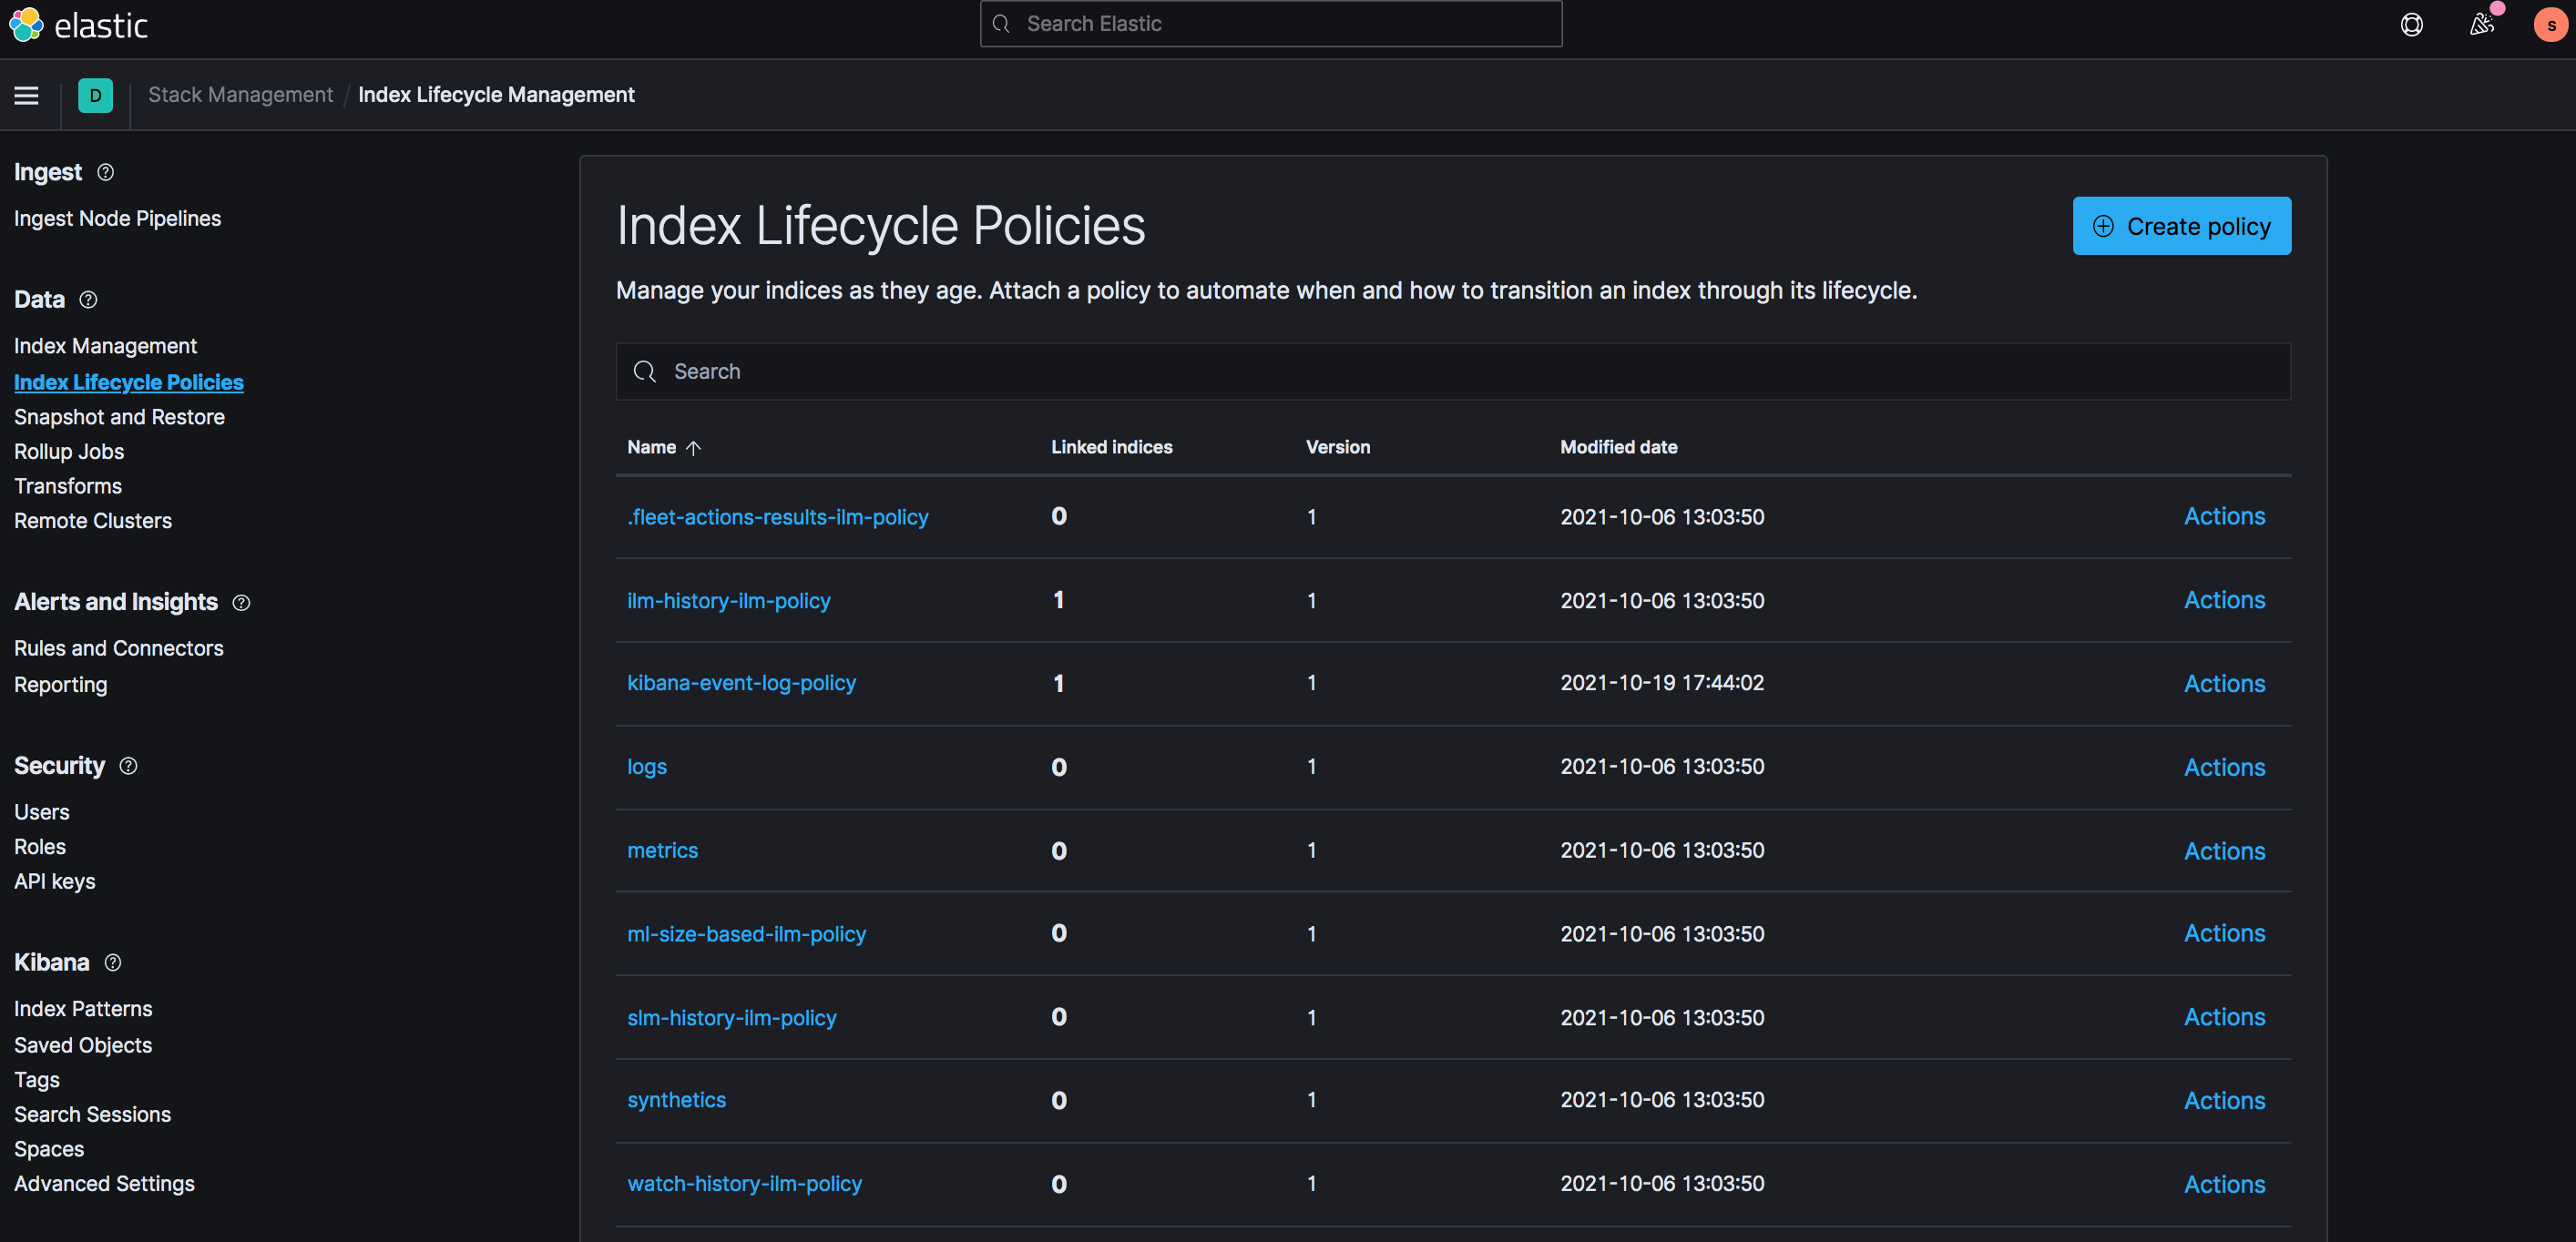
You can learn how to configure the retention policies by reading the Elasticsearch ILM documentation.
The ILM configuration is done with the Kibana UI (http://localhost/kibana), in the Stack Management section, under Index Lifecycle Policies
Online and offline storage
Elasticsearch ILM
Offline storage is for historical logs. For example, with a 1 year retention period, the storage is split between 1 month online and 11 months offline.
Online storage will be available for the logs that are less than 1 months old. The online storage is leveraging Elasticsearch data nodes to allow searching, alarm and dashboard.
Offline storage will be available for the logs that are within the time range between 1 months and 1 year.
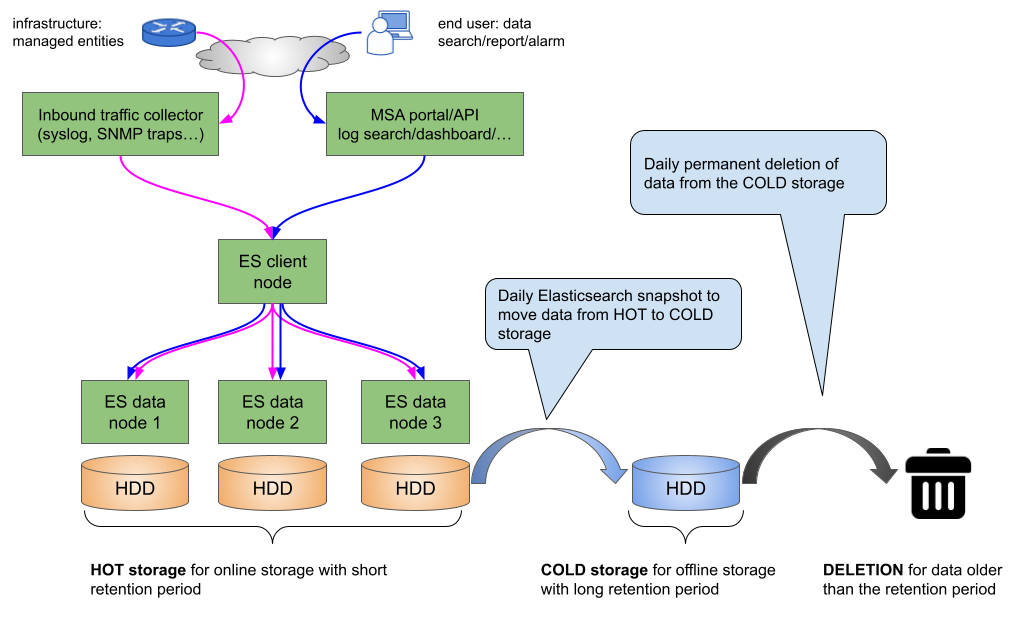
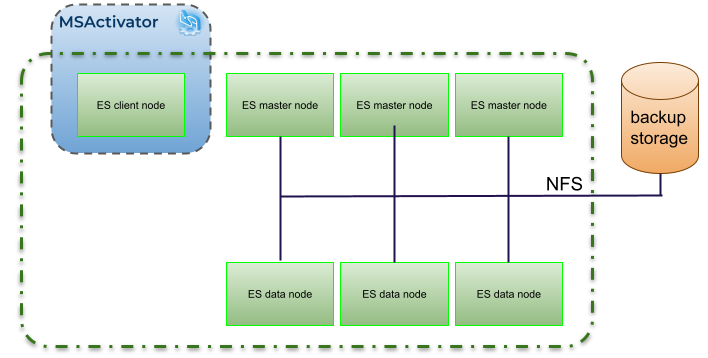
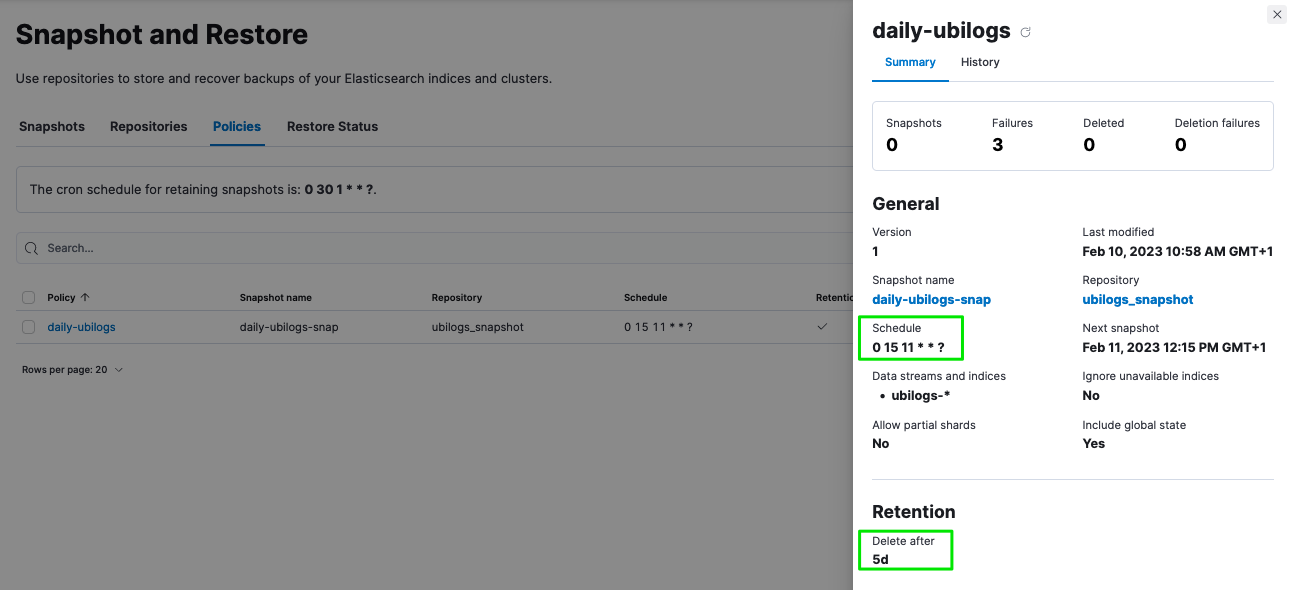
Snapshot policies require a snapshot repository.
A shared file system repository can be used to store snapshots on a shared file system using NFS.
The NFS mount should be shared between the snapshot storage and all the Elasticsearch master and data nodes. It is not required for the client nodes.
Snapshot and ILM policies can work together to manage online, offline and deletion of the data.
Advanced log retention control
With Elasticsearch built-in ILM, you can provide a high level control over the data retention period and manage but sometime log retention policy require a more advanced policy based on criteria such as the type of log.
As simple use case we can consider the collection of firewall logs. Firewalls are very "chatty" when it comes to sending data. Logs such as system, traffic, security or SNMP traps can be collected by the MSactivator™. In order to reduce the storage size, keeping system and traffic data for a short period of time can be acceptable will keeping the security event for a longer period of time may be required for legal reason.
The MSactivator™ advanced data retention feature allows the configuration of multiple rules to control the criteria for deleting data.
This feature is maintained by the msa2-es-ilm container included in the Quickstart
The retention policy is controlled by the environment variables below
UBI_ES_INDEX_MULTIPLE_TTL:         "*|90d"
UBI_ES_AUDIT_INDEX_MULTIPLE_TTL:   "*|90d"
UBI_ES_ALARM_INDEX_MULTIPLE_TTL:   "*|90d"
Variable value is a comma separated list of key|value. The key is an Elasticsearch query for filtering the data to delete, the value represent the retention period. By default logs, alarms and audit logs are deleted after 90d stored online in Elasticsearch cluster.
The configuration below will:
-
keep the traffic logs for 7 days
-
the event logs for 30d
-
delete everything older that 90 days
UBI_ES_INDEX_MULTIPLE_TTL: "type:traffic|7d,type:event|30d,*|90d
the name of the field (ex traffic) can be adjusted based on the data structure as stored in Elasticsearch
Below is another configuration that will:
-
delete the alarm with a low severity (debug, informational, notice, warning) after 7 days
-
delete the alarm with medium severity (error) after 30 days
-
delete everything older that 90 days
UBI_ES_ALARM_INDEX_MULTIPLE_TTL: "severity:[4 TO 7]|7d,severity:3|30d,*|90d"
Open source technologies used in MSactivator™
You can download the Open Source Technologies report here.