|
|
|
The Installation and Configuration Guide will show you how to install, configure and activate the MSactivator™.
If you want to get started quickly, you can check the quickstart guide.
Key Concepts
Overview
MSactivator™ is the leading Integrated Automation Platform (IAP) engineered by UBiqube for the continuous design of any IT infrastructure automation process. It is composed of Infrastructure and Automation Modules.
The Integration Module is used by infrastructure engineers to onboard / integrate the wide spectrum of related vendors and systems involved in any given IT solution, i.e. cloud technologies (public/private, containers, etc.), networks systems (virtual and physical, optical, 5G, etc.), security systems, IoT systems and devices, etc..
The Automation Module provides the IT automation developer with a unified development environment for process design without concern for the underlying infrastructure technologies / vendors used, enabling an evergreen design.
Understanding the Different Persona
On the MSactivator™ login screen, there are two different types of logins selectable via a toggle switch Manager/Developer
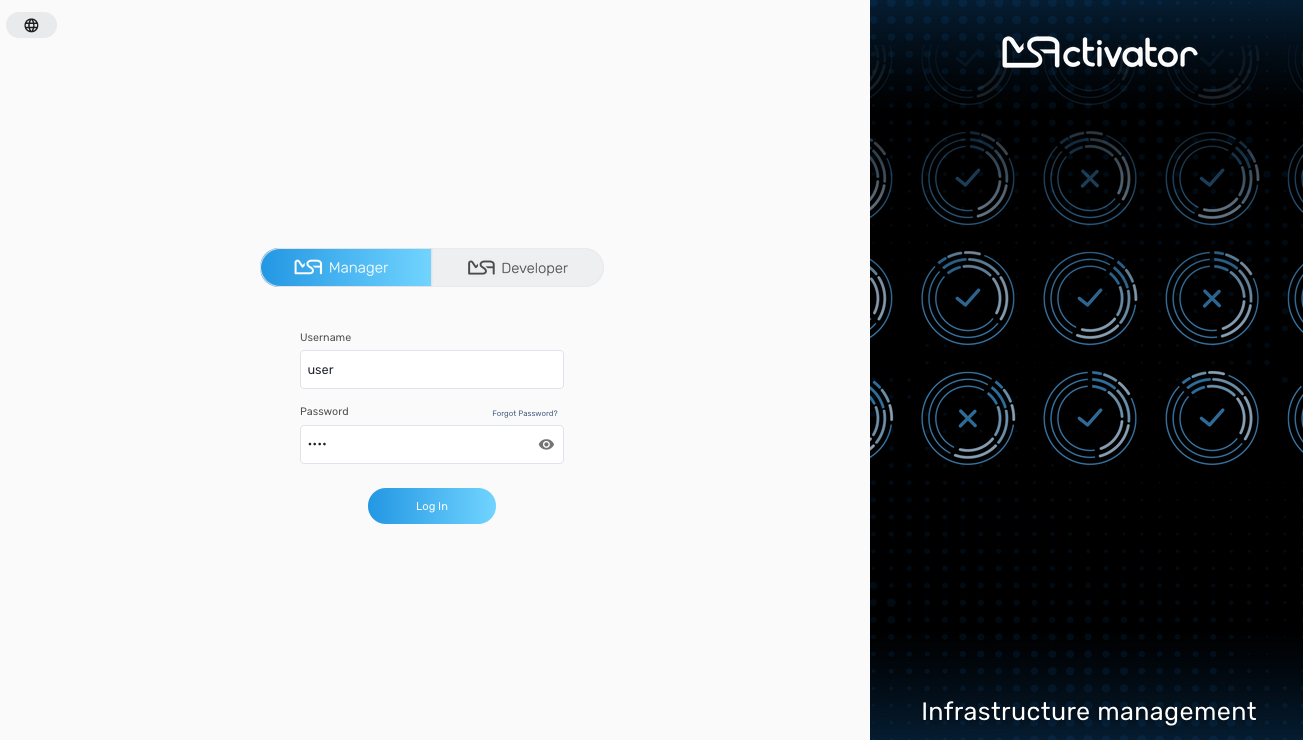
Manager
This will give you access to the manager dashboard, that allows you to monitor and manage the entities configured in your MSactivator™ installation.
This dashboard represents the "Ops" part of the "DevOps" approach, see the GUI Overview for more details.
Login as an manager, you can directly start monitoring and managing your system.
Developer
Access to the developer dashboard, to design business processes, write workflows, or use visual workflows and develop microservices in the MSactivator™.
Configure your remote Git repositories to do code versioning management, share you code with your team, publish your code and contribute to the community.
This dashboard represents the "Dev" part of the "DevOps" approach, see the GUI Overview for more details.
Login as a developer, you can easily access and work on the design of your automation processes.
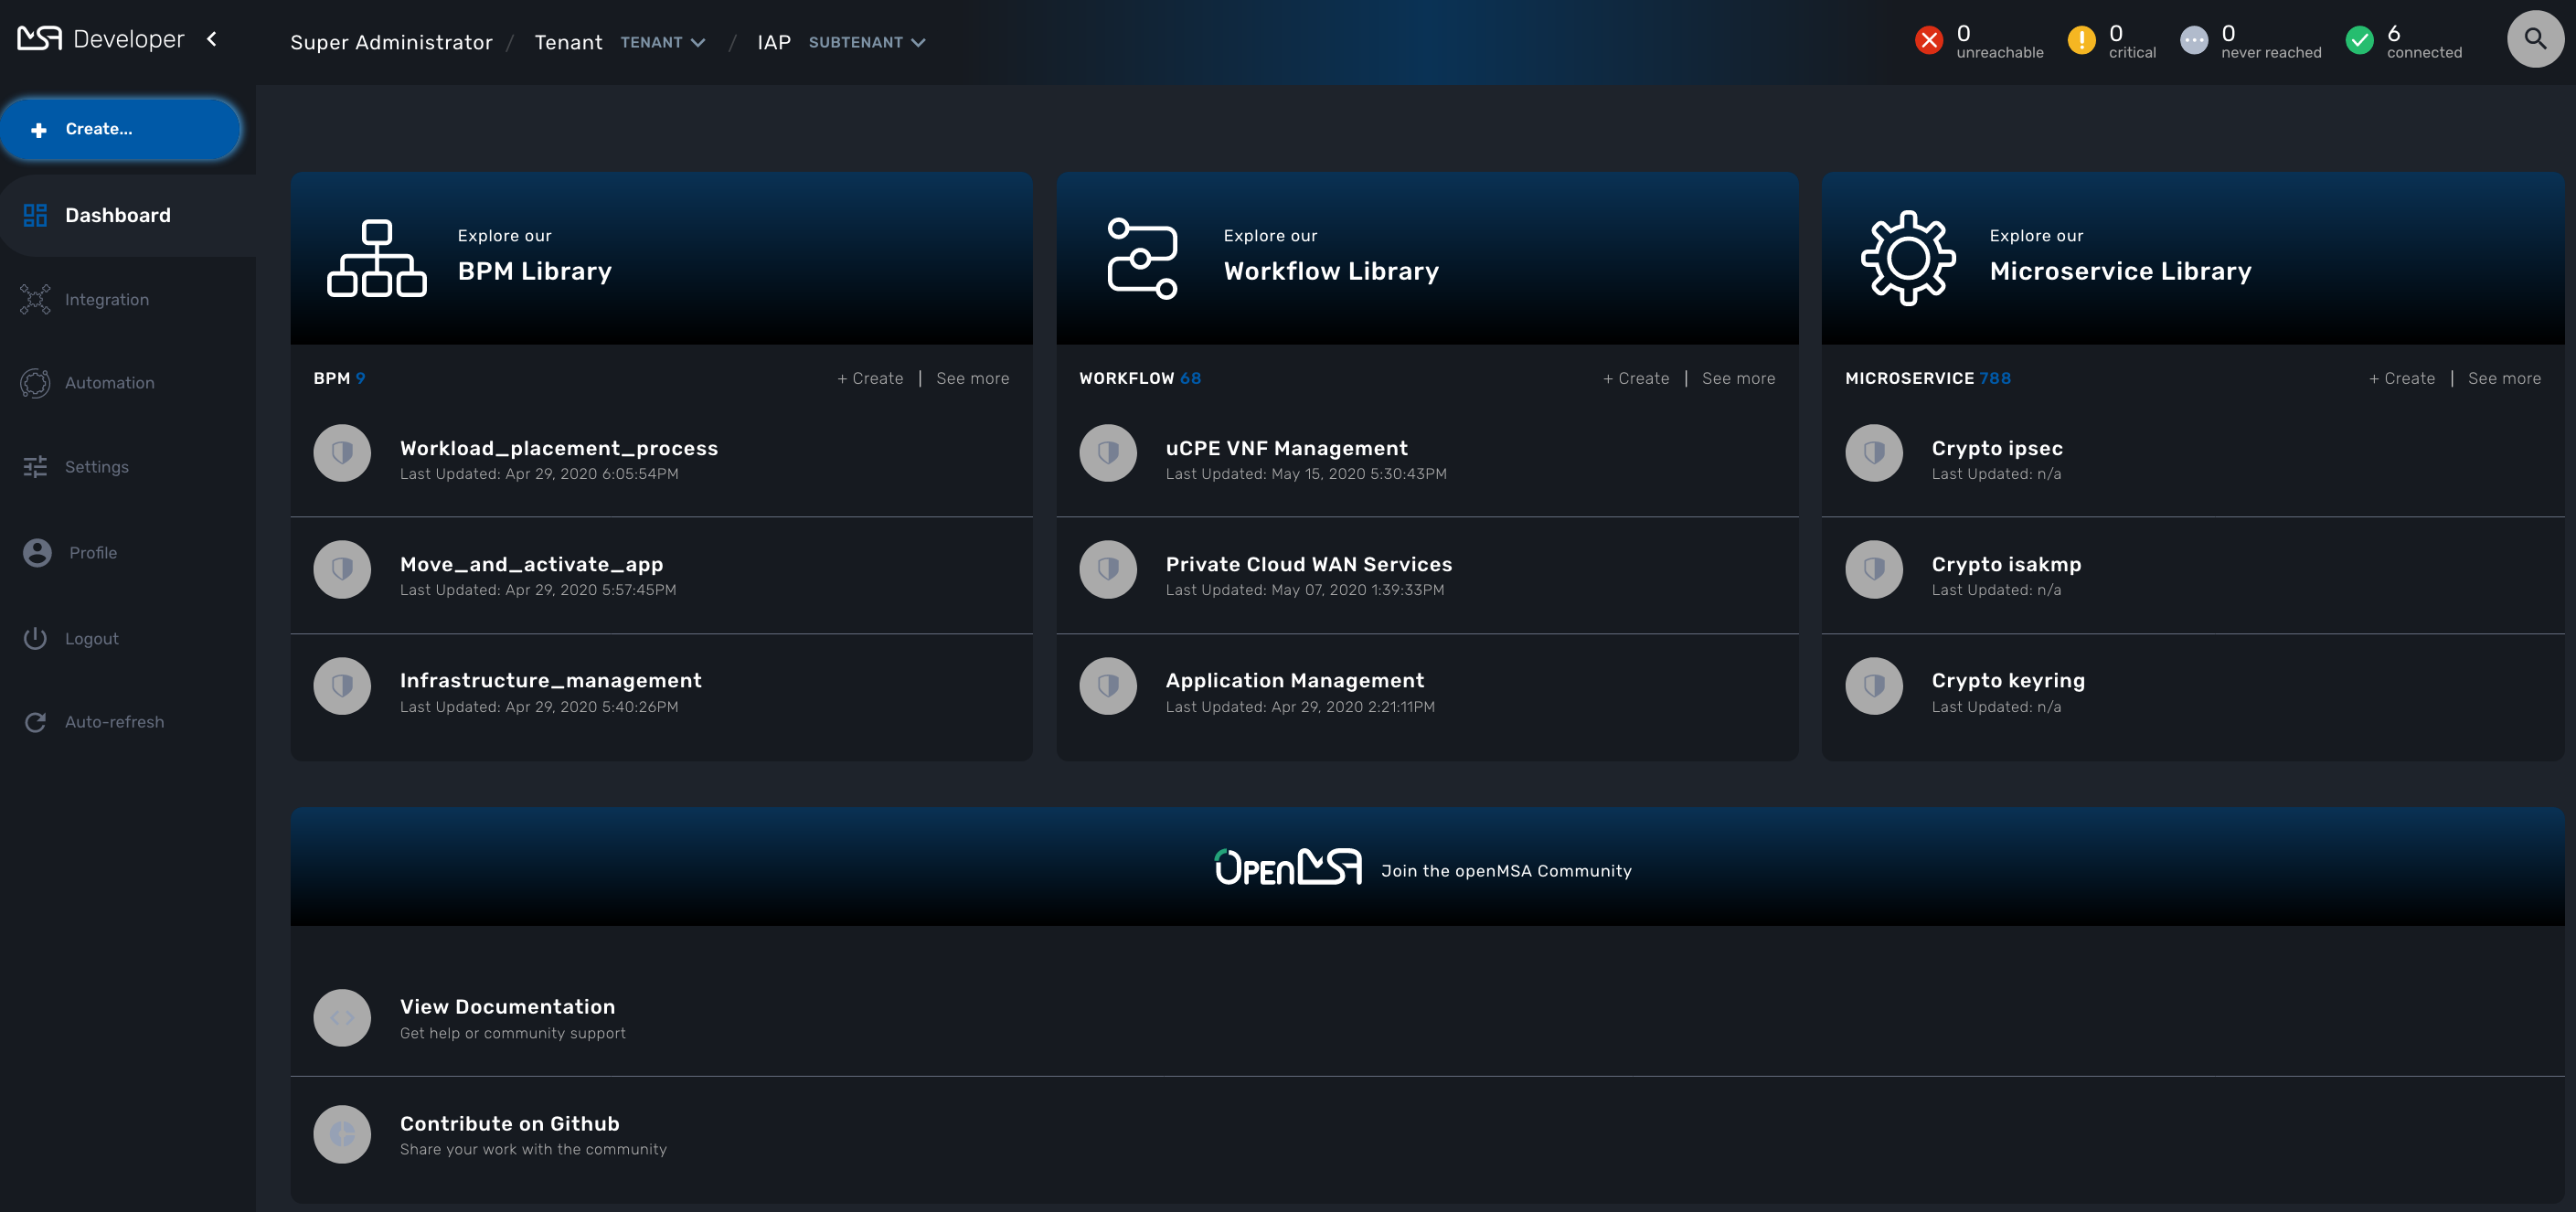
The swimlanes are matching the 3 layers of integration and automation: BPM, Workflows and Microservices
| The username and password you use to access either dashboard is the same, the selection on the login screen simply determines which dashboard you can see after logging in. |
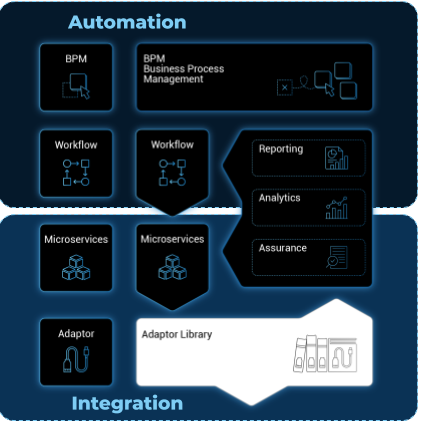
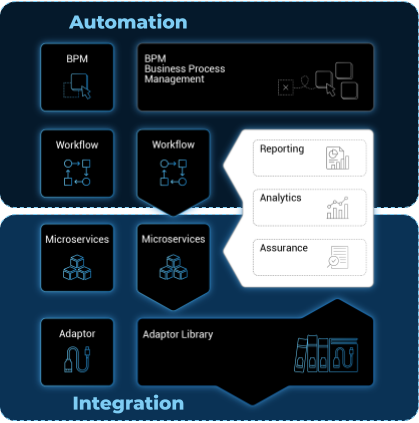
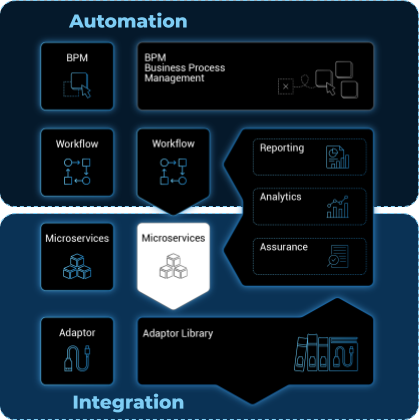
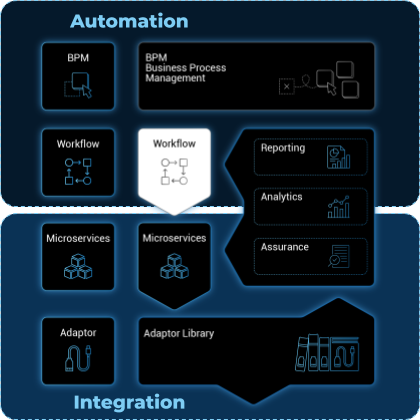
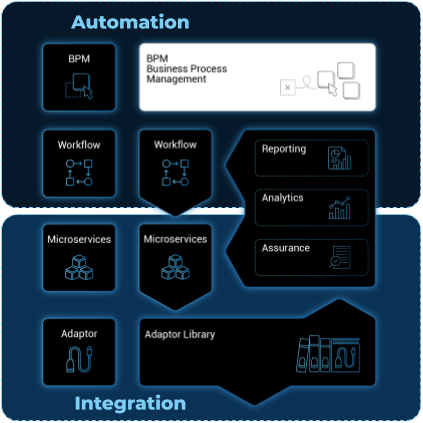
A multi-layered architecture
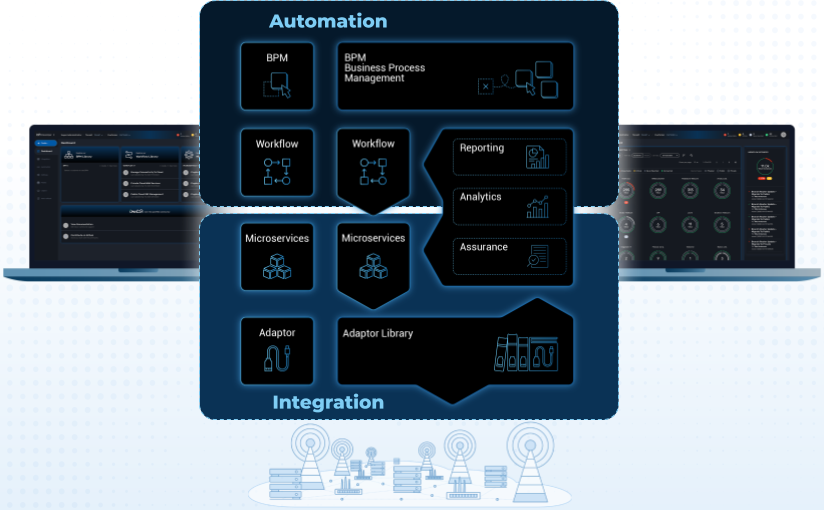
The MSactivator™ architecture is composed of 2 main layers, the Automation layer and the Integration layer.
Each layer is composed of 2 sub-layers:
-
The BPM and Workflows
-
The Microservices and Adapters
Each of the layers are themselves split into 2 functional blocks: the Development and the Management.
For instance, the microservices layer is composed of an extendable library of microservices, ready to use and the development environment to update the microservices in order to extend the library.
The Reporting, Analytics and Assurance layers span vertically across the Automation and Integration layer as they are fully integrated with them.
Roles and Tenants
The MSactivator™ has 2 levels of tenancy: tenant and subtenant.
These 2 levels will let you organize your managed entities based on your need will ensuring that access restriction based on the user role is fully respected.
4 user roles are available to make sure that you can assign the access and managing roles to your users based on their actual roles in your company.
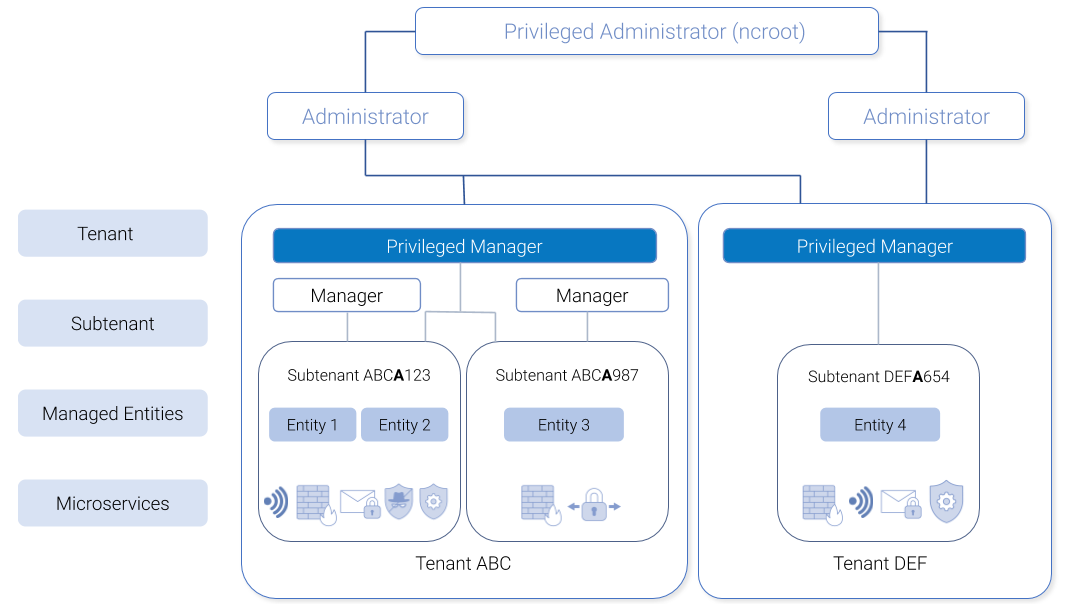
A tenant contains a set of subtenants. The subtenants contain the managed entities and the deployment settings.
-
ncroot, the privileged admin has a global read/write access to the system.
-
an admin as read/write access to a set of selected tenant.
-
a privileged manager has read/write access to a tenant and his scope cannot go out of his tenant.
-
a manager has a read-only access to a set of subtenants.
Infrastructure
The term "Infrastructure" relates to managed entities, microservices and deployment settings.
Managed entities
The term "Managed Entity" encompasses manageable entities such as network elements (routers, switches, load balancer,etc.), security elements such as firewalls, UTM, etc. but also virtual infrastructure and cloud management layers such as Openstack, AWS, VMWare or even container management platforms such as Rancher, K8,…
Microservices
Microservices can be used to manage a wide variety of services on numerous types of entities, such as network equipment, virtualization infrastructure managers, or even Linux servers.
Microservices is the abstraction layer between the specificities of the managed entities and the genericity required for a true multi-vendor management system.
Microservices will let you define your managed services in a fine-grained and modular manner and provide all the required functions to create, read, update, delete and import these services in a production environment.
The MSactivator™ configuration engine runs on PHP Smarty and allows some scripting to add logic to the generation of the configuration.
Deployment settings
Deployment settings are the logical entities that will bind together the configurations and the managed entities.
Monitoring profiles
Monitoring profiles are the logical entities that will let you define your KPI to monitor and bind these to the monitored entities.
Automation
MSactivator™ features two automation layers designed for different degrees of abstraction that ensure maximum flexibility.
Workflow
The workflow layer addresses domain-specific scenarios which can be highly technically scripted, appealing to DevOps and SecOps engineers.
BPM
The BPM layer offers a visual workflow editor to make MSactivator™ a strong SOAR contender for business process design which appeals to realities and is not enshrined in vendor-specific boundaries. Maximum security remediation policies can be applied as engineers creatively imagine a process applied to all domains involved (security, routing, switching, cloud hosting, etc.).
The UX
Vision: MSactivator™ is to enable a DevOps-ready Integrated Automation Platform to enable the design of multi-vendor, multi-cloud solutions across the entire tech ecosystem (data center to WAN, edge computing and IoT: all wrapped with security).
Target users: SI engineers developing (DevOps) end-to-end solutions for their business customers, or end-users managing the lifecycle of their infrastructure or the services they are deploying (Telco, Cloud, MSSP, etc.).
A UX reflecting the above wide variety of technical scenarios and user experiences was required and it became obvious that this redesign was becoming a critical enabler of this strategy.
-
The MSactivator™ UI provides two navigation environments to address both types of user:
-
A developer-centric environment.
-
An end-user-centric environment.
-
-
A UX structure in line with our modular MSactivator™ architecture (microservices, workflows, etc.) for consistency and greater concept adoption.
-
A universal taxonomy (naming and tagging) that would appeal to the entire ecosystem no matter the domain or the use case (data center, services, security, networking, wireless, wireline, IoT, etc.).
-
A modern UX where navigation user experience matters more than feature list.
-
A UX that connects to our community for greater intel and information-sharing among all of the MSactivator™ users and developers.
-
A UX that becomes an evergreen platform, which we continue to improve over time, making our
agility by designclaim a tangible reality for our customers and partners. -
A UX that becomes a strategic module of the MSactivator™ strategy as we head towards 5G, edge computing and IoT.
Terminology
The 10 terms that define the tree of the MSactivator™ navigation:
|
|
Manager and Developer Portal
The MSactivator™ provides a web based UI split into 2 distinct spaces: a manager space and a developer space.
Overview
Each space is designed to match the specific requirements of manager and developer and at the same time provide a consistent user experience.
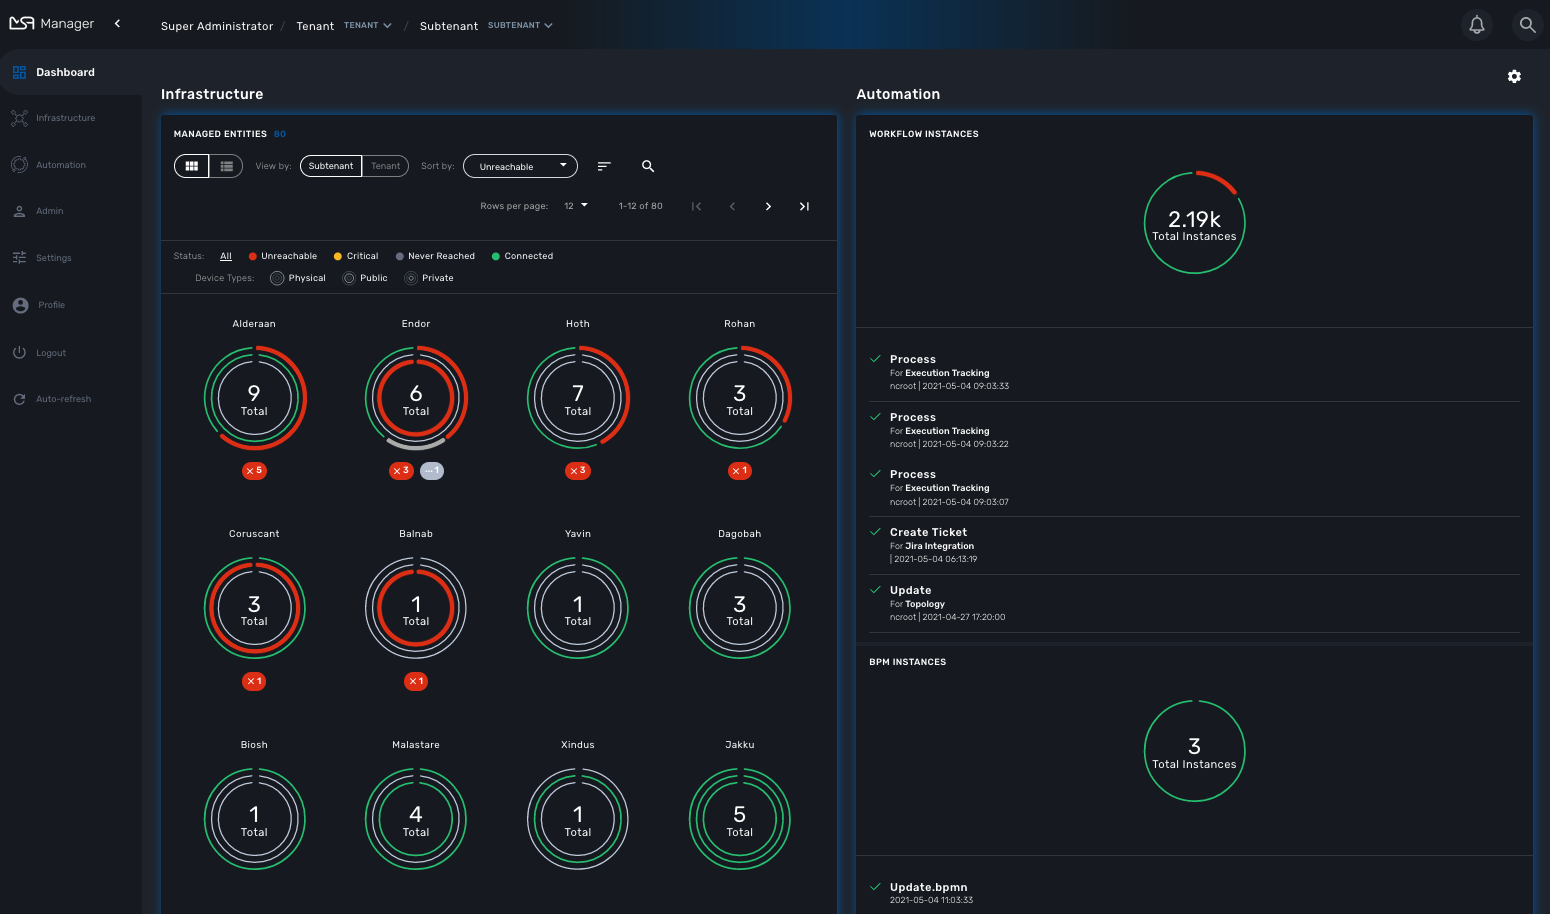
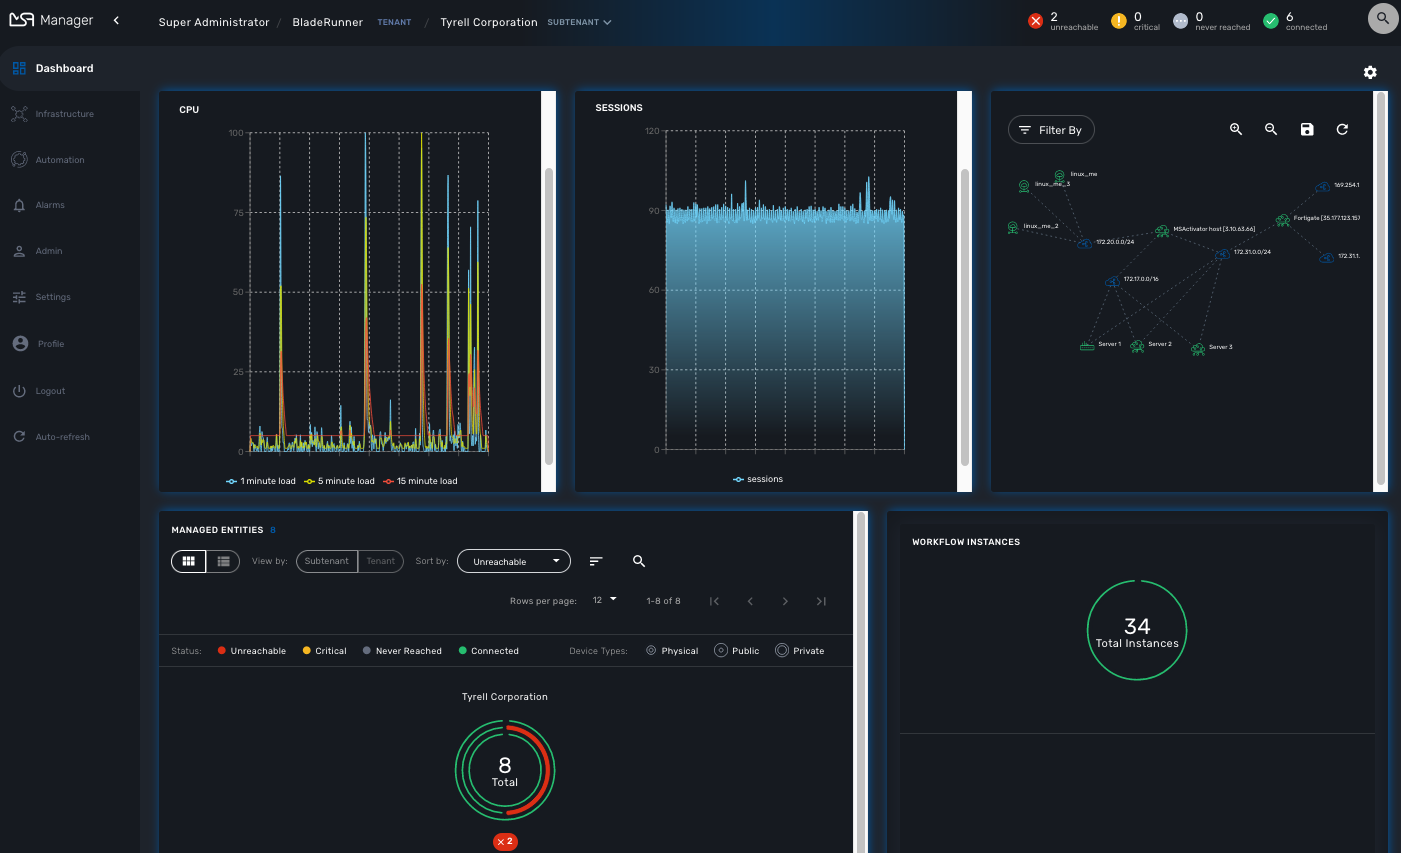
Manager dashboard
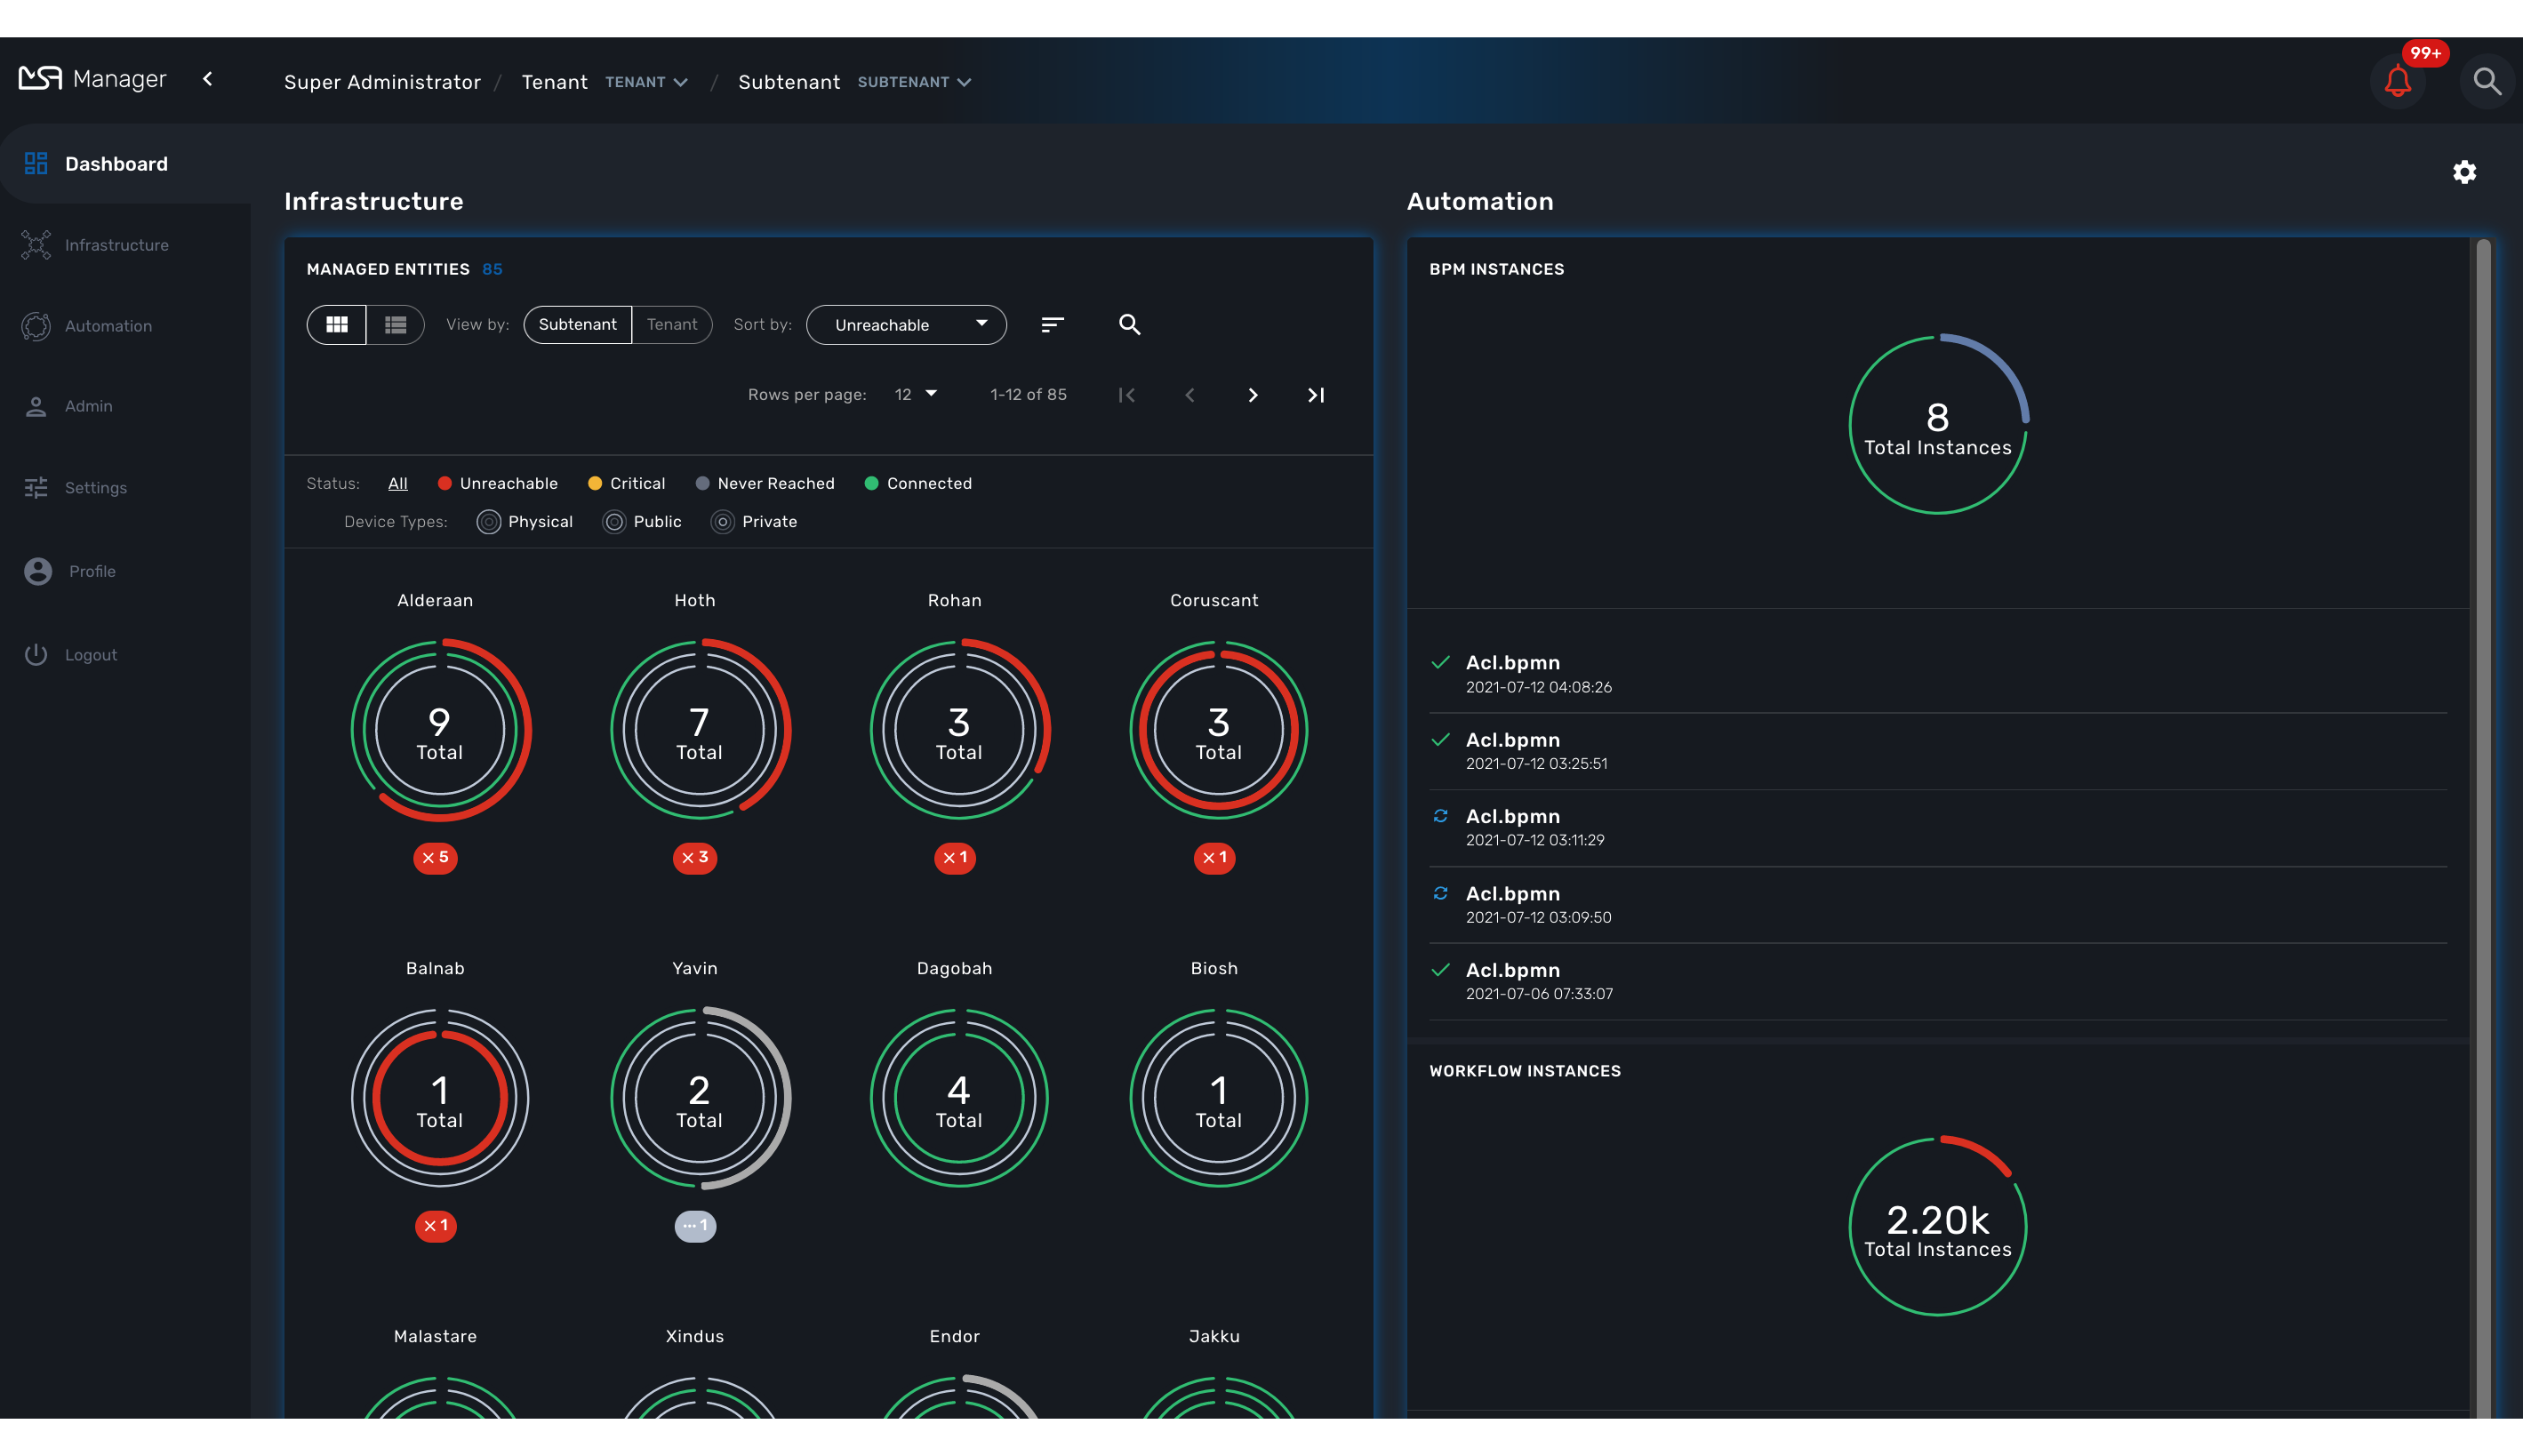
When you login as an administrator or a manager, the following dashboard is displayed
Dashboard |
Display graphs to show the overall status of customer managed entities and workflow instance. Each of the graphs represents the status of the managed entities for the named customer. |
Infrastructure |
Shows the managed entities, microservices and deployment settings. |
Automation |
Shows the workflows and BPM that are in use and available for use in the system. |
Alarms |
For showing and searching the event and managing the alarms |
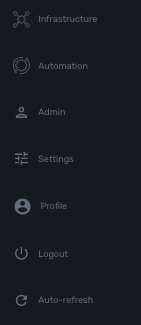
Admin |
Manage tenants and users. |
Settings |
For license activation and product version |
Auto-refresh |
Set an overall refresh period in seconds. |
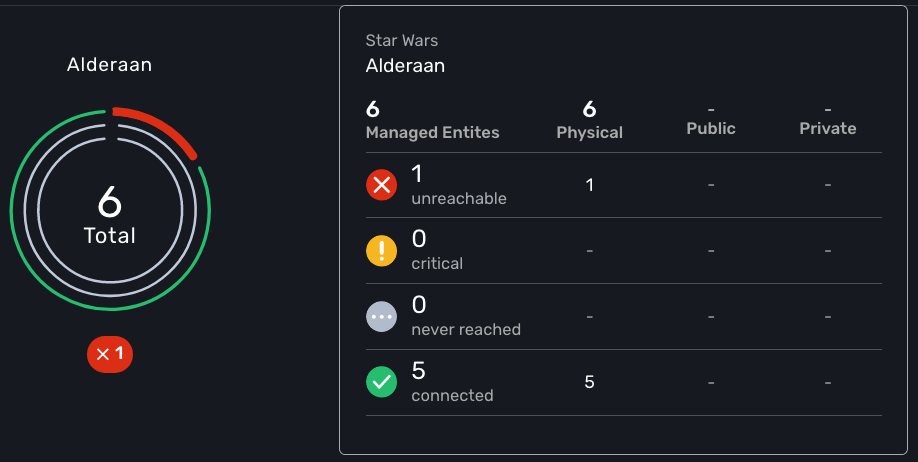
Status graphs
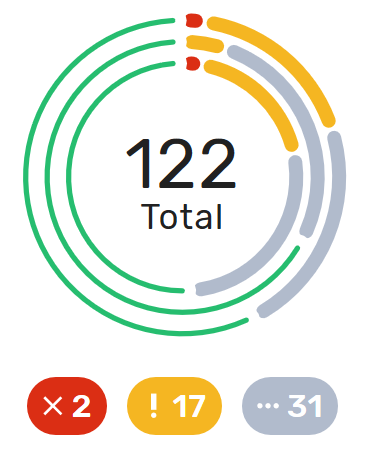
This graph is very convenient, as it represents a lot of data in a small area. Firstly, it is made up of three concentric circles: - The outer circle represents physical entities. - The middle circle represents public entities. - The inner circle represents private entities.
To further illustrate this, a legend is provided on the dashboard to explain each circle purpose:

| It is up to the MSactivator™ to decide the type of each entity when they are configuring that entity entry. |
Finally, the number in the center of the circles is the total number of managed entities associated with that customer. If you click on any of those status graphs, you then see a pop-up table containing the same details but in a matrix like so:
Filters, sorts and search
On the administrator dashboard, there are a number of filter, sort, and search options available to help you organize and view your data.

-
The first icon allows you to switch between the status graphs and the compact list view of the customer entity status.
-
The second icon enables you to switch between a tenant view and a customer view. When clicked, the status graphs will display the tenant-level status data, which aggregates all of the customers in each tenancy into a single graph per tenancy. We will discuss customer and tenancy navigation further in the Navigating via tenant and customer filters section.
-
The third icon enables you to sort the status graph lists using the following options.
-
Finally, the last icon is a magnifying glass that can be used to search for a specific tenant or customer within the list being displayed.
Navigation
How to select tenants and Subtenants
A central part of the navigation in MSactivator™ is understanding the tenant and customer that are selected. You can use the drop-downs on the top of the navigation to choose which tenant and customer you want to filter the lists of managed entities, microservices, and workflows by.
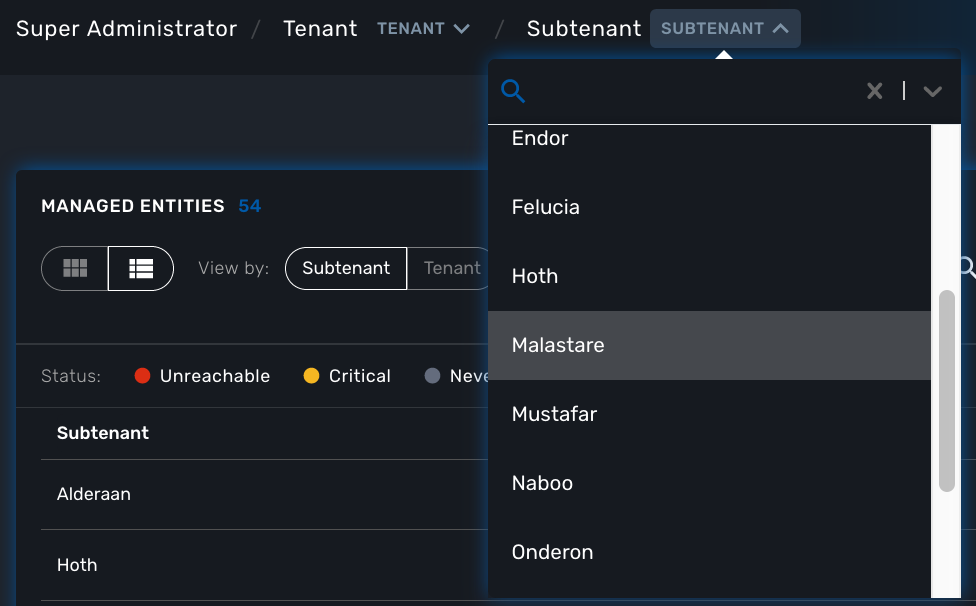
| Note that the Role-Based Access Controls (RBAC) will affect what tenants and customers will be available to you. For example, if your account only has access to one tenant, you won’t even have the option to select a different tenant. |
One very important topic to note is that your tenant and filter selection are persistent between screens.
One useful feature in the tenant and customer selection drop-downs is the ability to search for an item by name. Auto-completion type ahead is also supported.
To clear your selected tenant or customer filters, you simply click on the X button in the drop-down beside the name.
To perform a system-wide search for a managed entity by name, you should firstly click on the search icon in the top-right corner of the screen. Auto-completion type ahead is also supported.
| One important point to remember about performing a managed entity search is that when you search for an entity, you are implicitly selecting the tenant that entity belongs to in the main filter drop-downs. |
Customization
By default the manager dashboard displays the status of the managed entities and the workflow instance but this view can be customized to let you decide the important data that you want to display.
To customize your dashboard, click on the cog icon on the top right of the dashboard. This will open a screen where you can control the settings of your dashboard.
Use the opacity slider to see the result of your changes through the setting screen.
You can add as many component as you need, each component will be added one after the other, on the same line if there is enough space or on the line below.
The custom layout will be persisted and available for the user on any device he uses to connect (browser, tablet, phone,…).
Setting items
For each component of your custom dashboard there are a few settings available
Opacity
You can adjust the opacity to preview how your current settings look like.
Style
You can set two styles: Dashboard Panel and Drawer Button
-
Dashboard Panel: provides the normal behavior as you can see the default settings.
-
Drawer Button: name the button as you like, save, the button will appear next to the cog icon on the top-right corner of the dashboard.
Width and height
Use the sliders to control the size of the component
Component
You can choose the components you want to show on the dashboard: topology view, monitoring graphs, workflow instance variables,…
The options may vary depending on the component. For instance the topology will only show if a subtenant is selected.
Infrastructure
Managed entities
To see the list of managed entities, click on the "Integration" link in the left menu
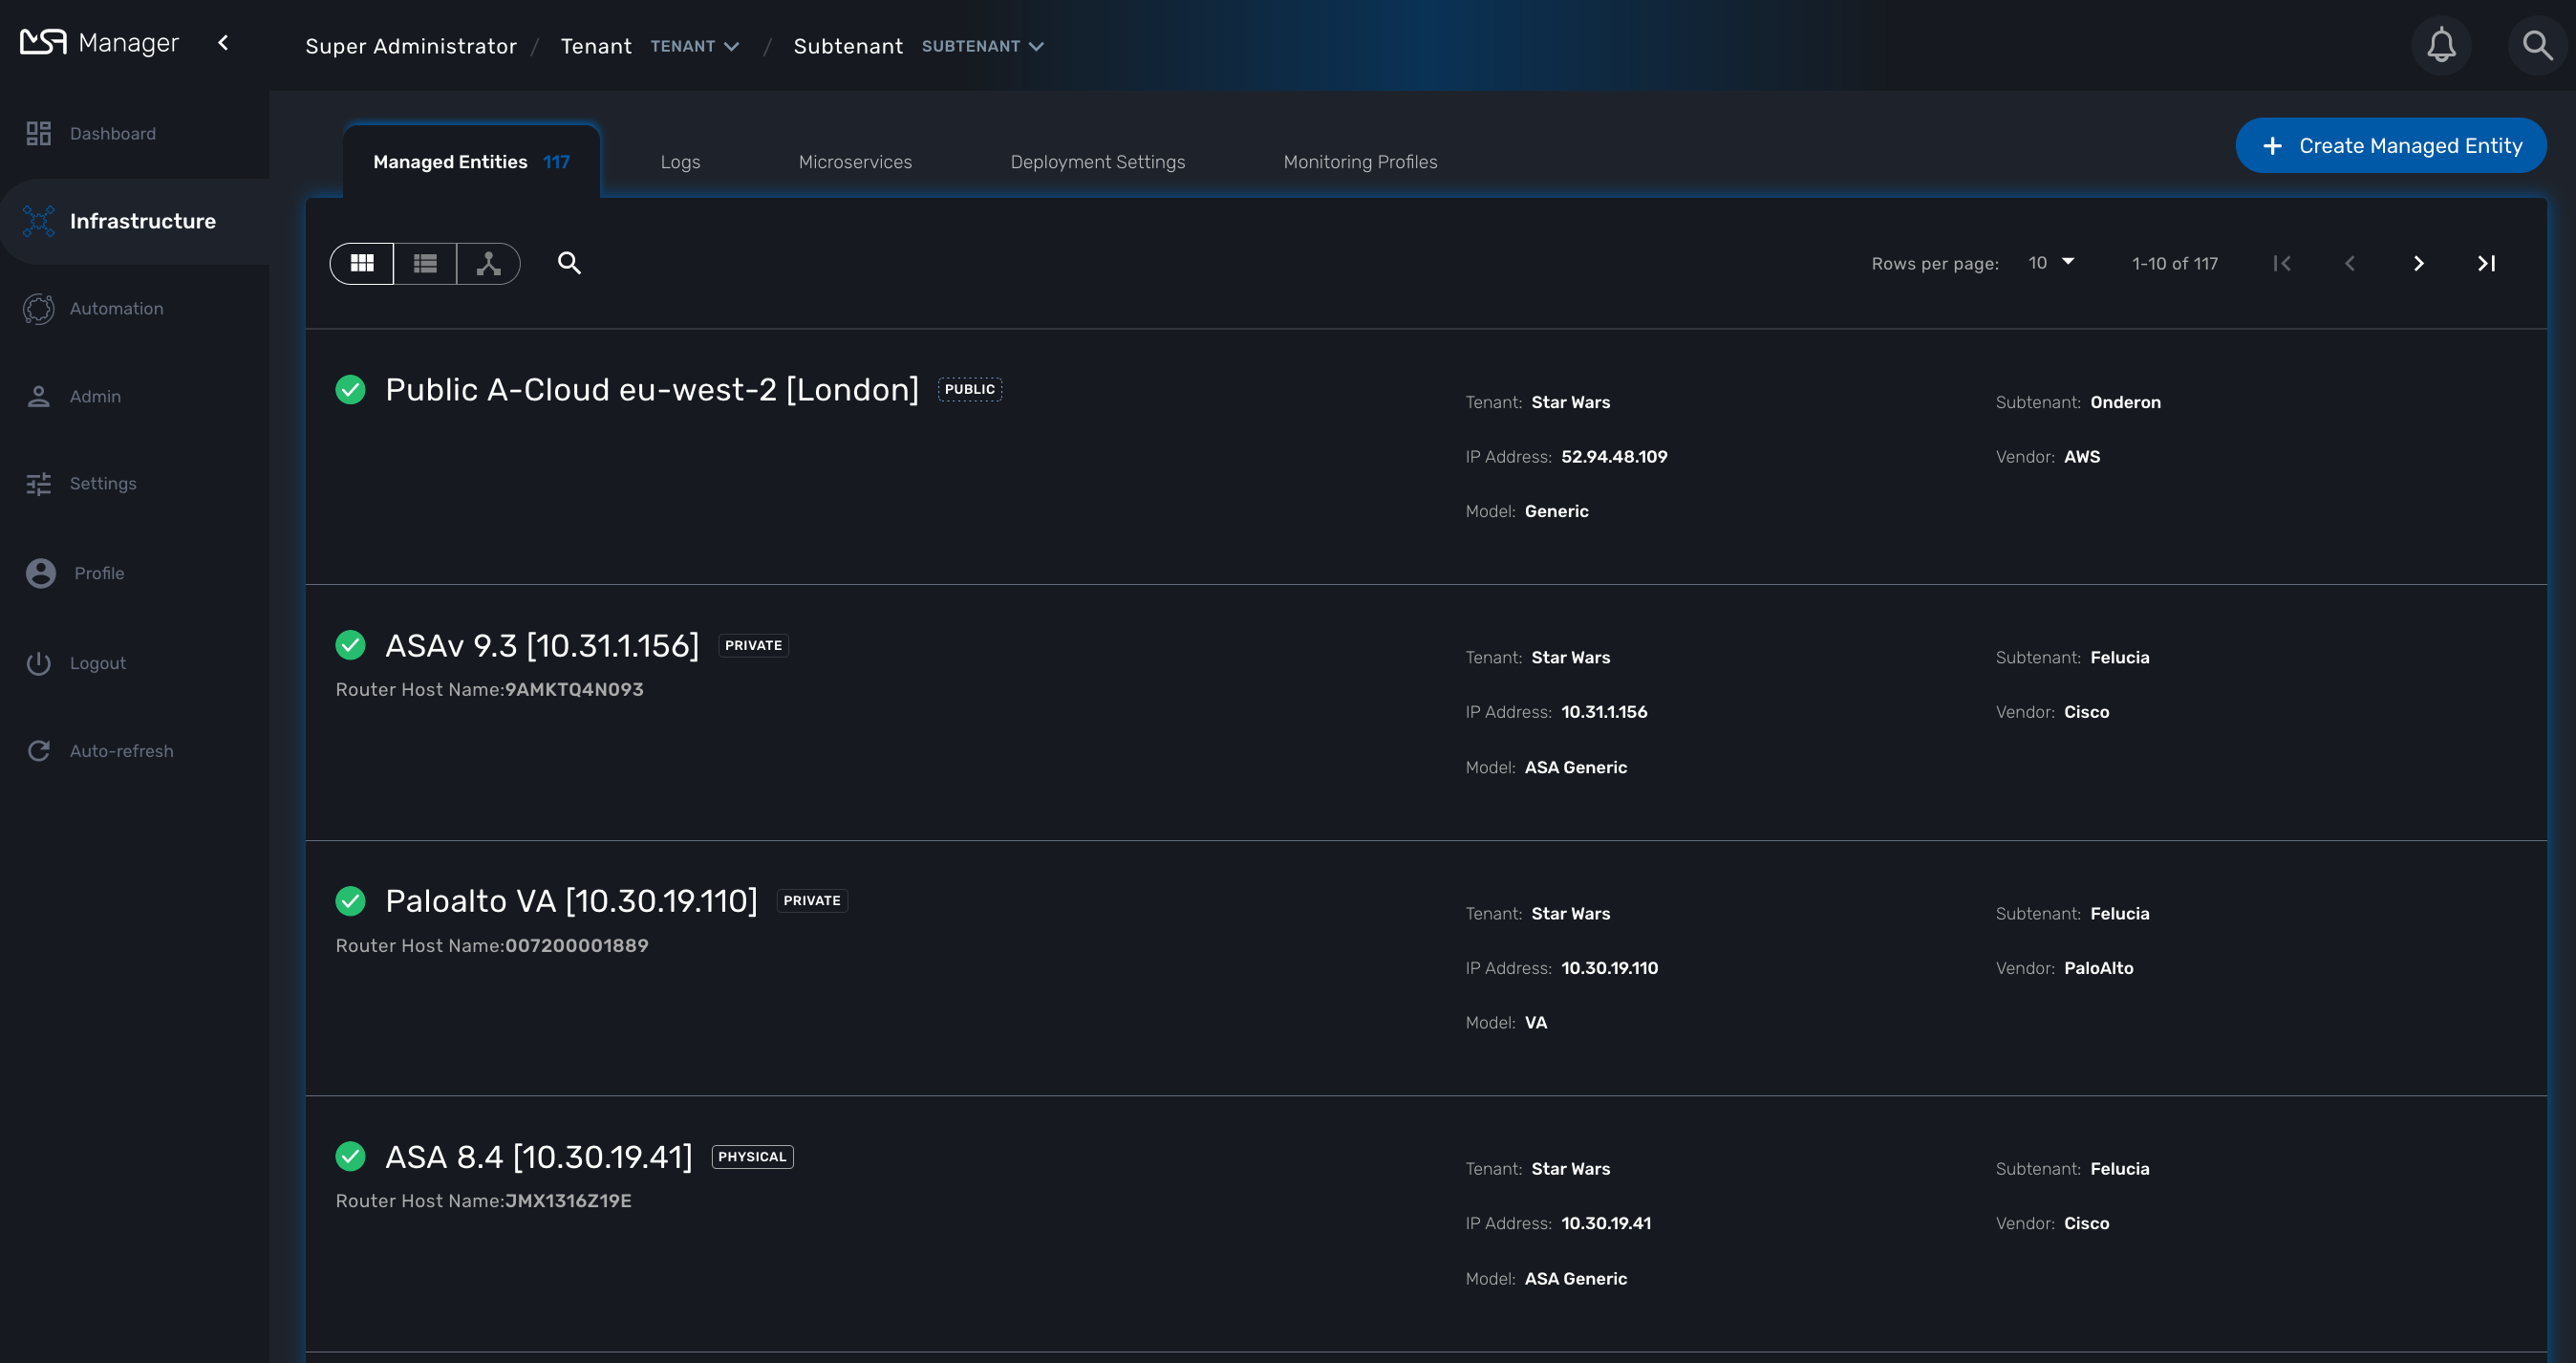
On that screen, you can use the list view toggle button to switch to a compacted view of the managed entities list. You can also adjust the amount of entities displayed on each page
Finally, on this screen you can also perform a simple search of the managed entity you are looking for by its name.
| See also - this documentation for a detailed documentation on managed entities |
Deployment settings
You can view the list of deployment settings by clicking on the tab "Deployment Settings".
This screen will let you build your deployment settings by selecting microservice .
You will also be able to select the Managed Entities you wish to apply you configuration service on.
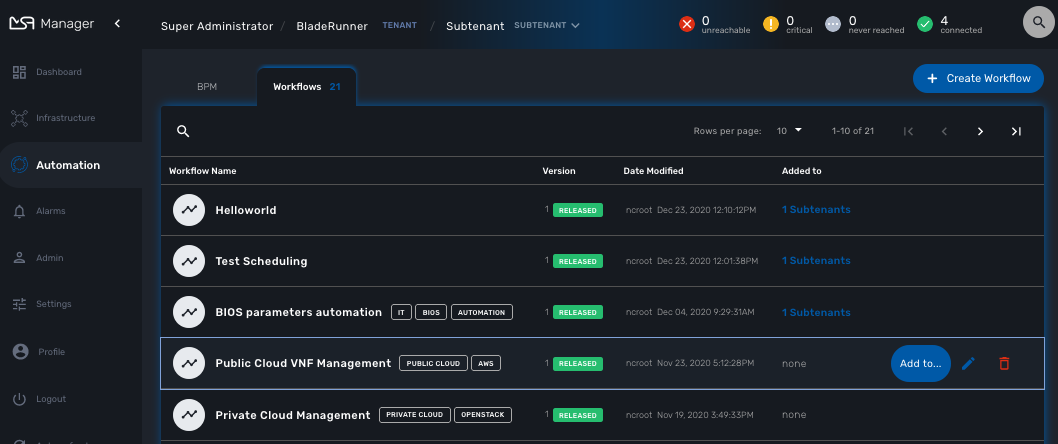
Automation
Workflows
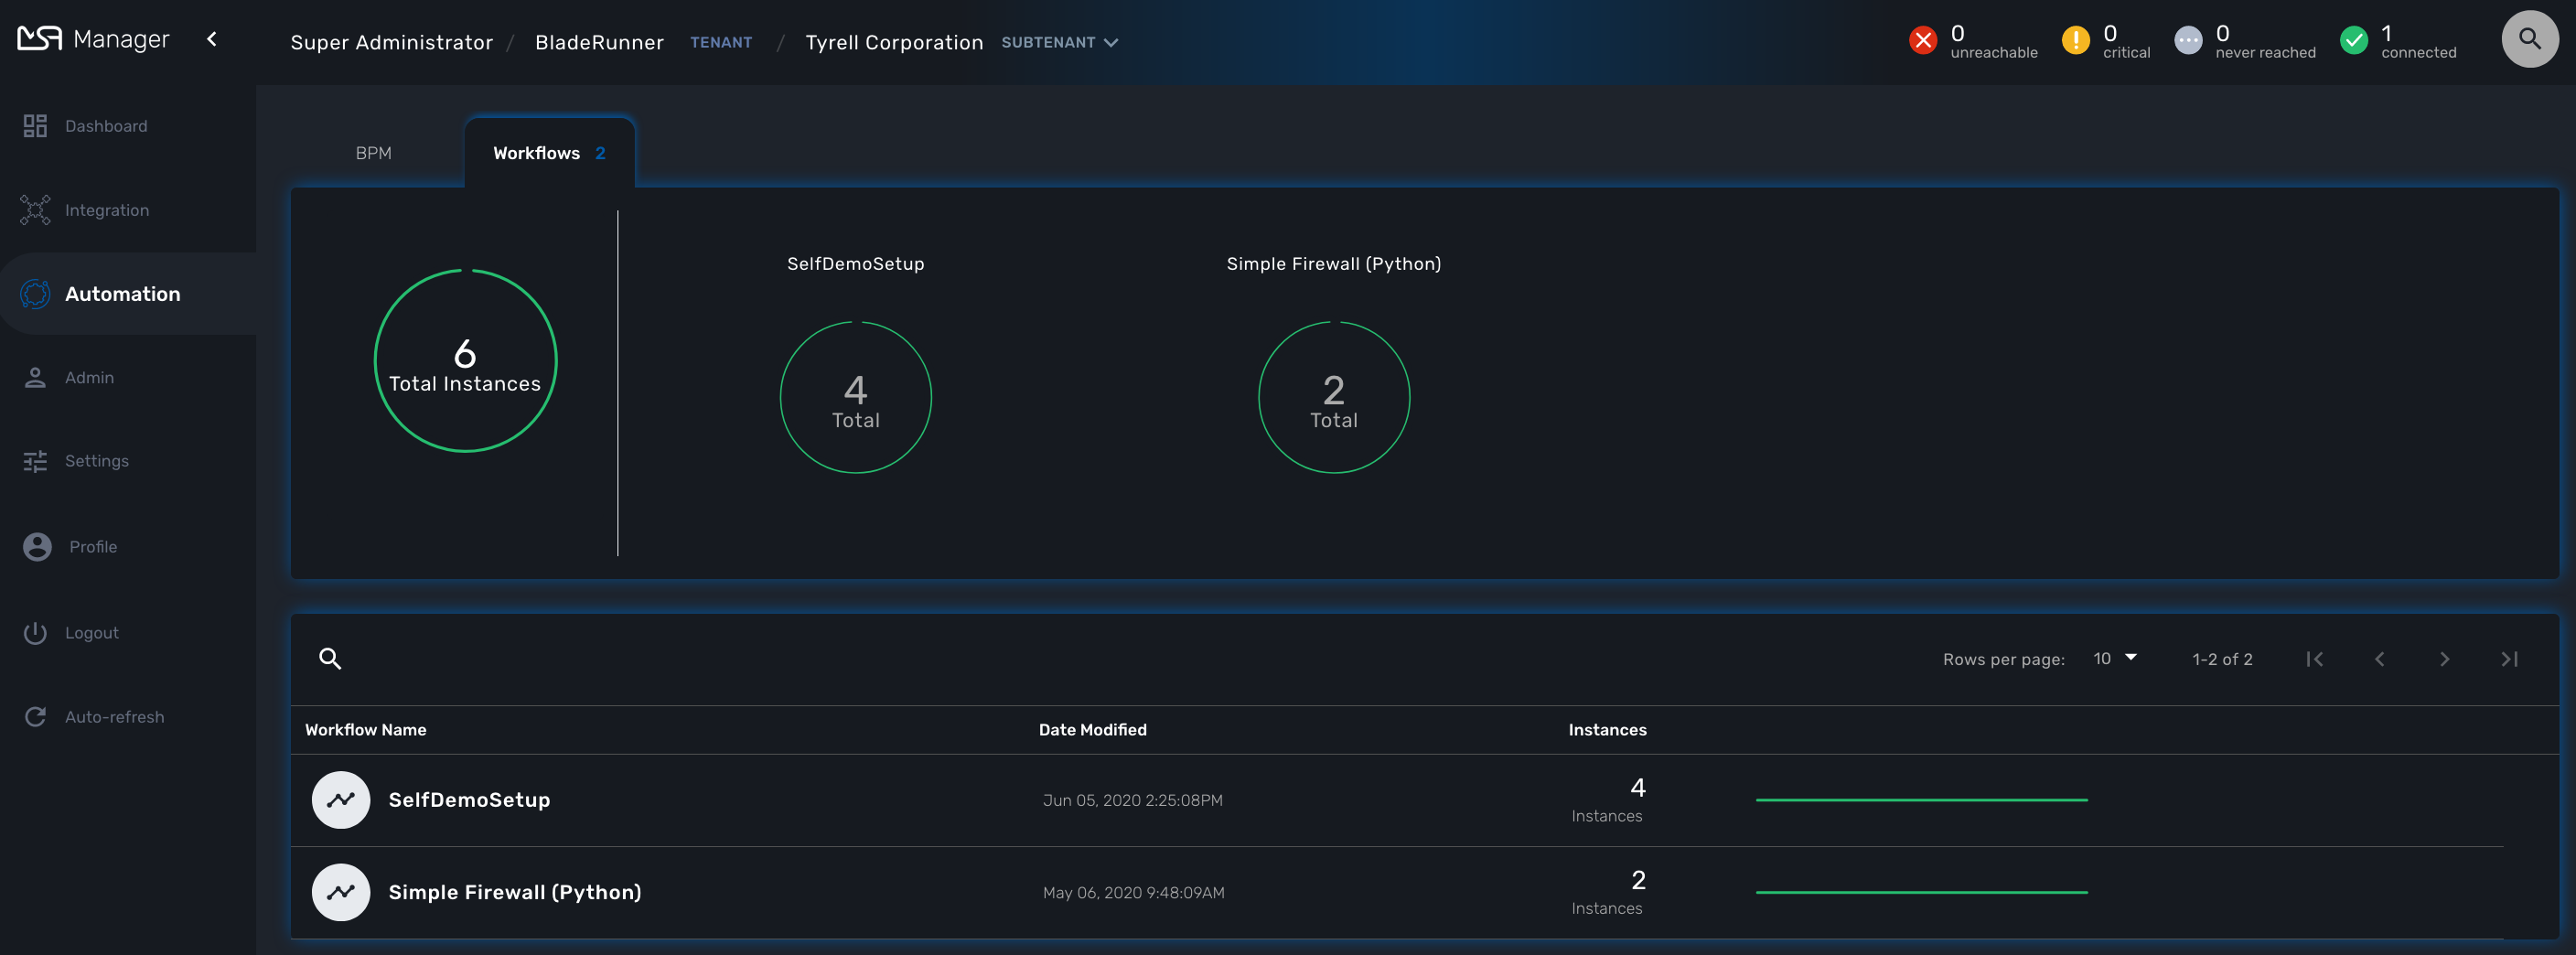
To see the list of workflows select the "Automation" link in the left menu.
By default, if you are connected as a manager or an administrator you will see the list of Workflows that are associated to the subtenant you are managing
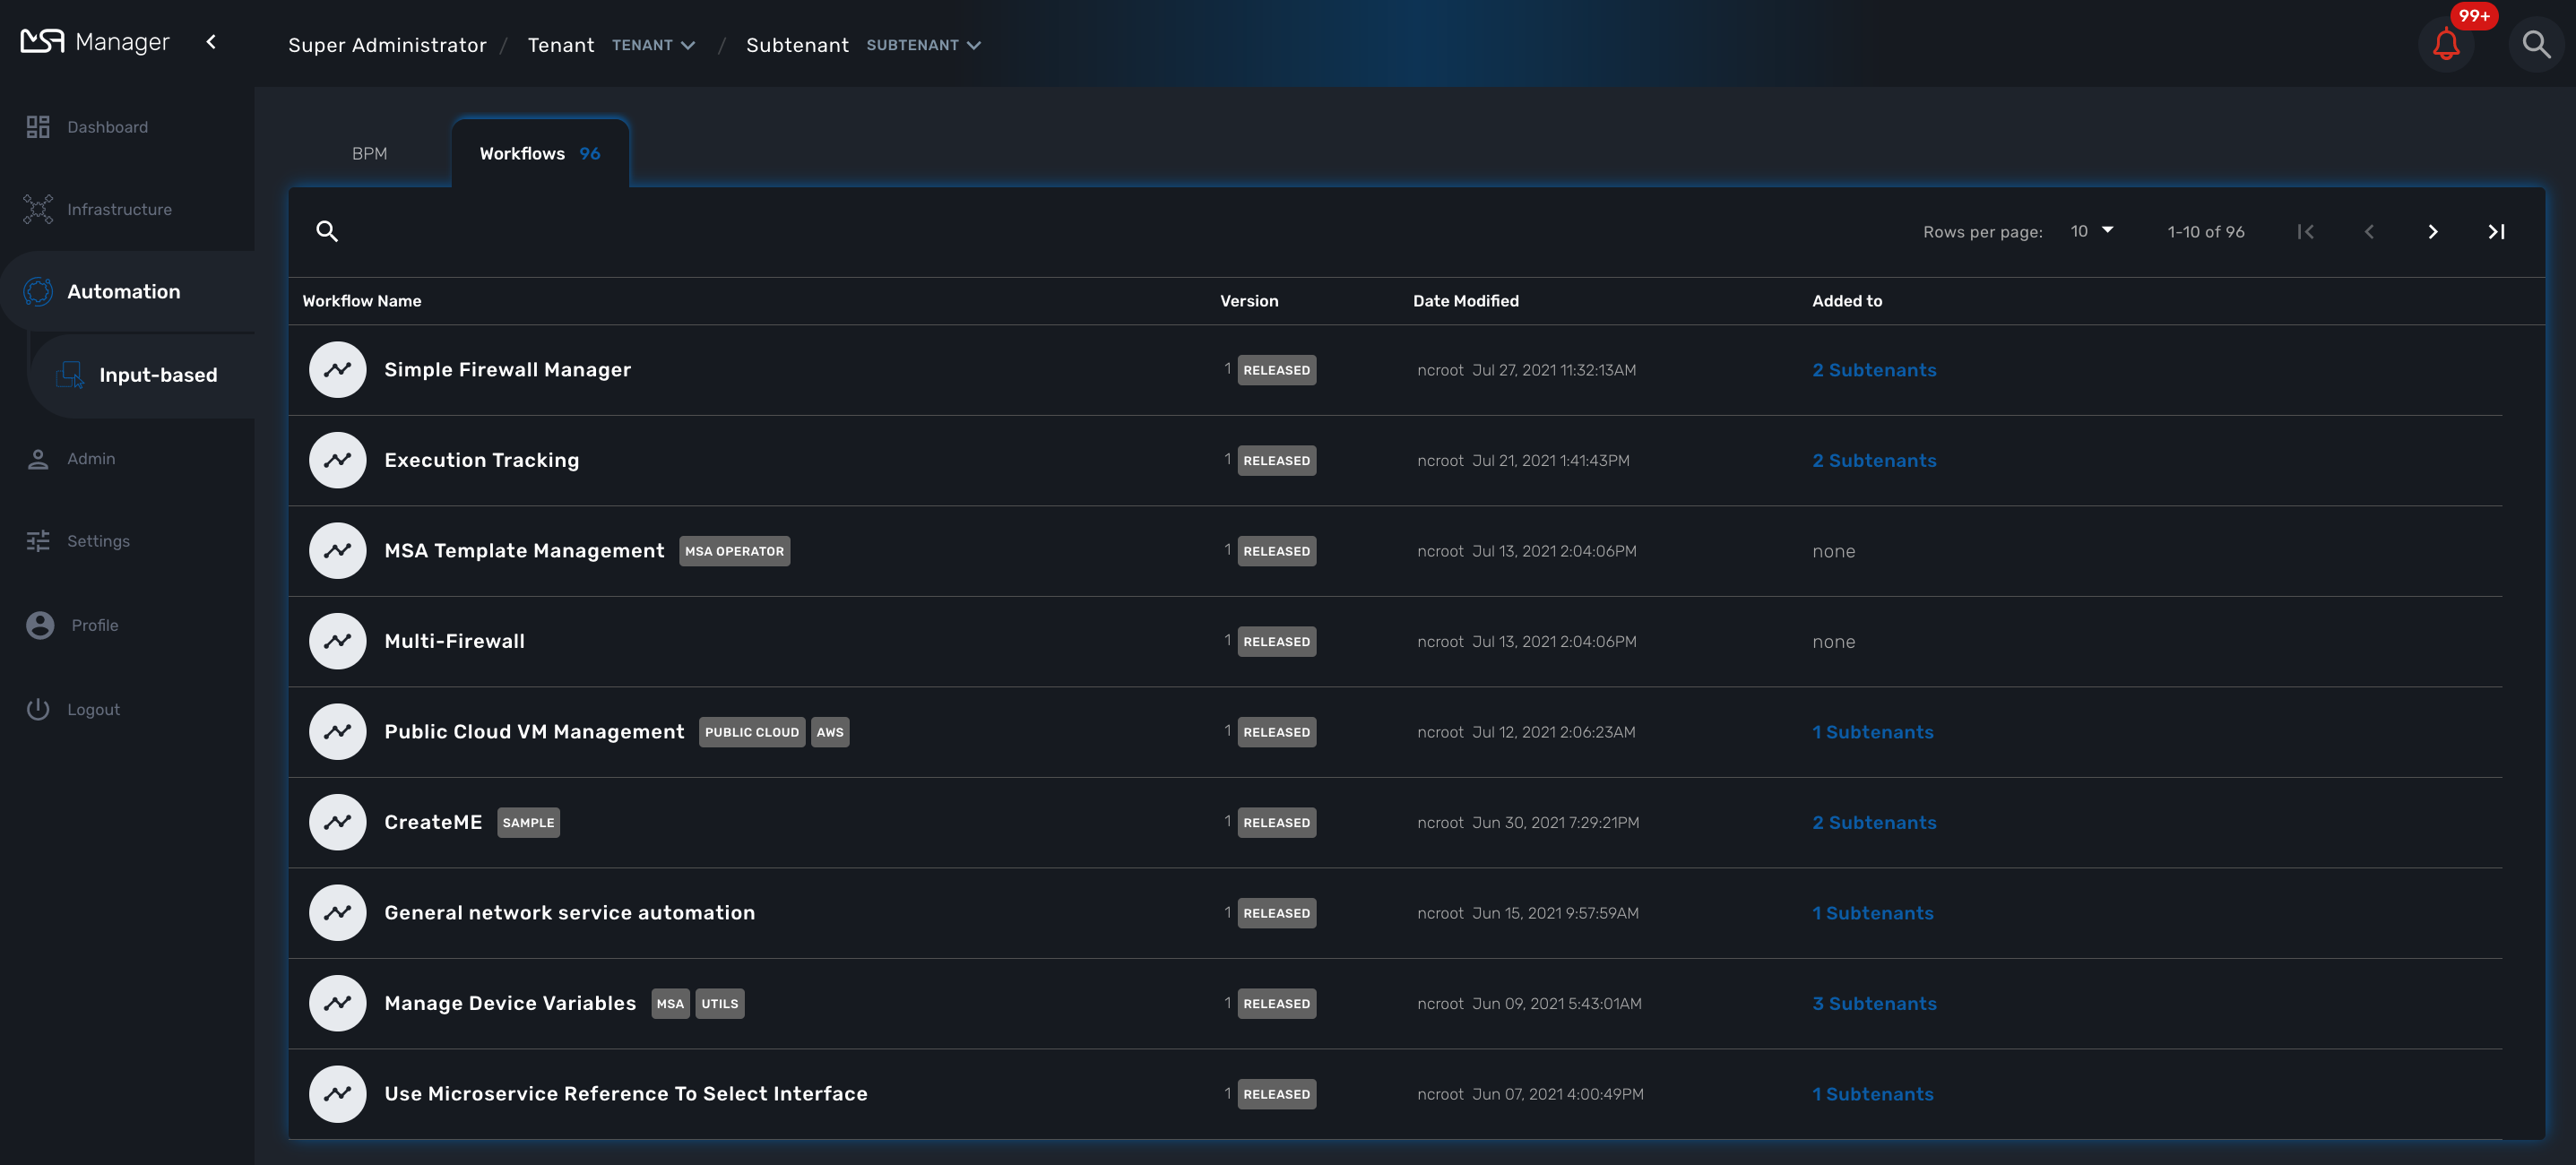
If you select a subtenant, the list will be filtered by the selected subtenant’s workflows and you will see the process execution status of the workflow instances.
To see the workflow instance for a subtenant, you can click on the Workflow name
From this screen you can start using the existing instances or create a new instance for the current Workflow.
BPM
To see the list of Business Processes select the "Automation" link in the left menu
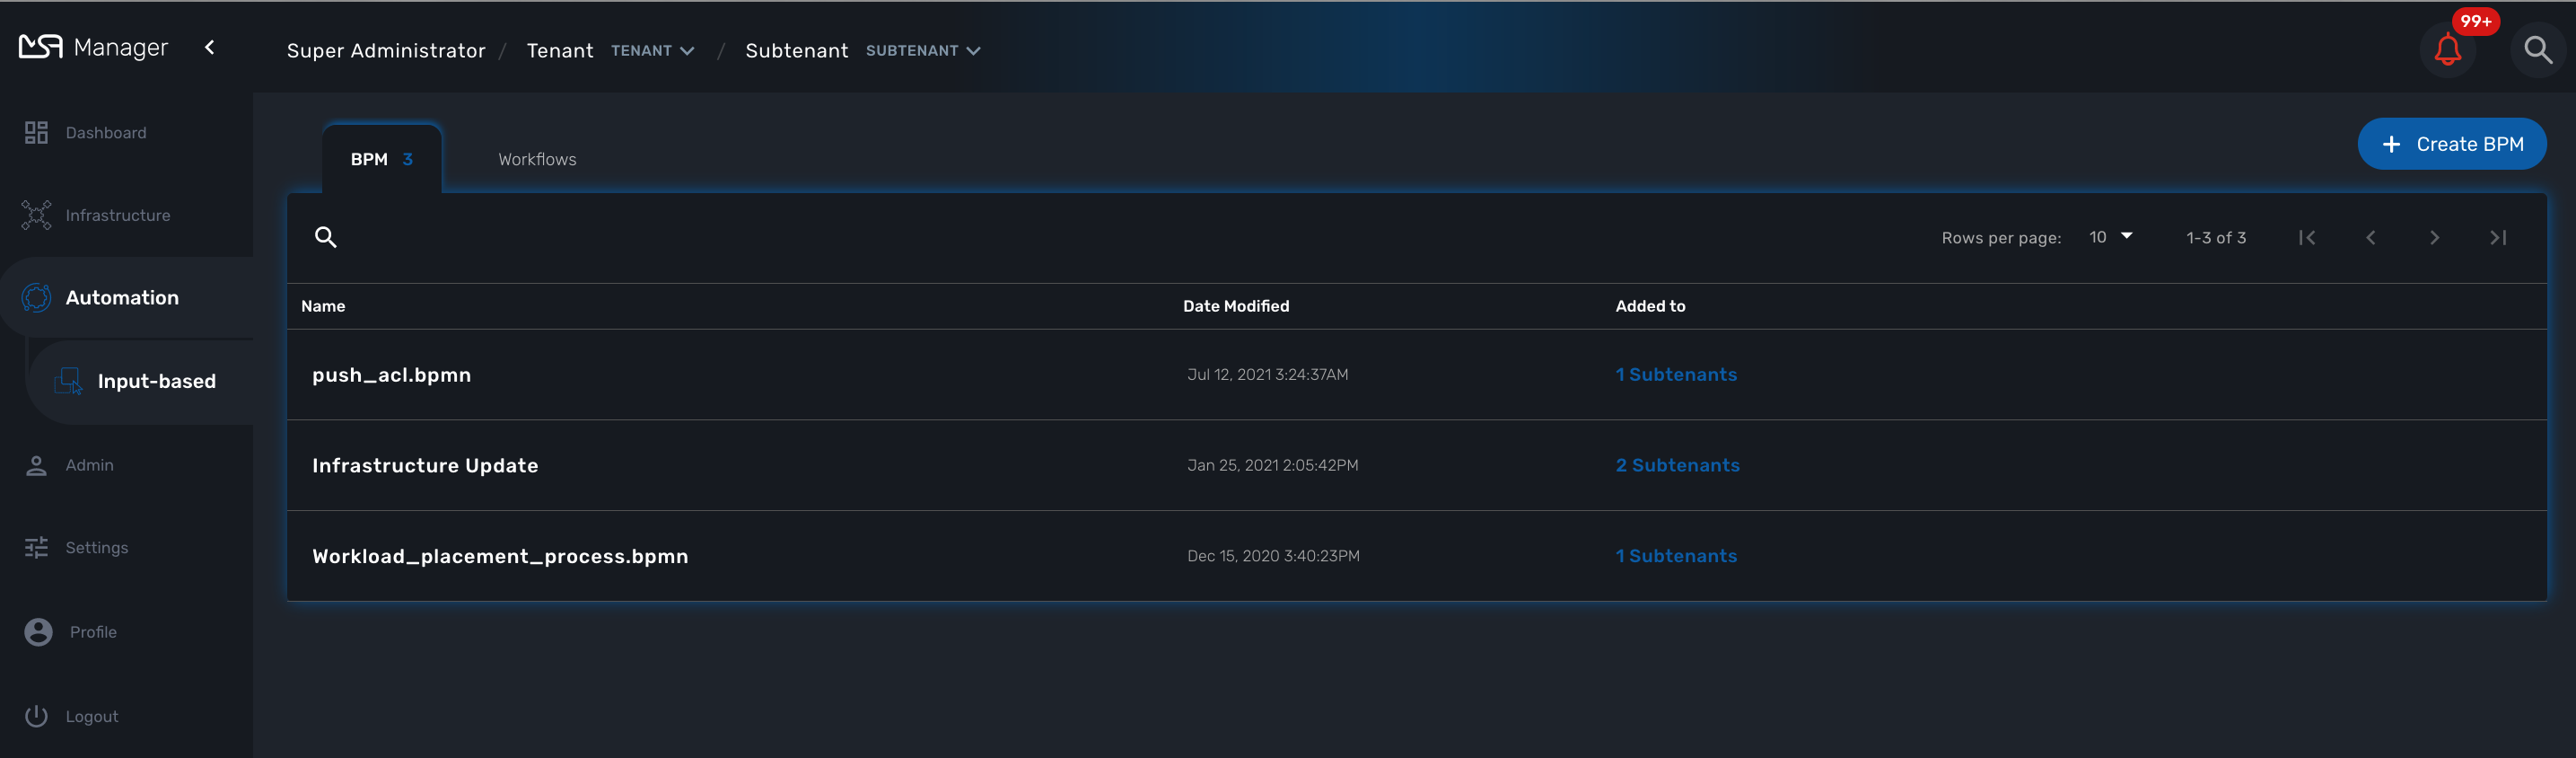
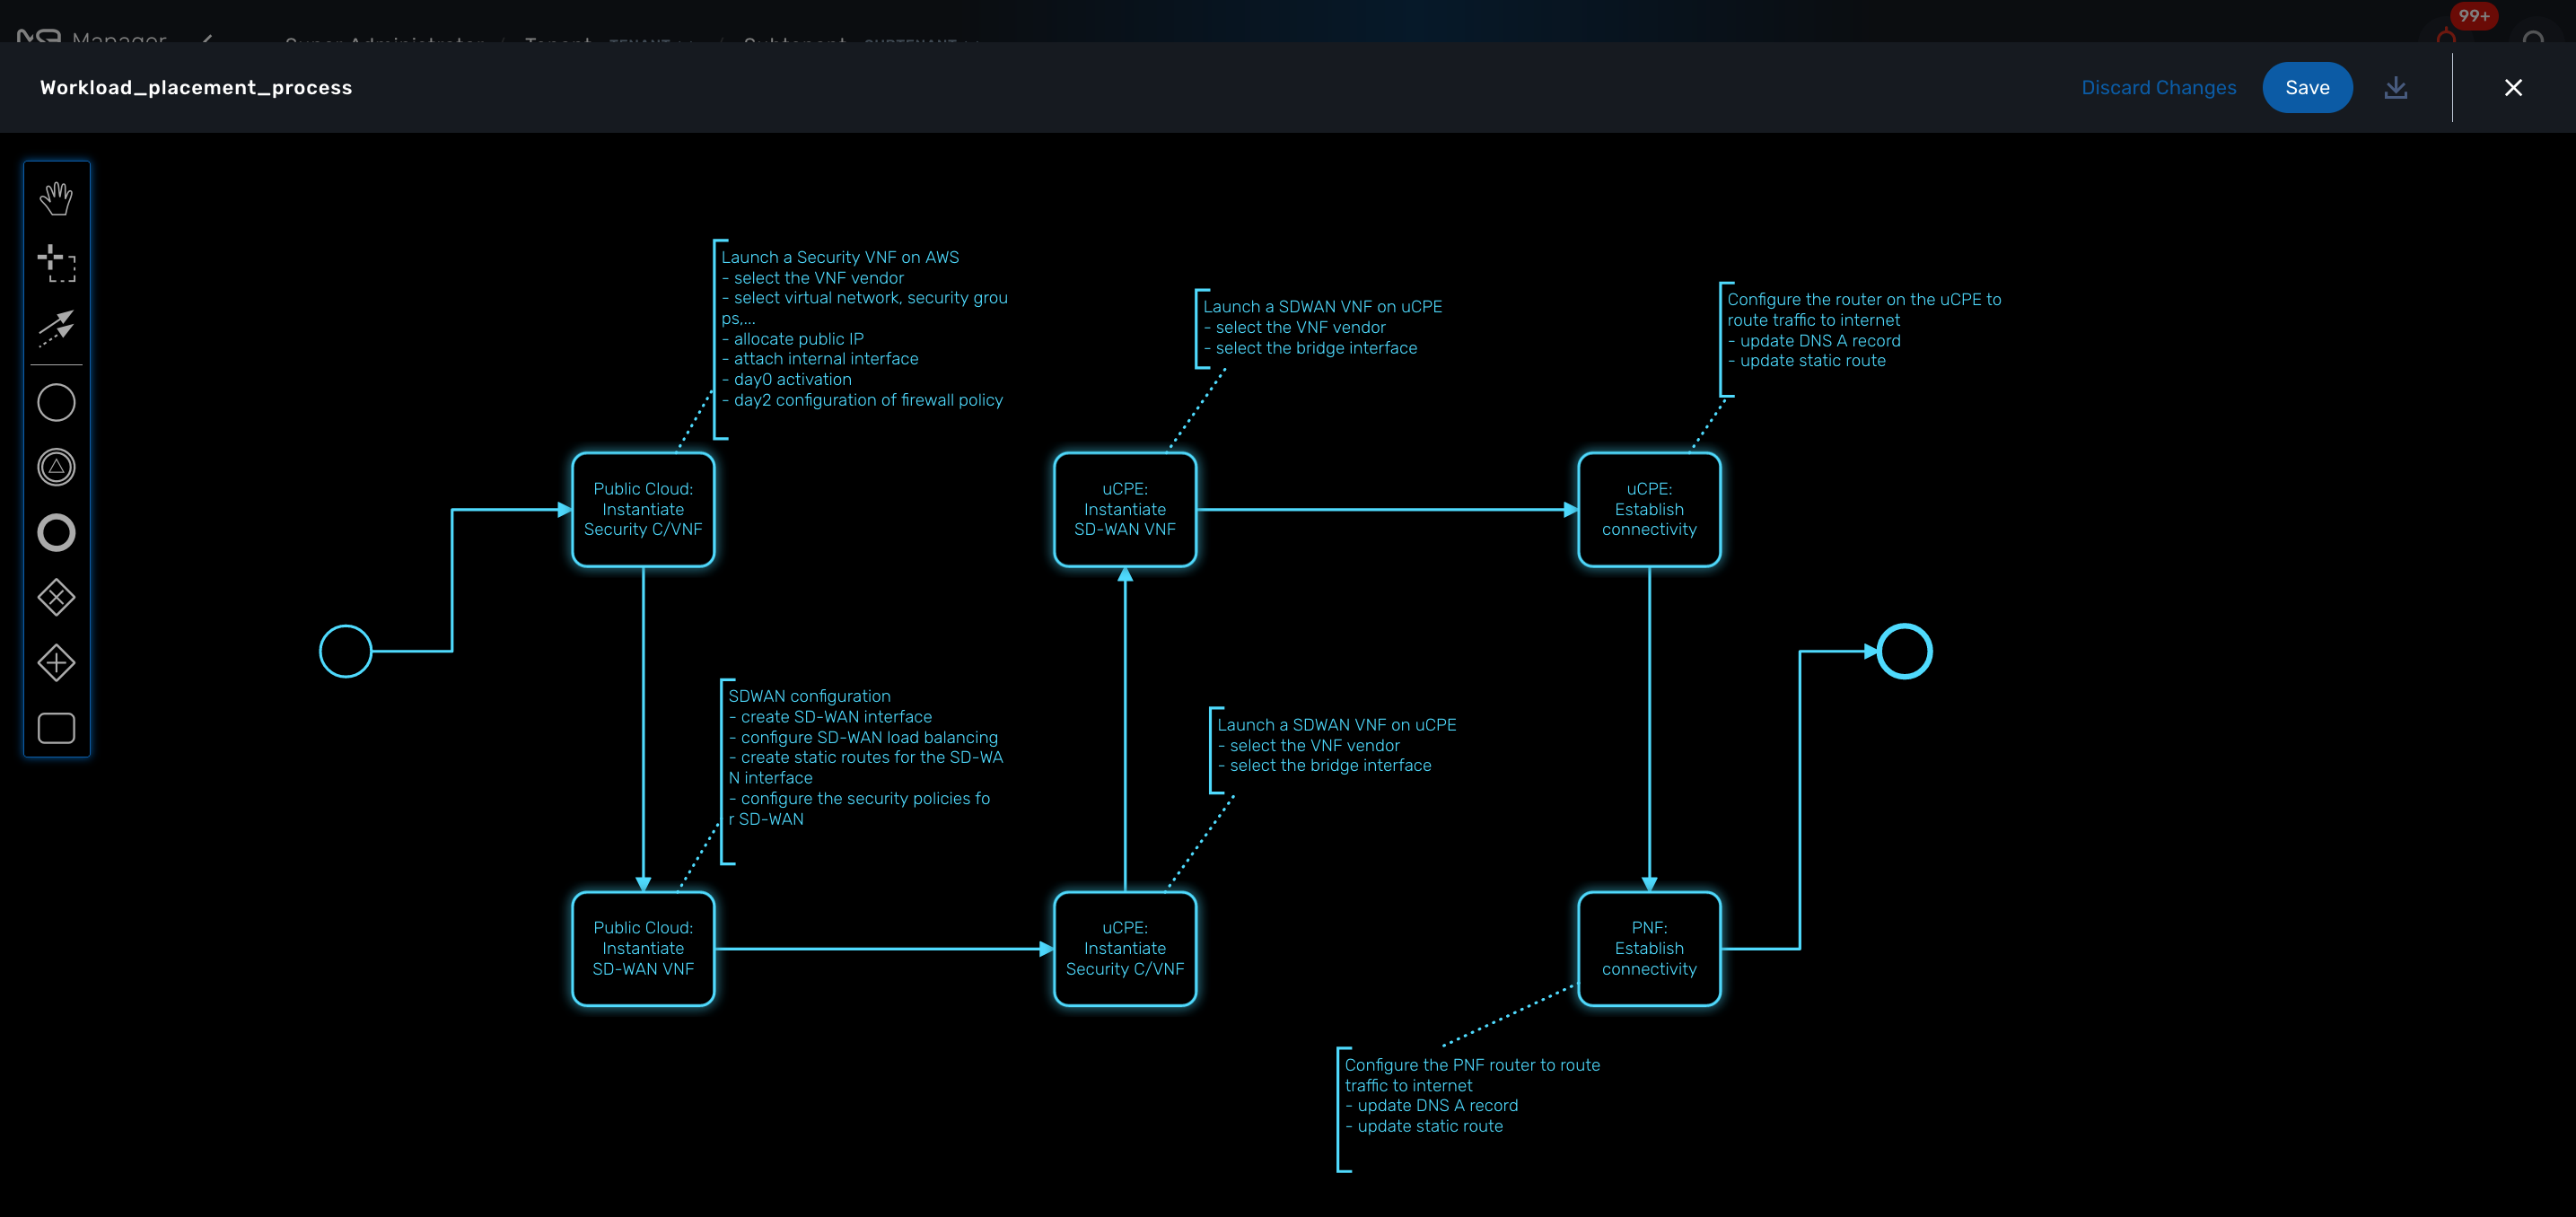
You can select a BPM by clicking on a name in the list and start working on your BPM.
Developer Dashboard
The developer dashboard in MSactivator™ is available when you chose to login as a developer. On this dashboard, one of the first things you will notice is the three vertical swimlanes:
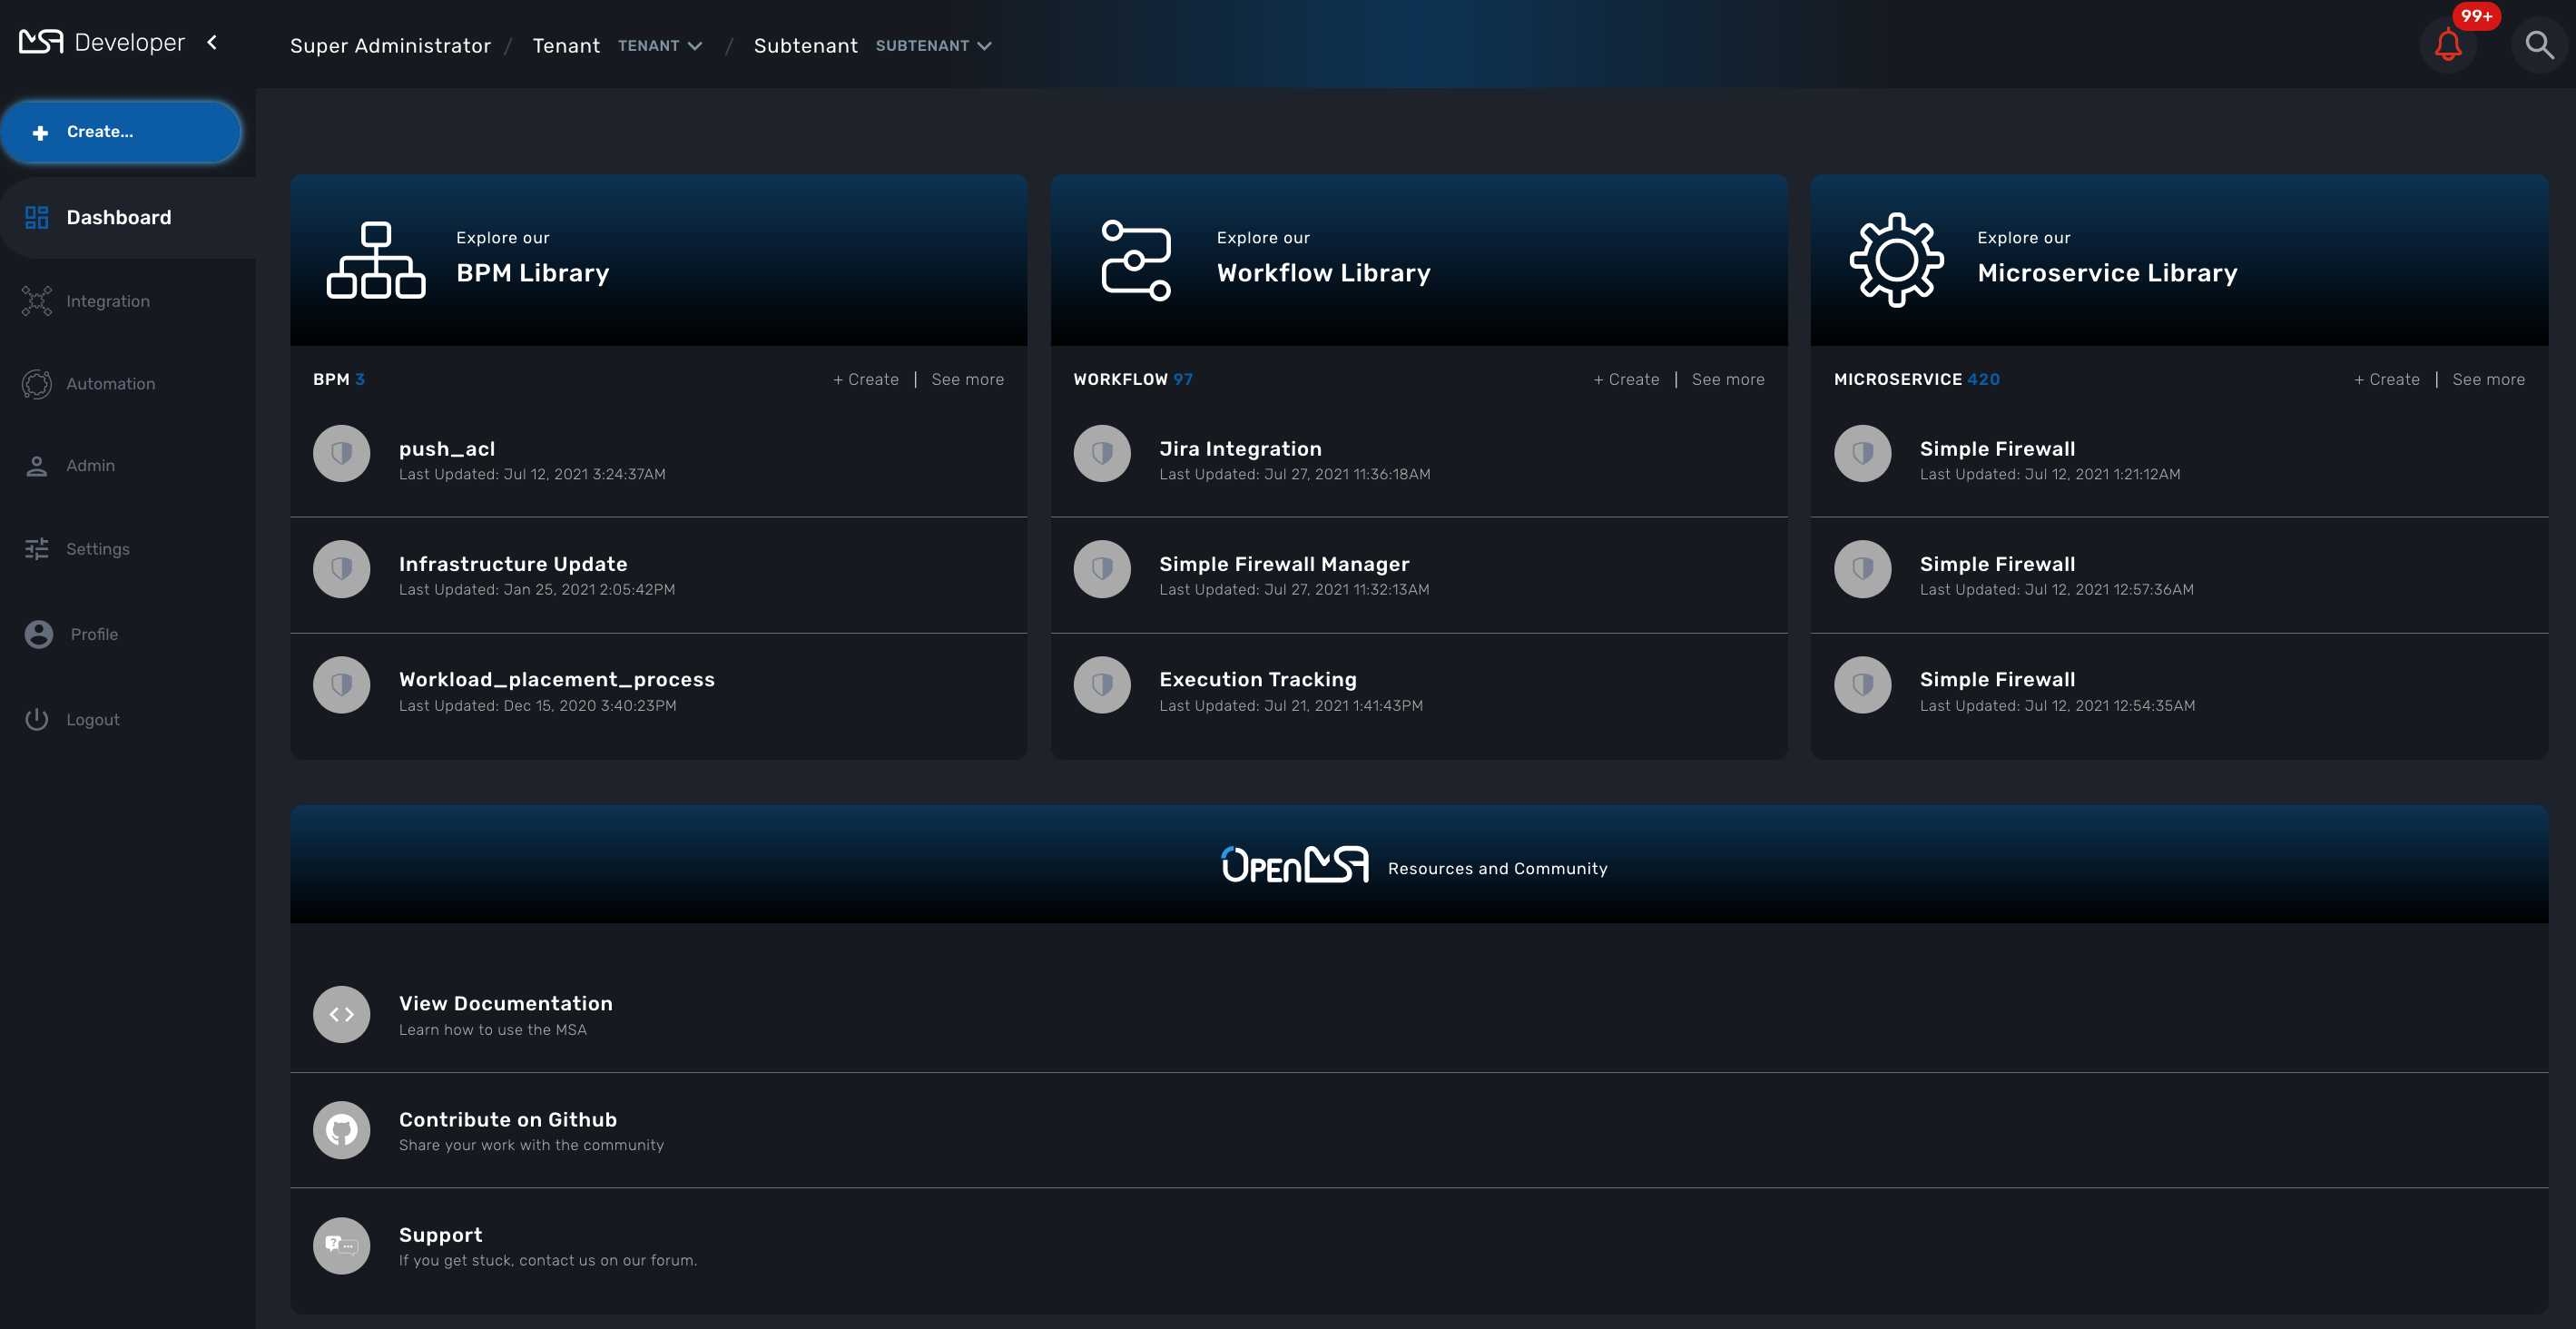
The three swimlanes match the three main layers of the MSactivator™ framework.
Workflow library
This is where you can develop new workflows for your application. In MSactivator™, workflows can be written in either PHP or Python. A workflow is a series of tasks that you can develop to carry out any set of complex tasks that you wish to automate via our orchestration engine.
Microservices library
This is where you can develop new microservices for your application. In MSactivator™, a microservice is a way to wrap commands (Create/Read/Update/Delete/Import) into a service, that can be invoked with a workflow or even from outside MSactivator™ via our REST API.
The microservices are typically used for managing the configuration of managed entities in an abstracted, vendor-neutral way.
Adapters library
This is where you can develop new adaptors for your application, or import existing ones. The adaptors are used to connect to managed entities from MSactivator™, regardless of the network protocols supported by the entity in question. If an adaptor is not already available for your entity vendor in the library, a new one can be developed.
Integration with Git
On the developer Dashboard, in the "Settings" menu, you can configure your remote repository where your library code is versioned.
Tenants and Users
The MSactivator™ platform provides a multi-roles and multi-tenancy hierarchy that should accommodate all your specifics requirement.
Overview
Tenant and user management screens are available in the "Admin" section of the MSactivator™ UI.
Initial connection
The MSactivator™ comes with one pre-created super admin user: ncroot (the equivalent of the root user on Linux systems). The default password for this user is "ubiqube".
This default password should be changed, especially if the MSactivator™ is meant to be used in a production environment.
Overview
The MSactivator™ has 2 levels of tenancy: tenant and subtenant.
These 2 levels will let you organize your managed entities based on your need will ensuring that access restriction based on the user role is fully respected.
4 user roles are available to make sure that you can assign the access and managing roles to your users based on their actual roles in your company.
Tenancy management
The MSactivator™ is designed to provide multi-tenancy. A tenant is a virtual private space that can be managed as an isolated environment.
There are two levels of tenancy, tenant and subtenant, the latter being nested in the first one.
Tenancy management is provided on the UI in the "Admin" section on the left menu.
Tenant
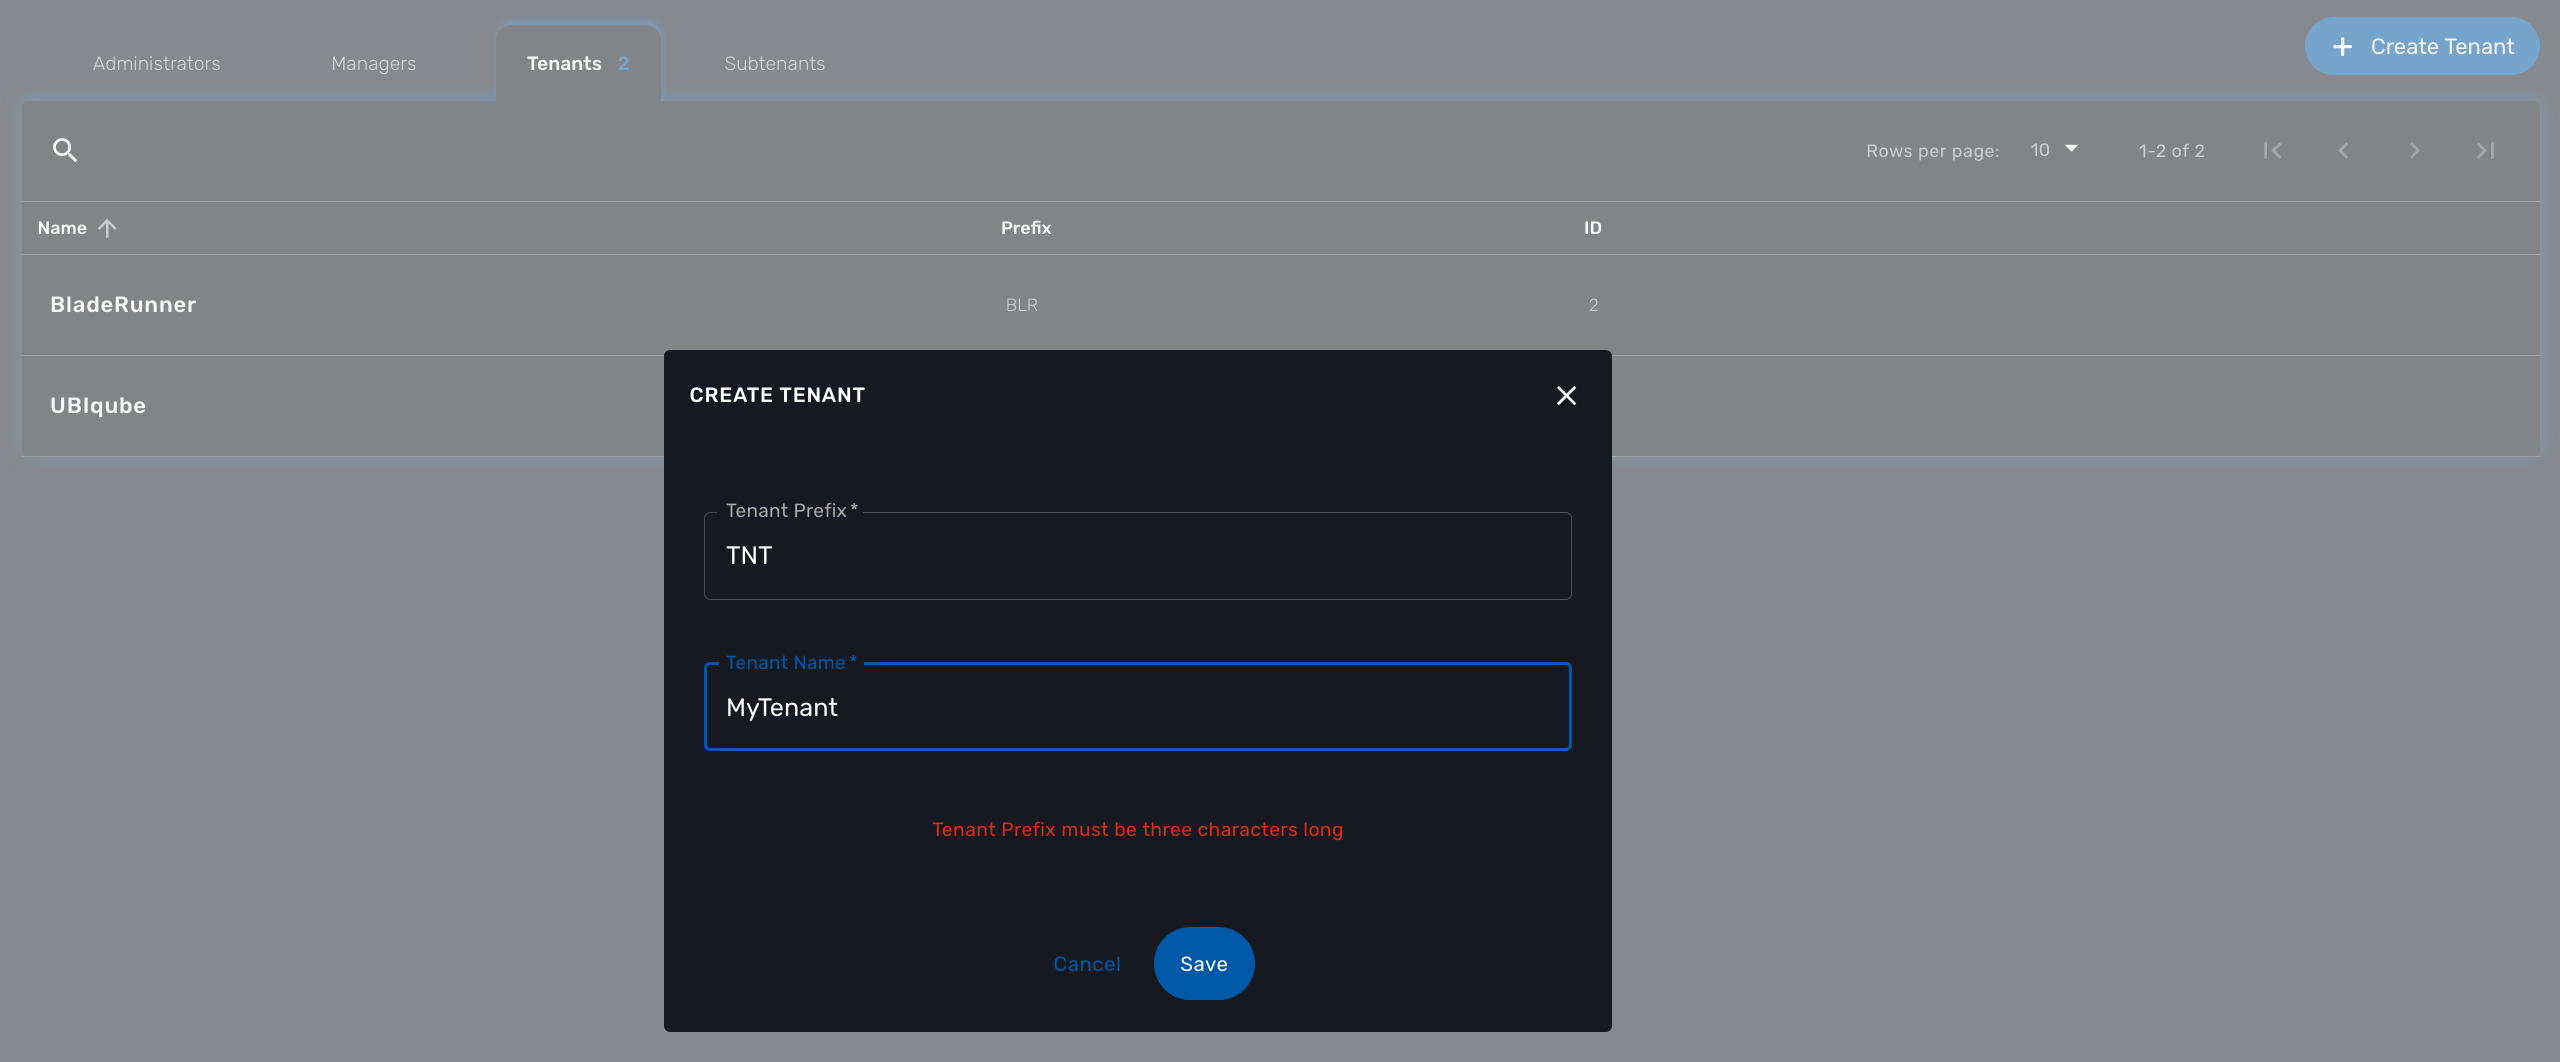
Select the "Tenants" section in the "Admin" menu and click on the "+ Create Tenant" button to create a new tenant.
The "Tenant Prefix" is a three letters, unique identifier for the tenant. It will be combined with the subtenant or the managed database identifier to build a short, comprehensive, unique identifier that you can use to filter application logs when troubleshooting or when you need to communicate with the support team.
Subtenant
Select the "Subtenants" section in the "Admin" menu and click on the "+ Create Subtenant" button to create a new subtenant.
Carefully select the tenant where the subtenant will be created as moving a subtenant to another tenant is not possible without database update.
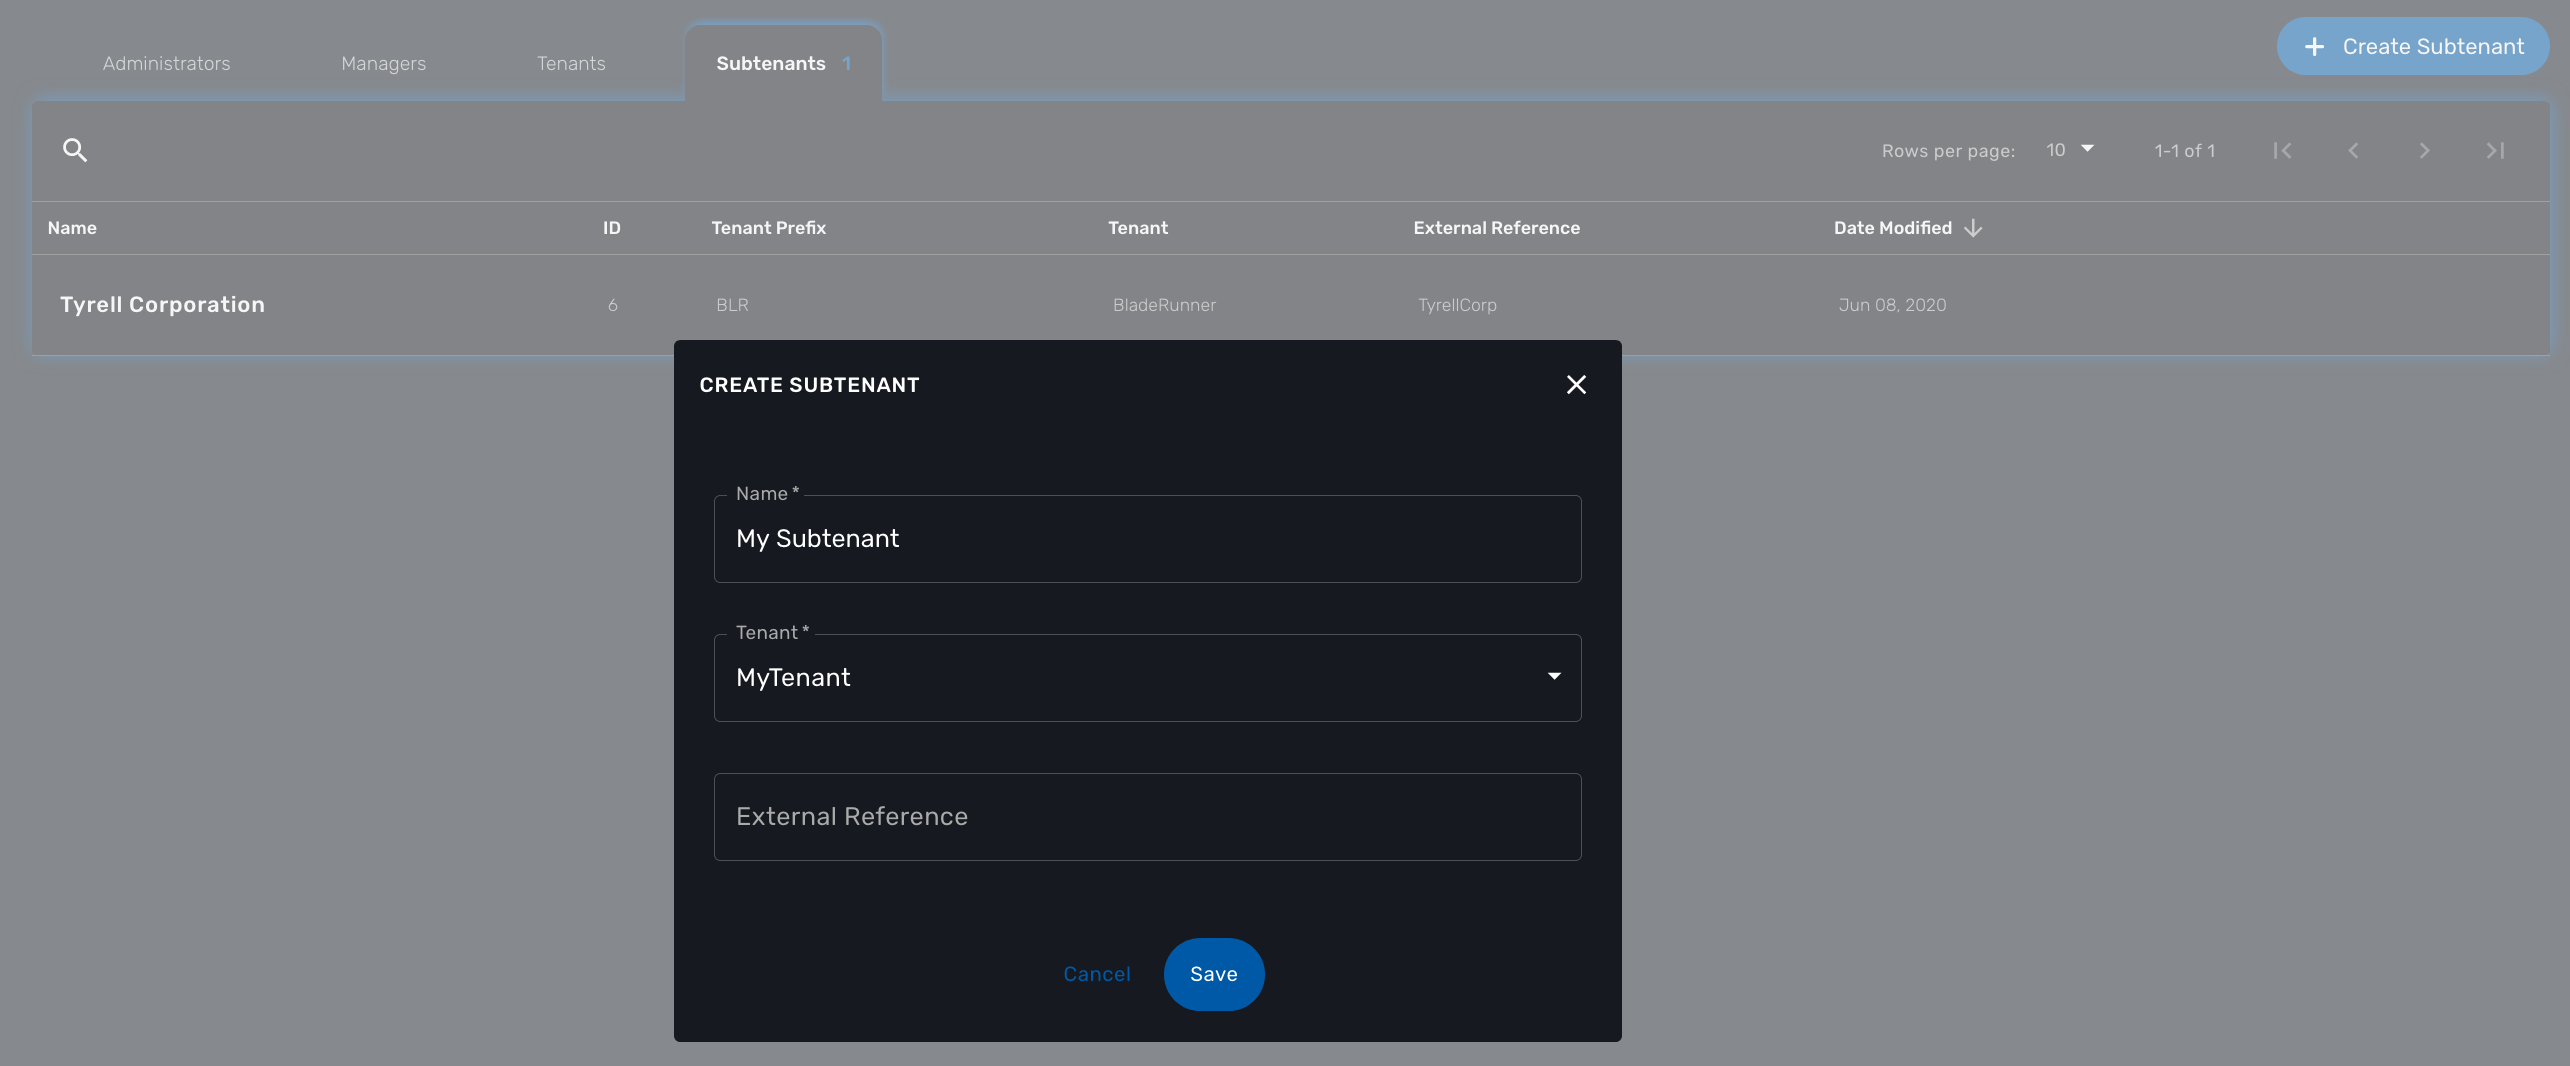
Save the customer form and navigate to the new subtenant tenant (click on the subtenant name in the customer list).
User management
Four types of users are available:
-
ncroot, the privileged administrator
-
the administrator users
-
the privileged manager users
-
the manager users
Privileged administrator (ncroot)
ncroot is the only predefined user within the MSactivator™. It’s the user with the highest level of privilege.
In addition to the action available to the other users with lower privileges, ncroot can create the tenants, upload and activate the MSactivator™ product licenses, create administrator users.
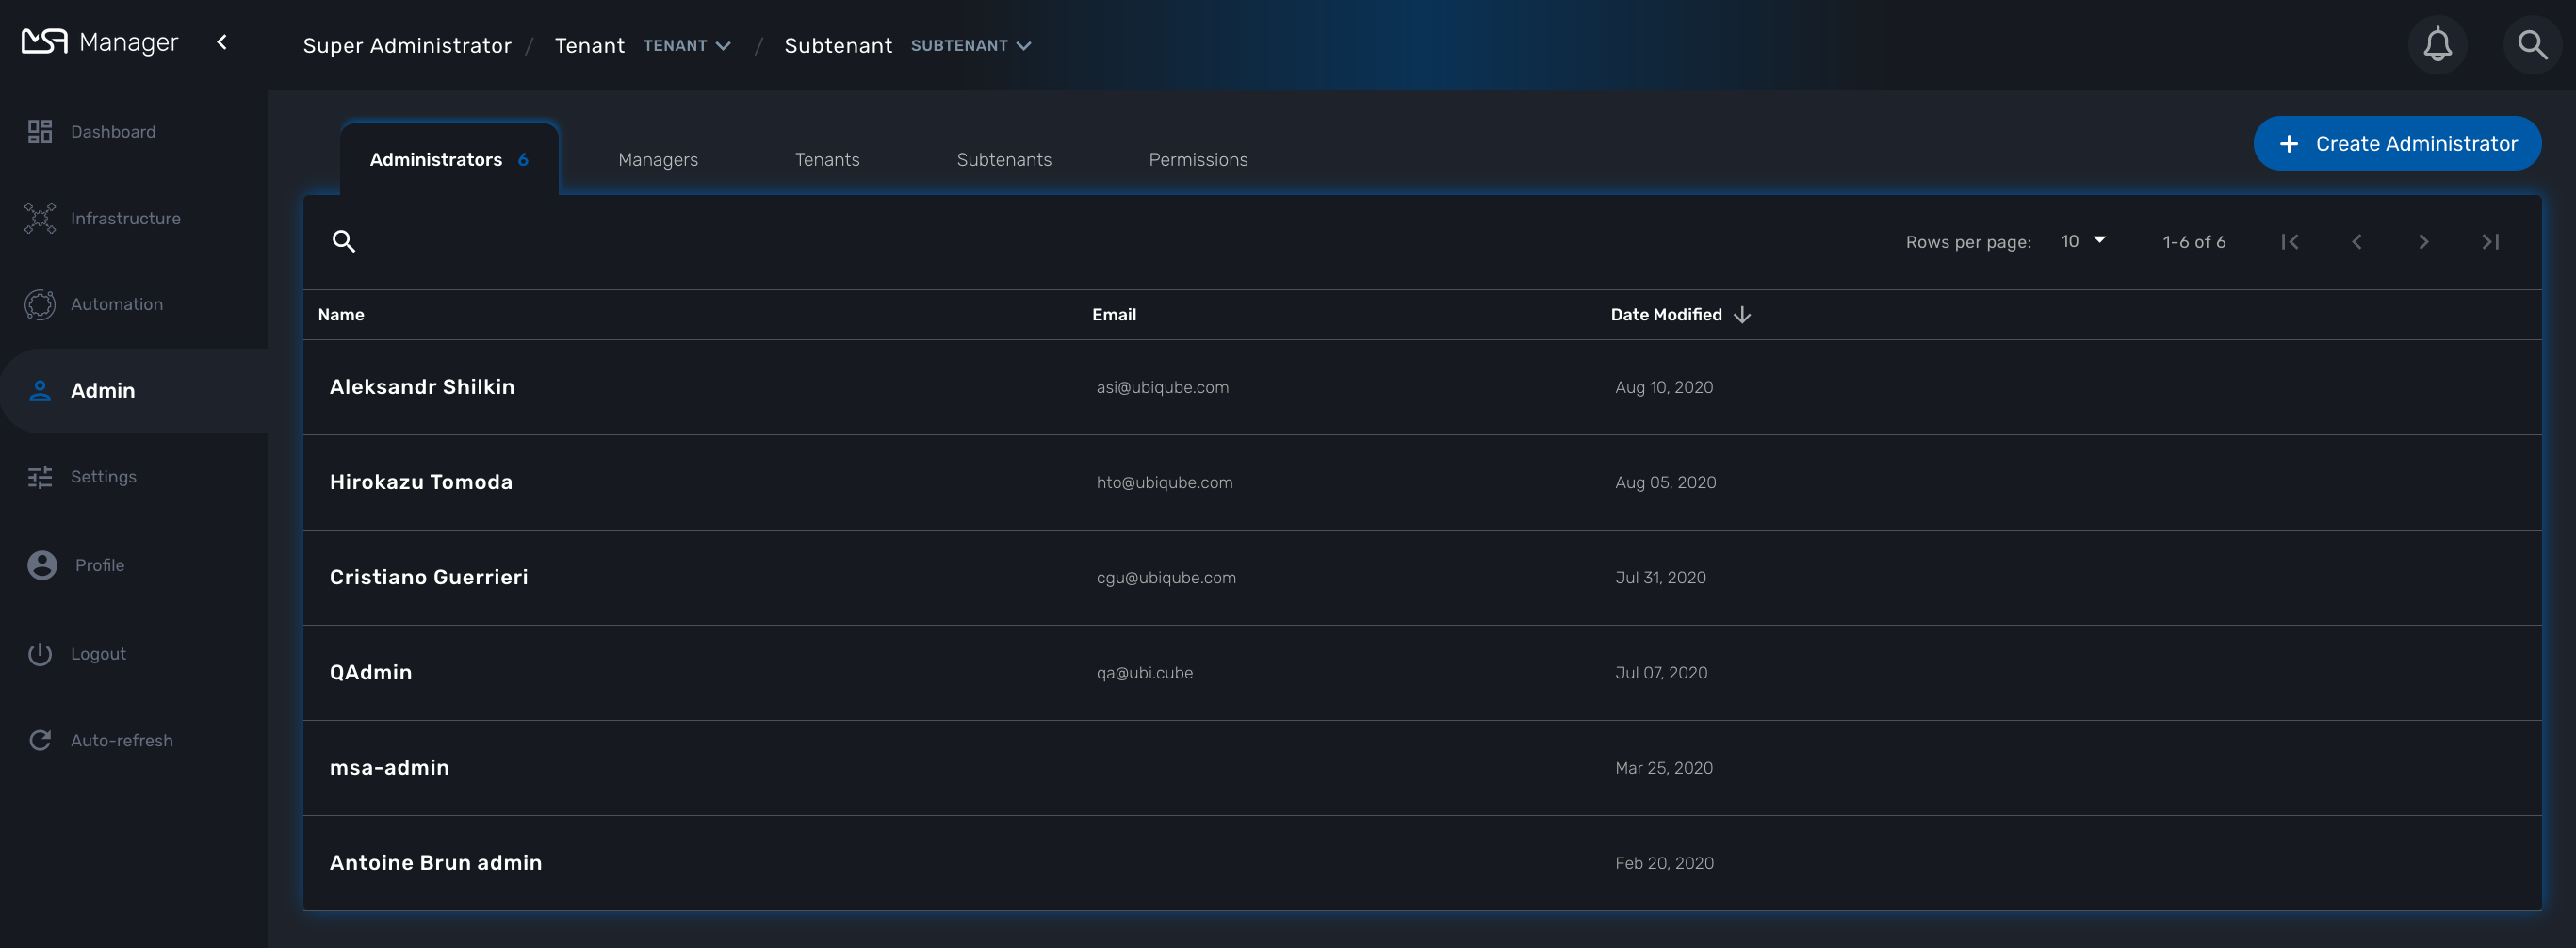
Administrator
Administrator users can only be managed by ncroot.
Administrators are associated with one or more tenants and have full access rights over these tenants.
A typical administrator job is to create the managers and privileged manager as well as the subtenant within its tenants.
Privileged manager and manager
Privileged managers are restricted to a single tenant.
Within their tenant, privileged managers have full access rights and can perform tasks such as subtenant management, device management, user and rights management.
Managers are restricted to a single tenant and, within this tenant, to a subset of subtenants.
By default, the managers have restricted, read-only access to the subtenant.
A manager may be used to provide self-care access to the MSactivator™ portal.
Roles and rights management : permission profiles
The MSactivator™ provides a simple authorization mechanism based on 4 user roles, the privileged administrator, the administrator, the privileged manager, and the manager.
By default, managers have a very restricted access to the data. They can only view the information of the subtenant and managed entities they are entitled to. In order to grant more rights to a manager, it is possible to use a permission profile.
A permission profile is an aggregation of rights such as "create a device", "activate a device", "configure a device",… that are turned on or off depending on your user management policy. This profile is applied to a set of one or more users.
You can create a permission profile as ncroot from the "Admin" section. Permission profiles are created in the scope of a tenant therefore you need to select a tenant to manage them.
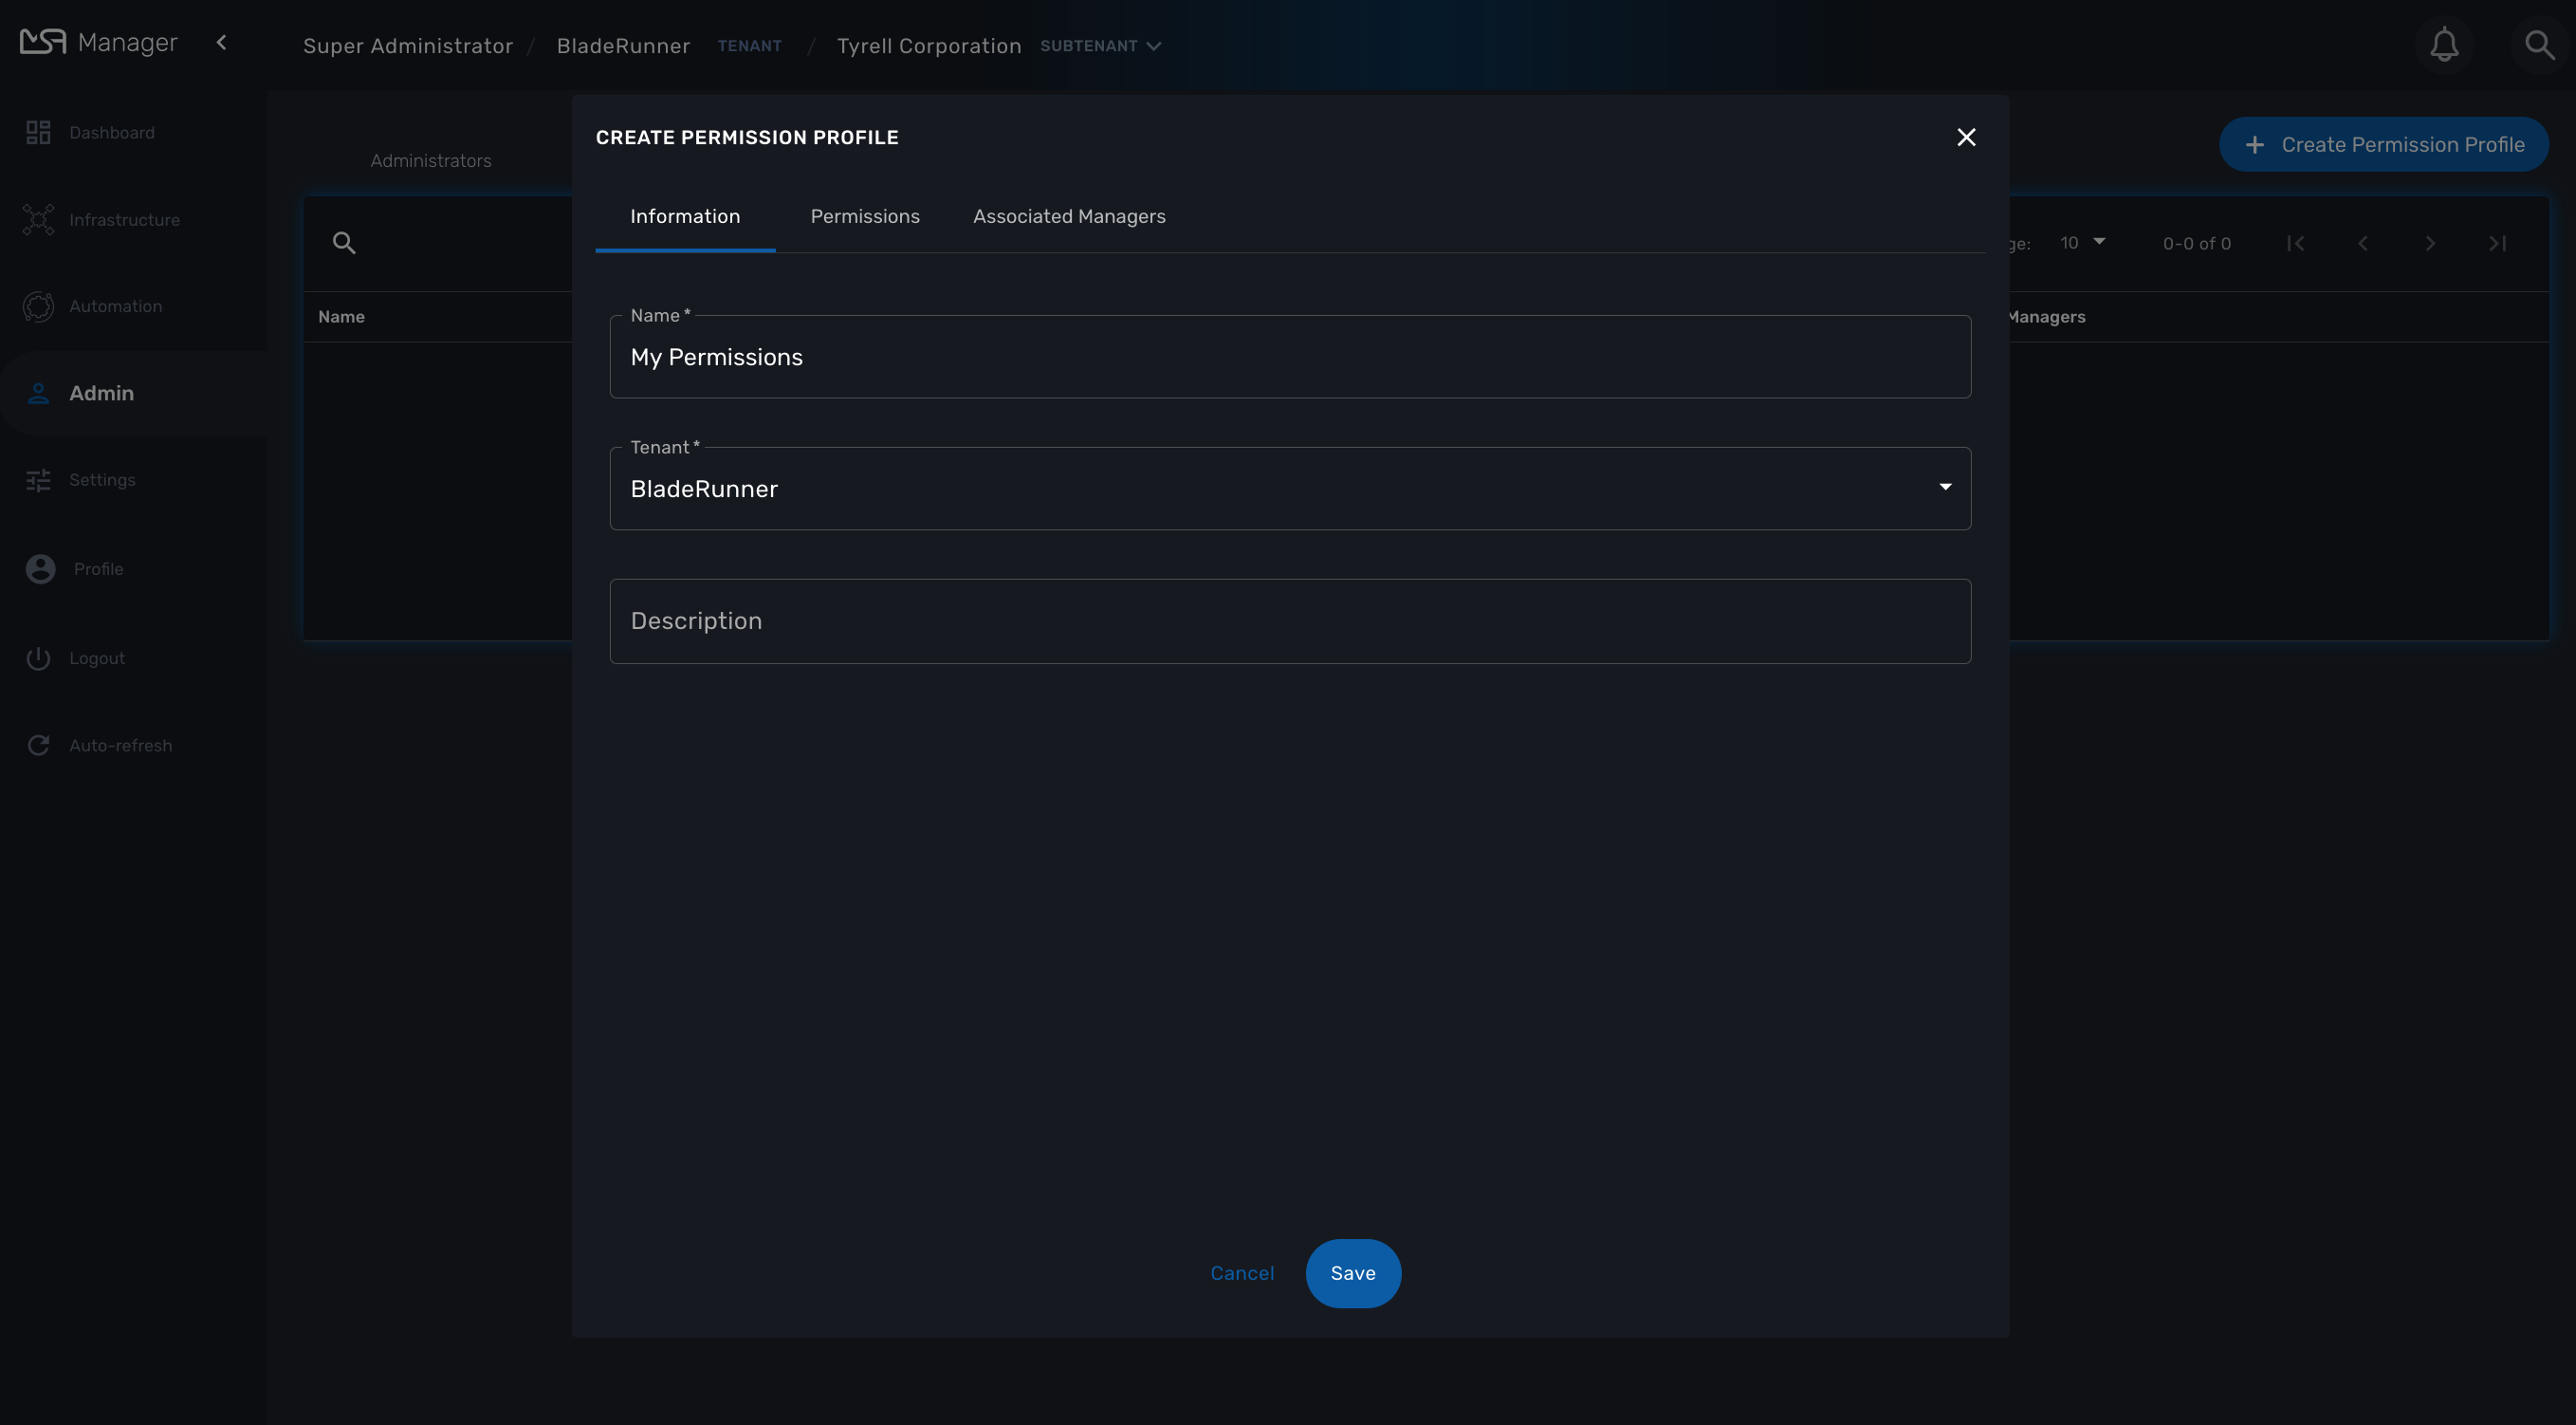
On the tab "Permissions" select the specific permission that you want to give to your managers
Permissions are organized by categories that reflect the MSactivator™ functional architecture.
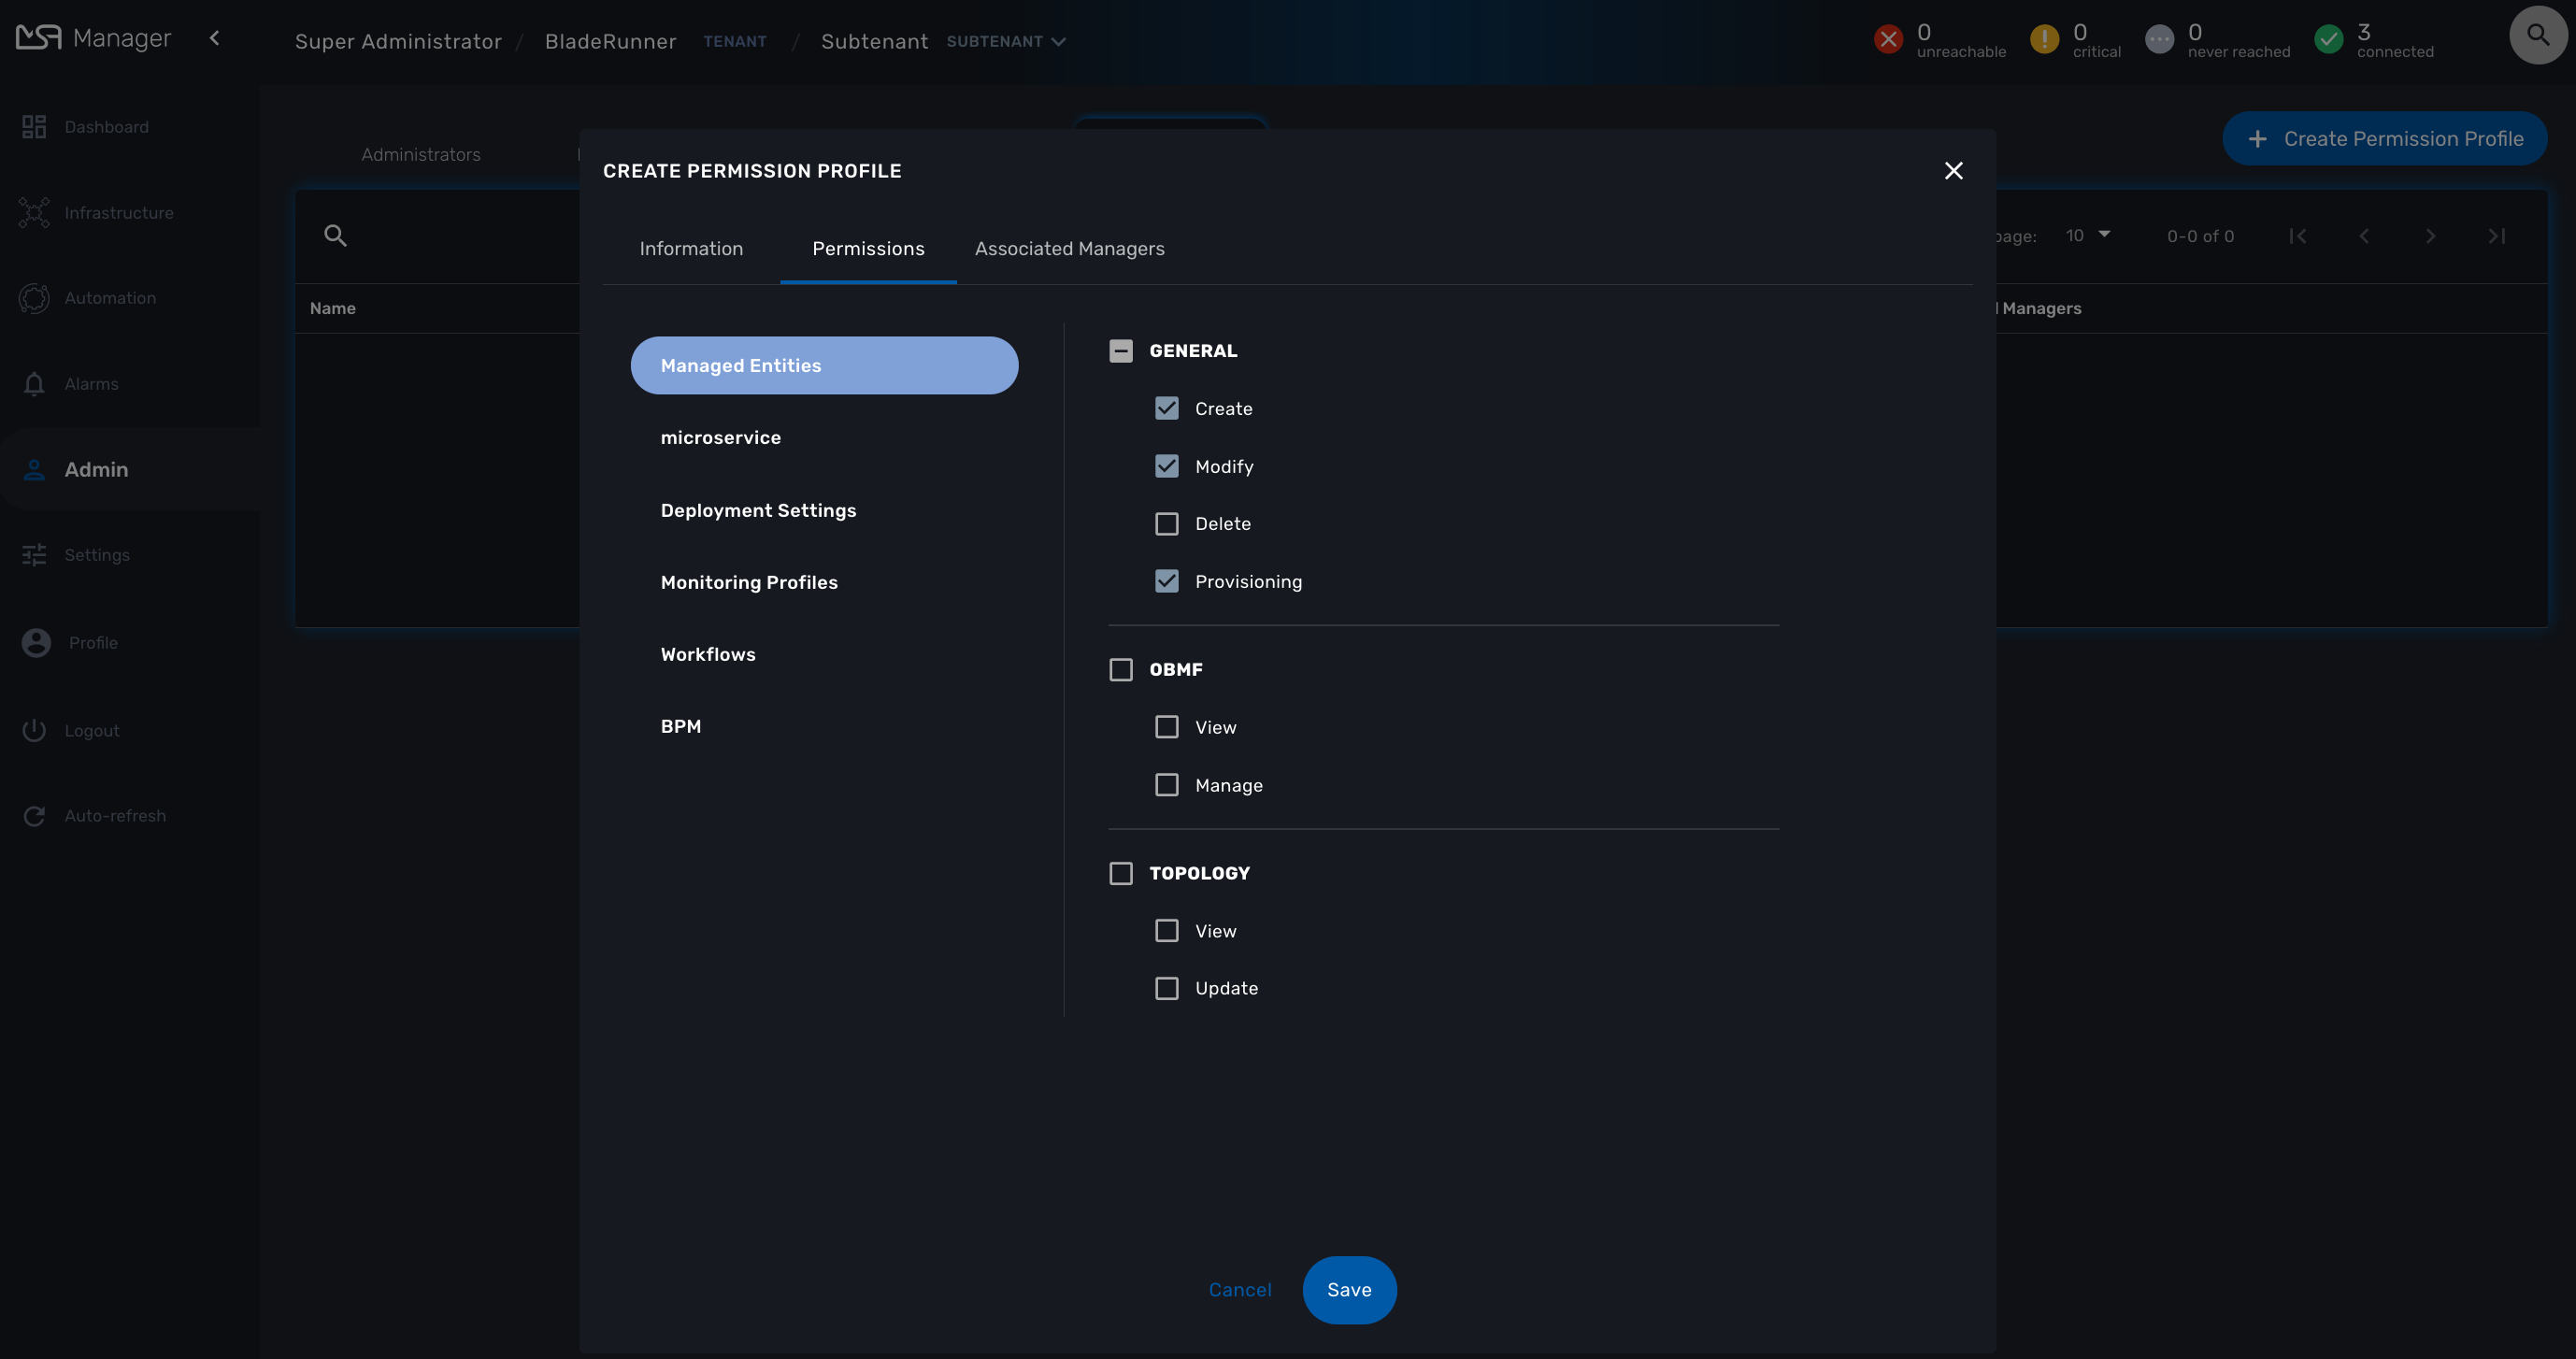
Assign the permissions to managers on the tab "Associated Managers"
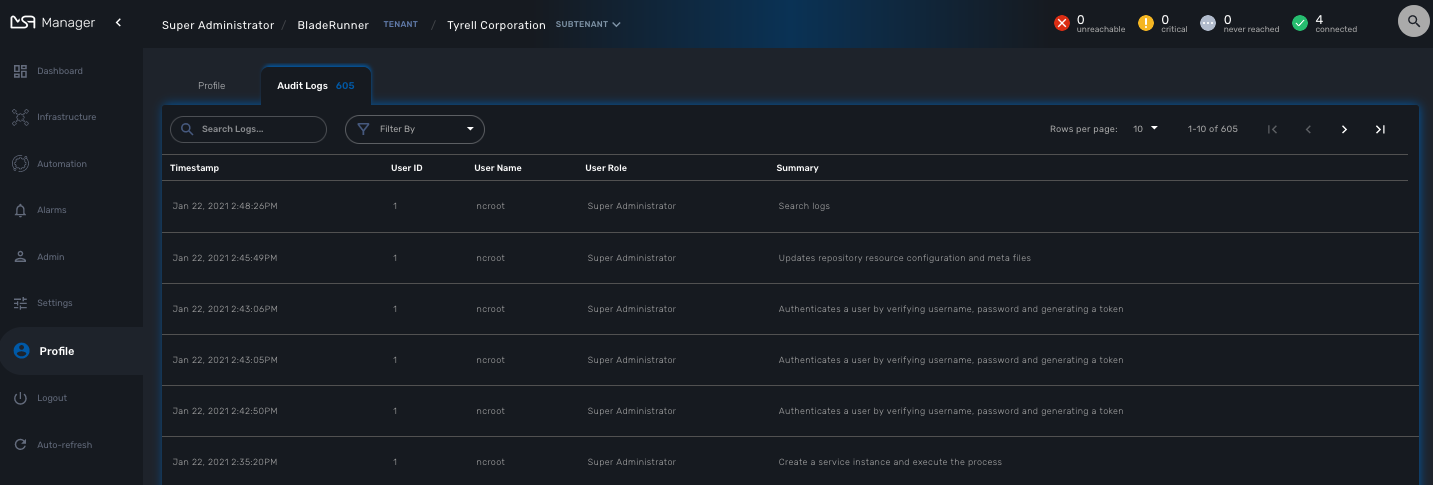
Audit record
The audit logs record every call to the MSactivator™ API, this includes user action on the UI and direct call to the REST API
    John logged in.
    John opened the Management dashboard.
    John applied sub-tenant filter "Hoth".
    John listed the workflows attached the to sub-tenant "Hoth".
    John executed the workflow "Create ME" on the sub-tenant "Hoth".
    ....
    John logged out.
The audit logs are available for each user in the "Profile" menu, under "Audit Logs".
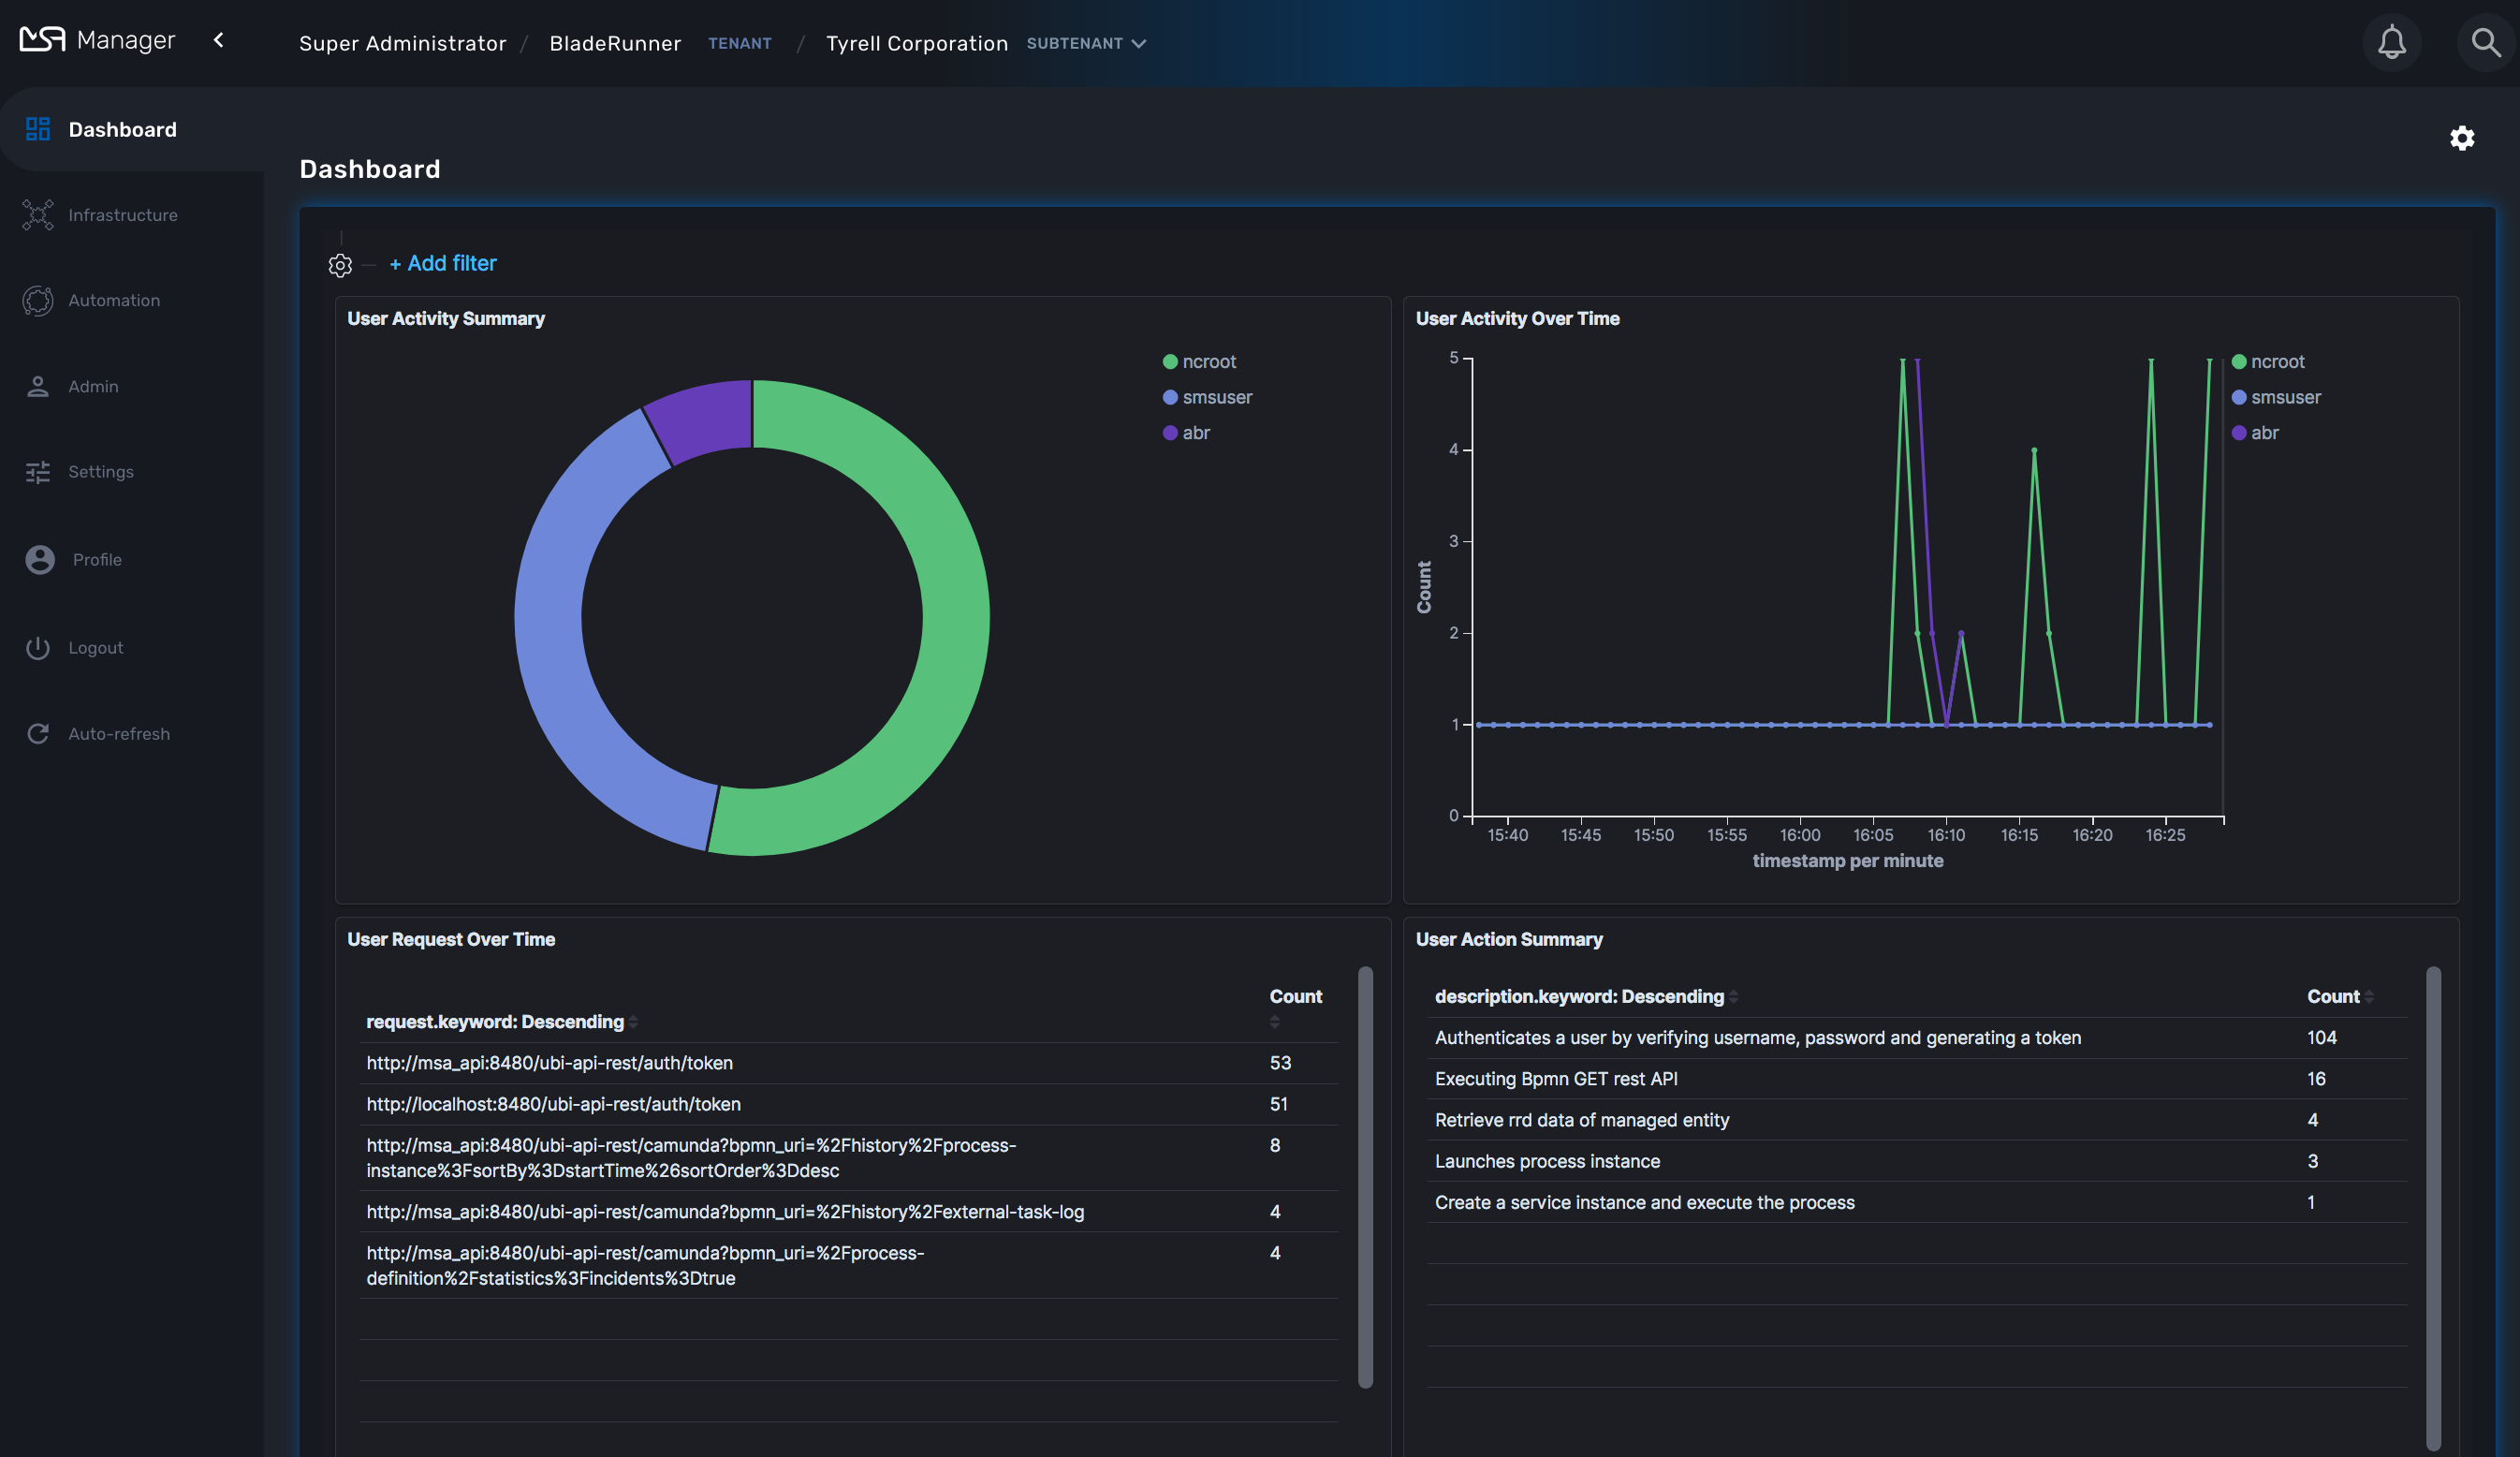
Since audit record are stored in Elasticsearch, you can use Kibana to design a simple user activity dashboard and display it in your super admin dashboard
Managed Entities
Managed Entities are the logical representation of any element of an infrastructure such as network devices, security devices, VNF, VIM,…
Overview
In order to become a manageable entity, an entity such as a router, a firewall or any other network function or element, physical or virtual, has to be created and activated in the MSactivator™.
These entities are managed in the "Infrastructure" section of the MSactivator™.
You can create a new managed entity or browse to an existing one and manage it.
This screen provides 3 types of view and you can switch between the detailed view, the compact view or the topology view.
Create, update and activate a managed entity
To create a managed entity, click the "+ Create Managed Entity" button on the managed entity screen.
This will bring you to the form to create a managed entity.
The fields marked with a * are mandatory to create a managed entity. If a tenant or customer is selected on the global filter, then they will be pre-populated in the form. Otherwise a tenant and customer must be selected.
The selections in the "Vendor" and "Model" fields will determine the fields displayed in the "Management Information" and "Advanced Information" sections. Different managed entity types have different associated variables that are used in their provisioning and operation.
| The selection of the vendor and model will determine the Adapter that will be used by the CoreEngine for configuration and assurance. It’s important to select an adapter that is compatible with the managed entity model. Once a managed entity is created, it is not possible to change the model, the managed entity will have to be recreated. |
The managed entity creation form can be closed by pressing the "X" button in the top bar. Any data entered into the fields will be preserved for when the user returns to the form. Clicking the "Discard Changes" button will display a confirmation prompt. If the user accepts the form state will be reset.
The update form can be accessed by clicking the pencil icon on the managed entity Listing page or on the managed entity Detail page.
Managed entity fields
These are the fields available when creating a managed entity. Some are mandatory and this is made explicit by the * on the web form.
| All of these values are stored in the database and available to use by the Microservices, the Workflow, the API and the Adapters. |
Tenant and subtenant
Only available when creating a managed entity, you can’t change this value once the managed entity is created. If you selected the wrong tenant or subtenant you will have to recreate the managed entity.
Basic information
This will select the adapter the MSactivator™ CoreEngine will use for configuring and monitoring the managed entity
The nature of the managed entity is an additional information that will help you organize your infrastructure into physical devices and virtual (private or public) ones
Administrative information
The name is a free text field that you can use to identify your managed entity.
| Although the value uniqueness is not enforced by the MSactivator™ data model, it is very common to use a hostname for the name field. |
Management information
This is the IP address the MSactivator™ will use to manage and monitor the entity.
| hostname or FQDN (Fully Qualified Domain Name) is not supported. |
You can optionally set the management interface name here. When set, the CoreEngine will attempt to use to poll the management interface traffic with SNMP.
The hostname of the managed entity.
The hostname is an optional field, it is used when syslog analytic is enabled for the managed entity in order to match the incoming syslog with a managed entity. It can also be used, if needed, in the adapter for various management reasons.
$network = get_network_profile();       (1)
$sd = &$network->SD;

$hostname = $sd->SD_HOSTNAME; (2)| 1 | read the managed entity data from the database |
| 2 | get the value of the hostname |
The management port is set to 22 by default and is used as is by most CLI command based adapters but for REST API adapters you’ll have to set it to the correct value.
Advanced information
Set the SNMP community configured on the actual managed entity.
Optionally set the monitoring port if it is not the default one (161)
Check to collect syslogs and optionally analyse the syslogs. The syslogs will be parsed and stored in the Elasctisearch cluster.
| log analytics must be enabled for SNMP trap monitoring. |
Provide the credential to authenticate to the managed entity.
The authentication is done at the adapter layer whenever it is required.
Managed entity activation
A managed entity can be activated by selecting "Activate" from the list of "Actions" at the top right of the managed entity screen.
This will show a form that takes the variables such as management IP, username and password that will be used in the activation. These fields may be pre-populated by the values given in the create form. If the variables are updated they will be used for that particular activation but will not be persistent.
When the activation is started the dialog shows the progress of the managed entity activation. This will update as the activation progresses and will show whether the activation succeeds or fails.
| the activation of the managed entity is executed by the adapter for this managed entity model. |
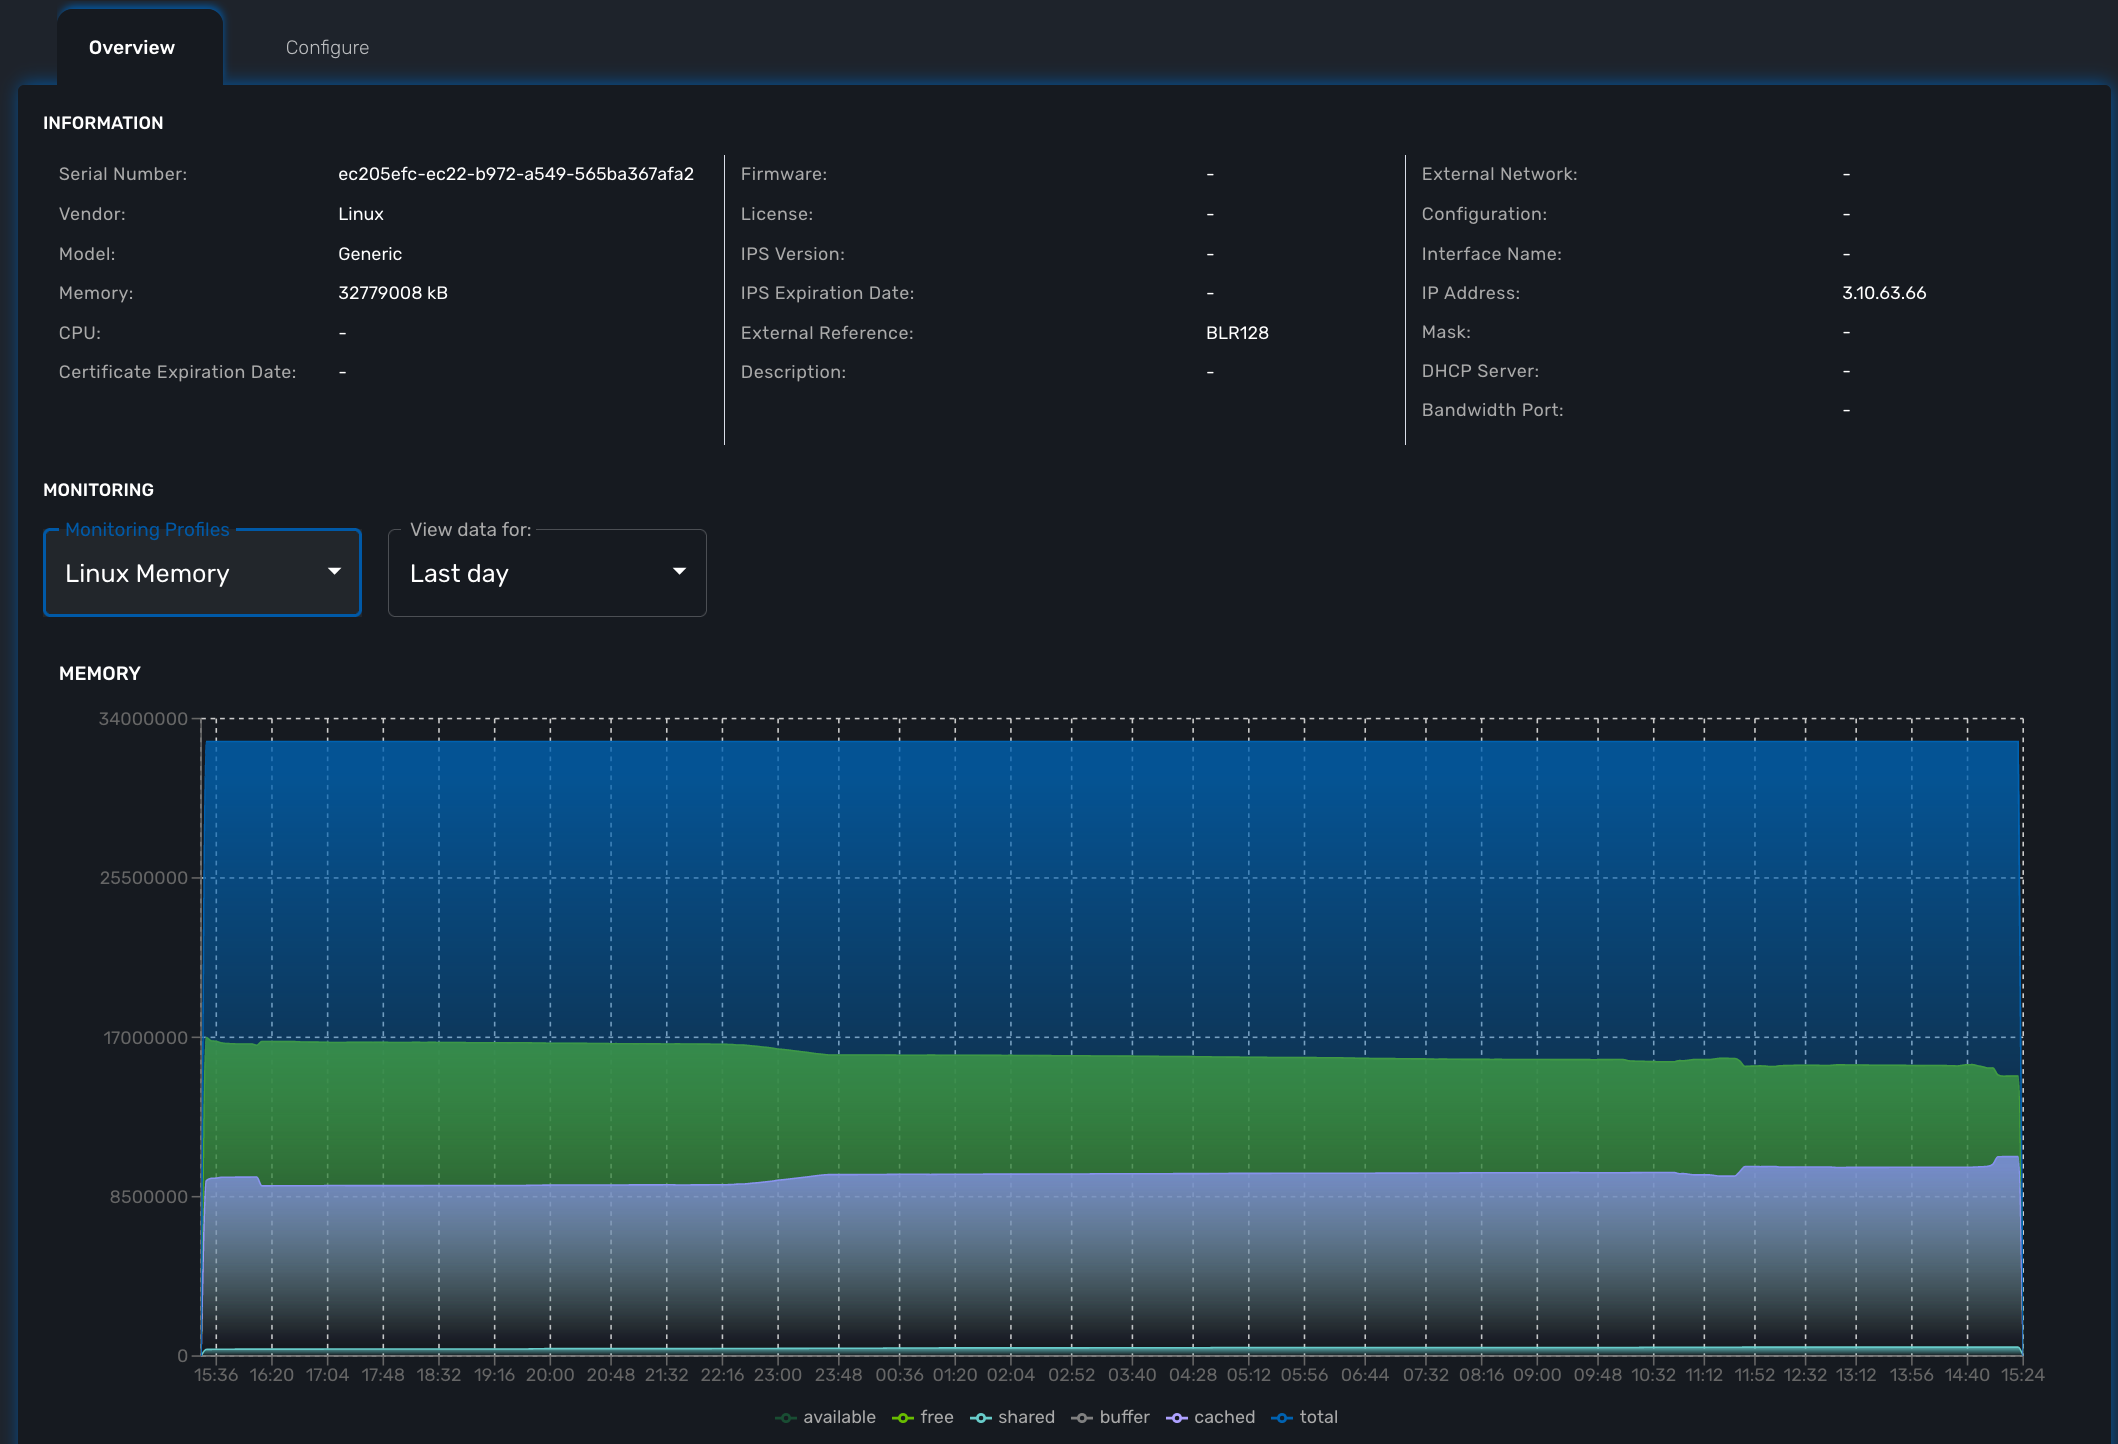
Overview screen
The overview screen is the main screen you will see when browsing to a managed entity
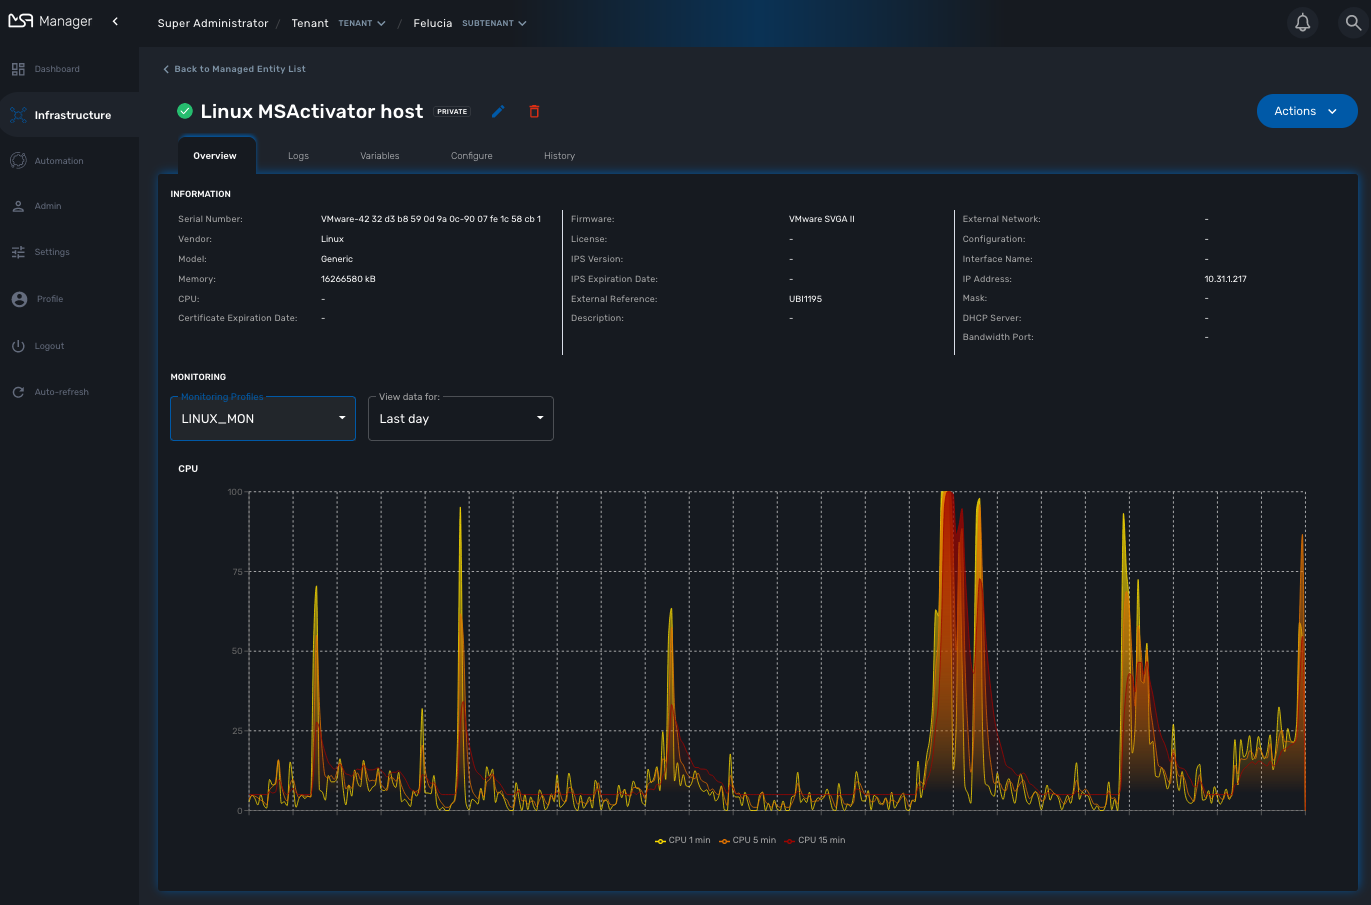
The managed entity overview screen is used to display the details of the selected entity.
You can reach this screen either by searching for a managed entity with the search field at the top right of the screen, or by selecting an entity from the managed entities list.
Asset information
The information such as the serial number, firmware, memory … are retrieved dynamically by the adapter once the entity is activated.
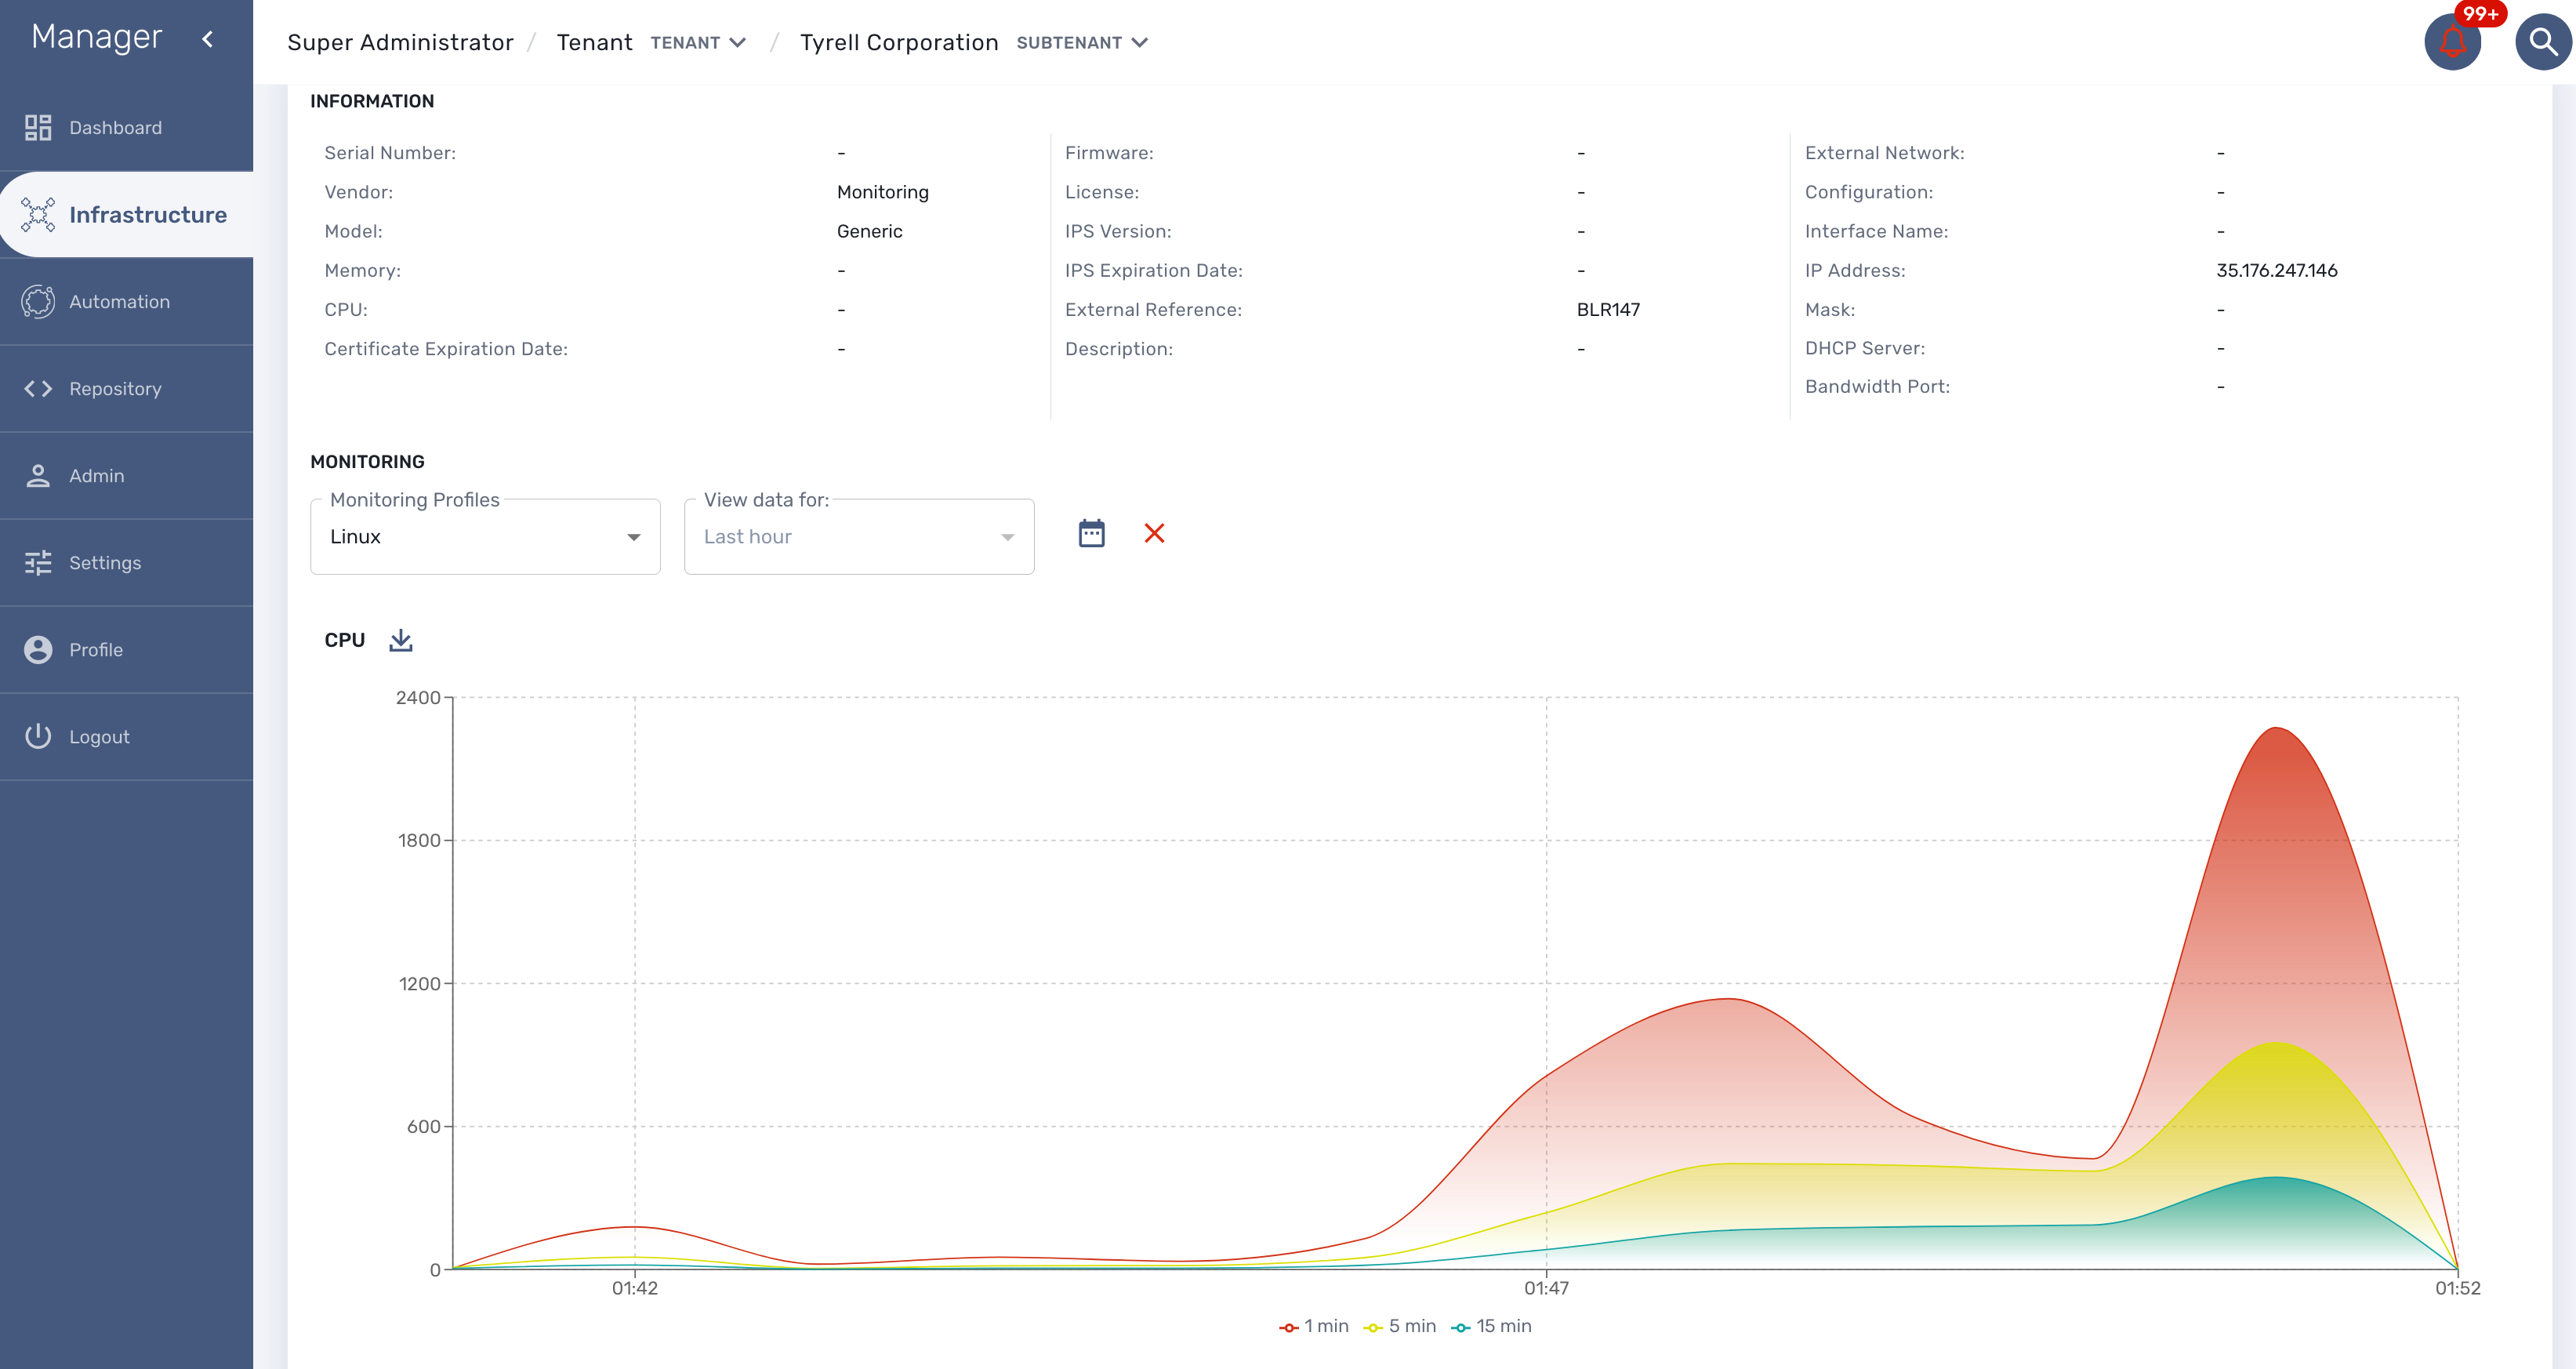
Monitoring information
By default there are 3 graphs that are displayed in the monitoring section of the overview screen:
-
the availability of the managed entity
-
the sysuptime of the managed entity
-
the network traffic of the management interface
Availability
A graph, based on ICMP requests (1/min) issued by the CoreEngine container msa_sms to the management interface of the managed entity, shows the latency and TTL information.
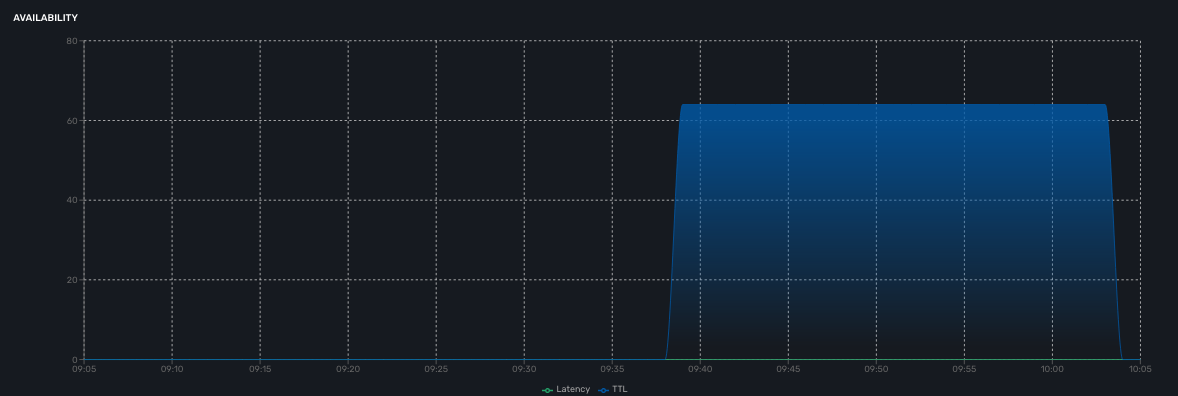
When the connectivity fails, a event VNOC-1-IPDOWN is generated by the CoreEngine and indexed in Elasticsearch log index.
An alarm can be configured based on this event.
When the connectivity is restored, a event VNOC-1-IPUP is generated and can also be used to generate an alarm.
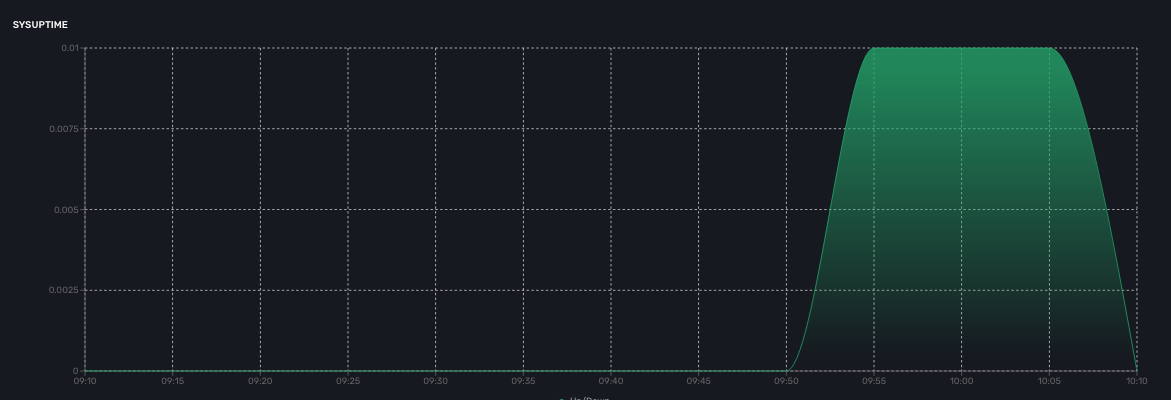
Sysuptime
The sysuptime (System Uptime) is collected by the CoreEngine with SNMP. You need to allow SNMP requests on the managed entity and configure the SNMP community for the managed entity.
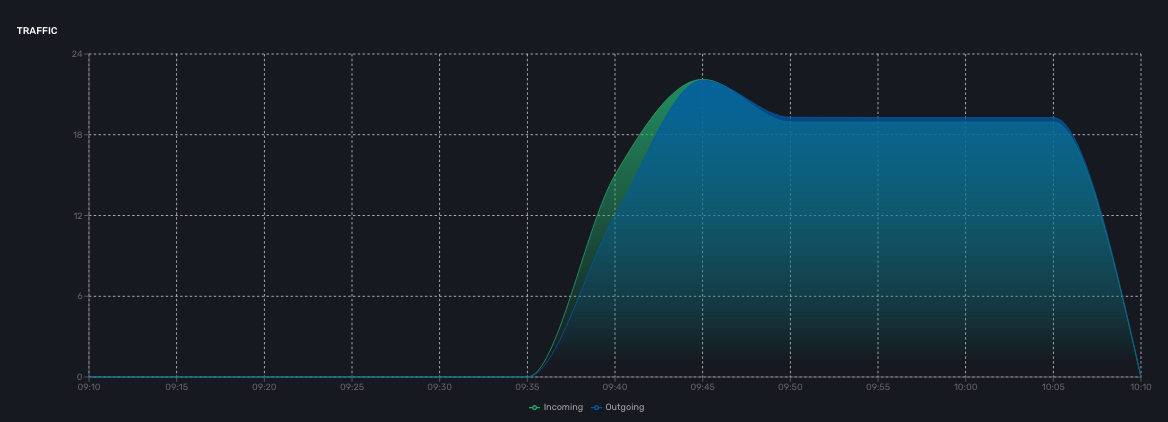
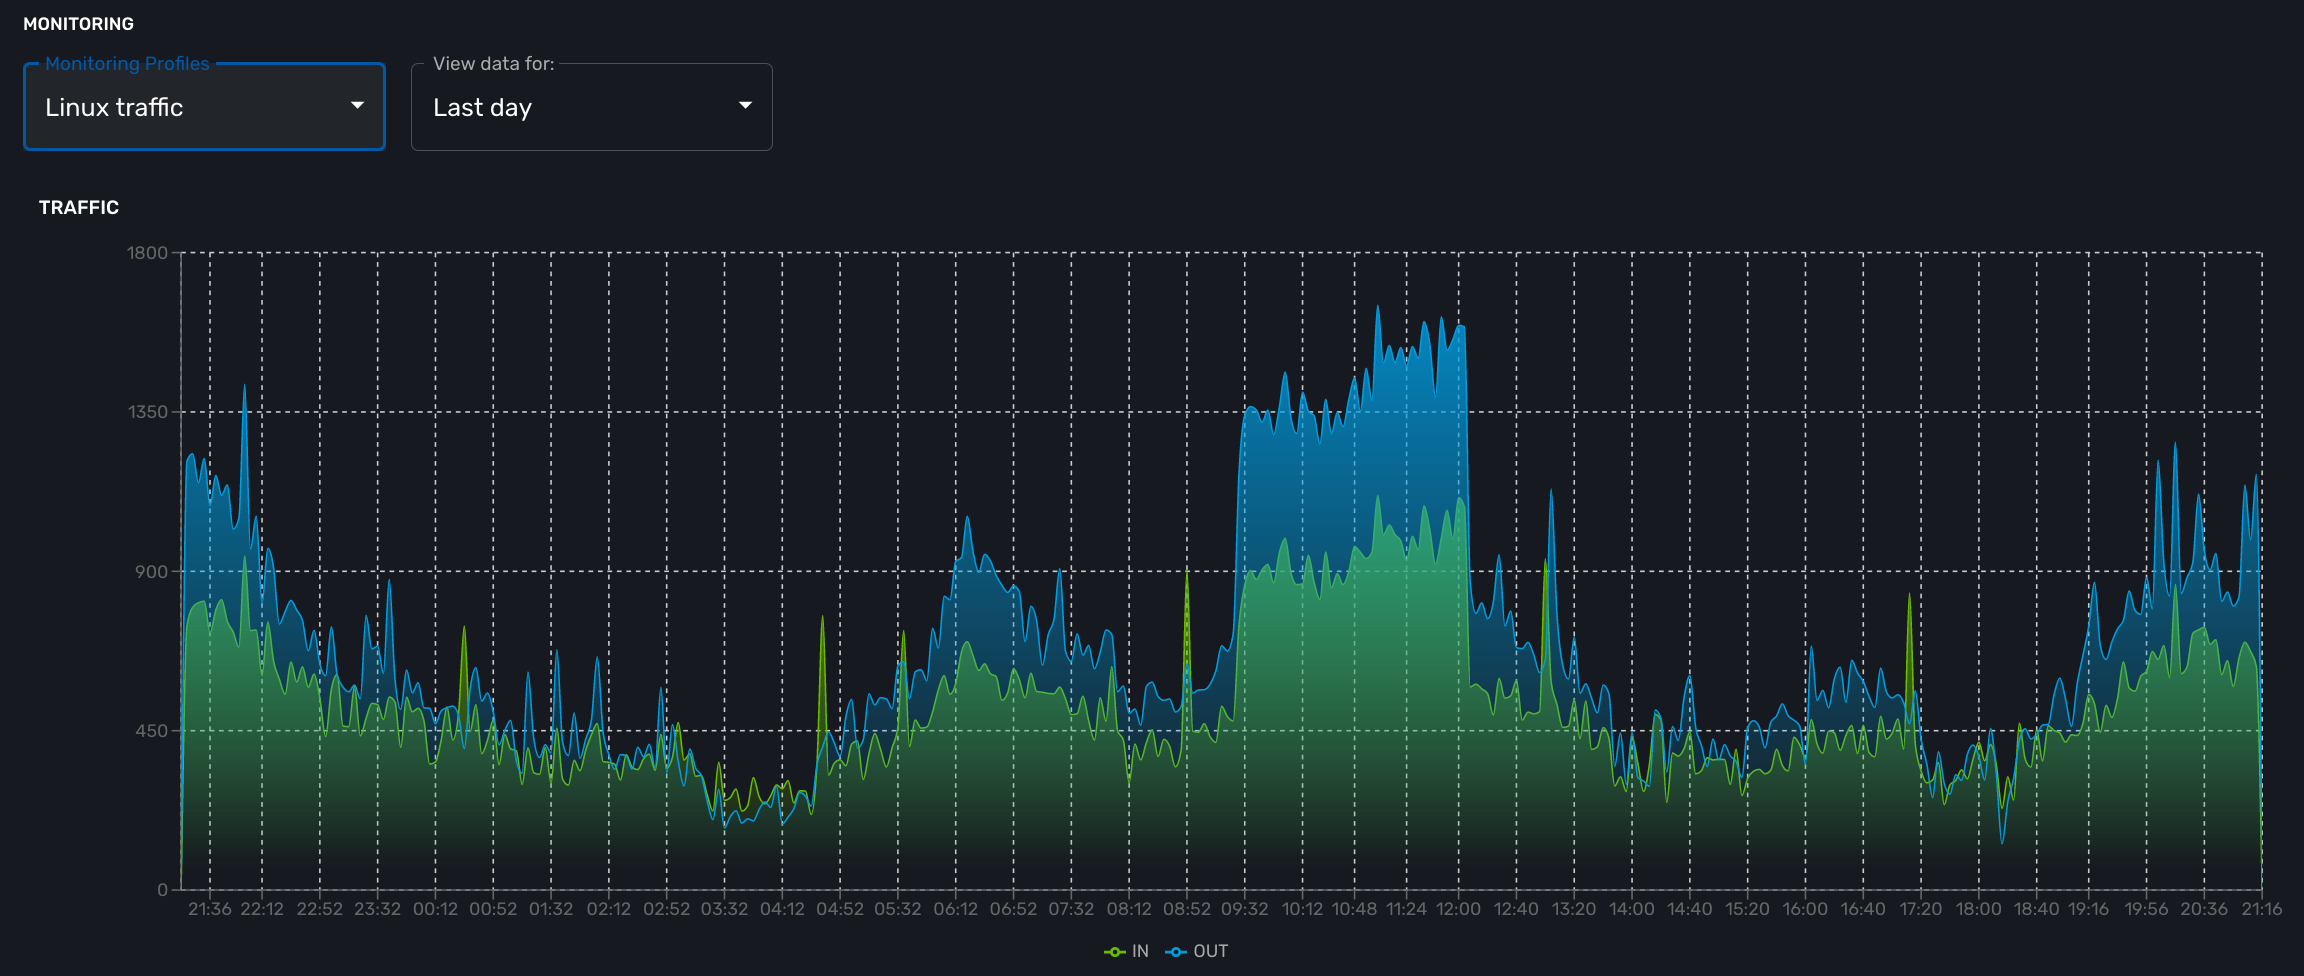
Traffic
The ingress and egress traffic of the management interface may be automatically collected provided that you have configured the management interface name in the managed entity configuration form.
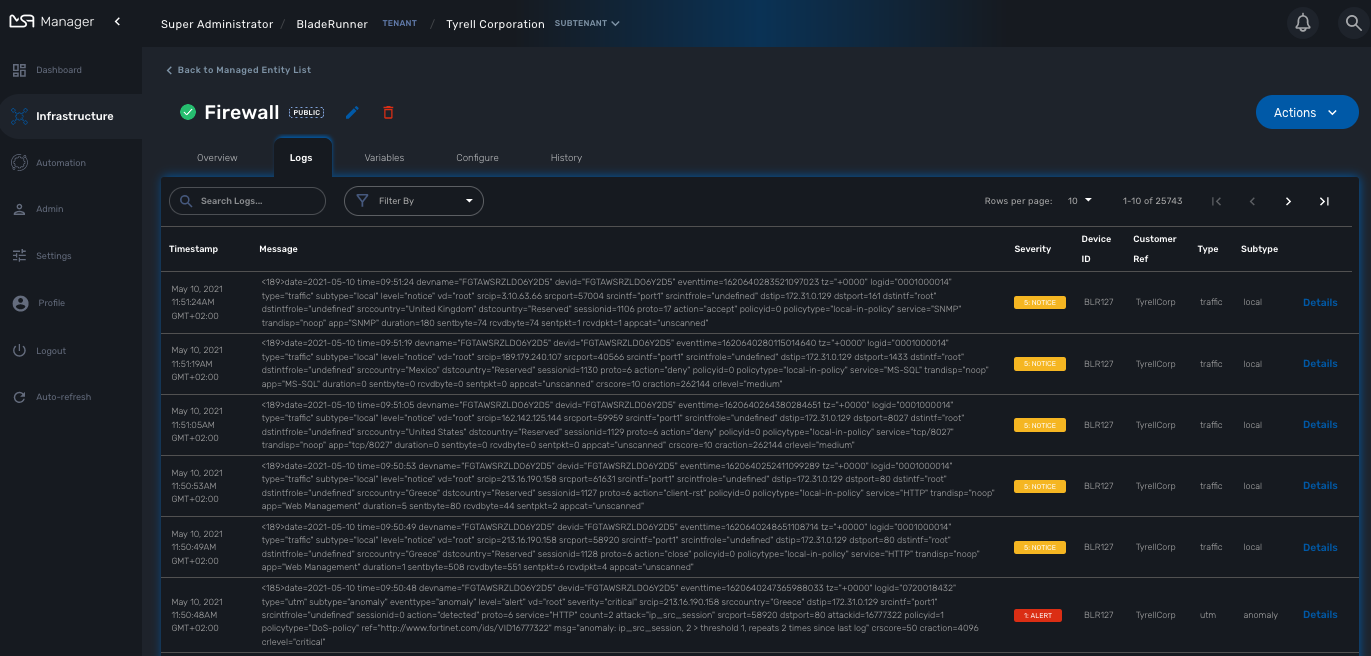
Logs
Logs, internal events and threshold crossing events are listed in the tab "Logs"
In order to view and search for the syslogs, you need to activate syslogs collecting and log analytics in the managed entity configuration form. You also need to make sure that the actual managed entity is properly configured to send it’s logs to the MSactivator™
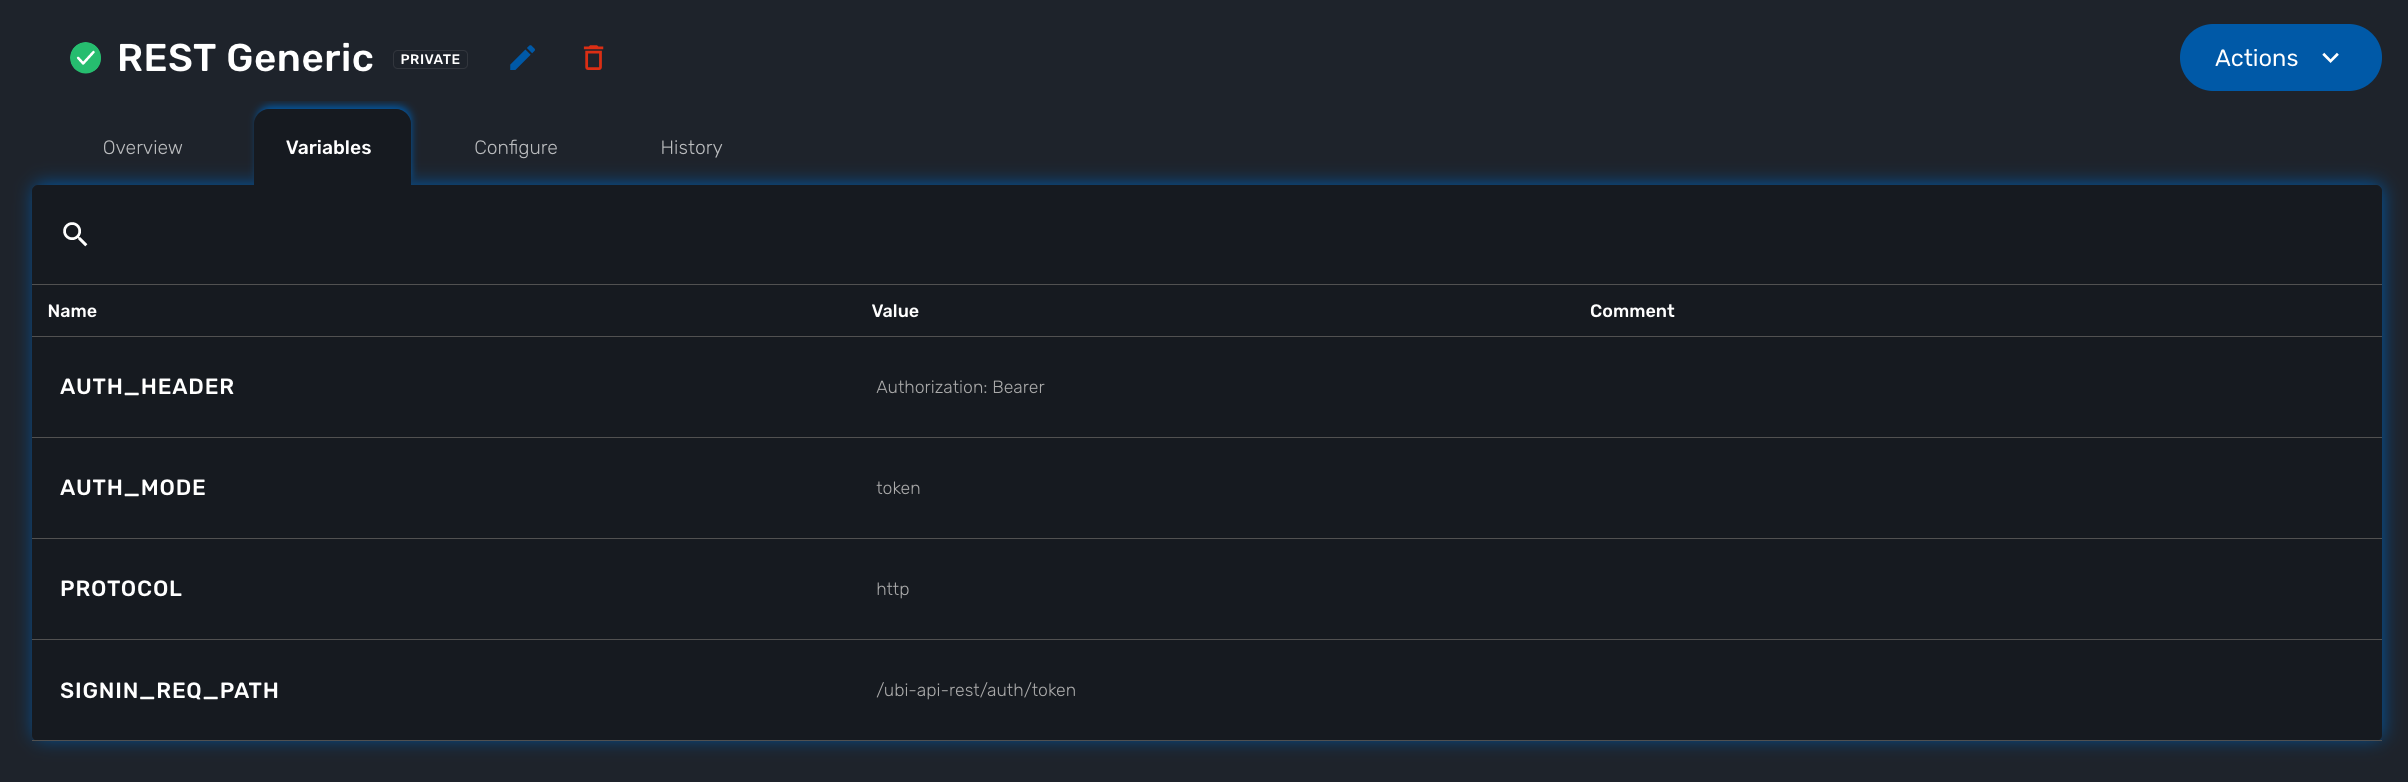
Configuration variables
In addition to the UI fields, it is also possible to create custom additional configuration variable to a managed entity. Configuration variables offer a convenient way to extend the data model of the managed entity without any core product customization.
A configuration variables is a key/value couple stored in the database, associated to a managed entity.
Once a configuration variable is set on a managed entity, it is available to the microservices and the device adapter but it can also simply be used to add additional administrative information to a managed entity.
To create a configuration variable, click on the "Actions" menu on the top right of the managed entity screen and select "Create Variable".
The REST generic adapter uses configuration variables to customize its behavior and adapt itself to the various type of REST API (BASIC auth vs. Token auth, HTTP vs. HTTPS,…)
$network = get_network_profile();       						(1)
$sd = &$network->SD;

if (isset($sd->SD_CONFIGVAR_list['PROTOCOL'])) {
	$protocol = $sd->SD_CONFIGVAR_list['PROTOCOL']->VAR_VALUE; 	(2)
}| 1 | read the managed entity data from the database |
| 2 | get the value of the configuration variable PROTOCOL |
In a microservice, you can reference any configuration variable with the syntax {$CONFIG_VAR_NAME}.
In a Import function, you can use a configuration variable to make the command to run on the device more flexible.
sho access-lists ACL-CUST{$CUSTOMER_REF} (1)
| 1 | make the name of the ACL depend on a configuration variable CUSTOMER_REF |
To read or set these configuration variables, you can use the REST API GET /variables/{deviceId}/{name} and PUT /variables/{deviceId}/{name}. This is useful for all your integration use cases or you can use the workflow from the library.
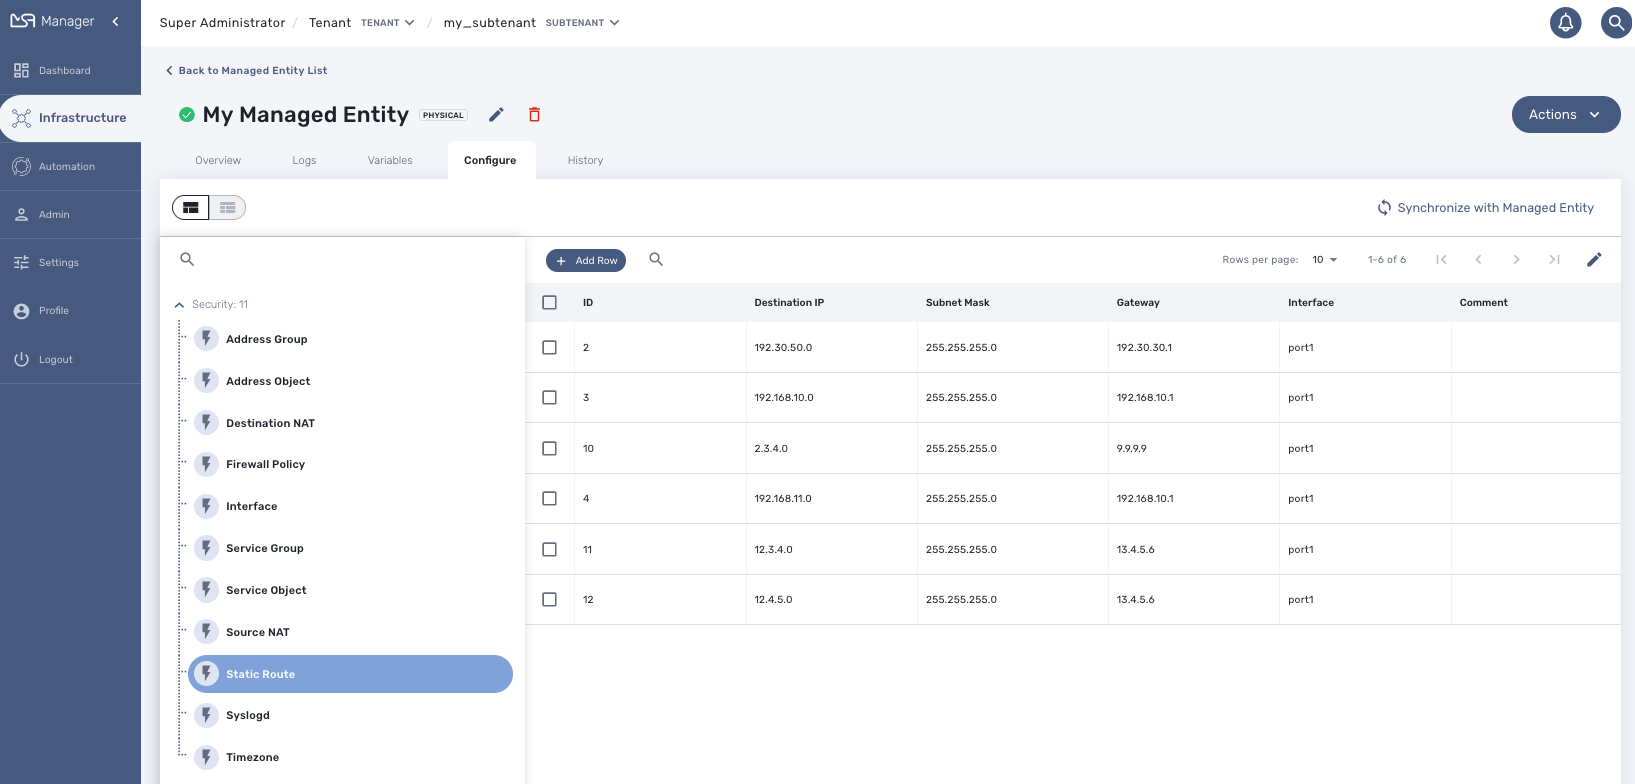
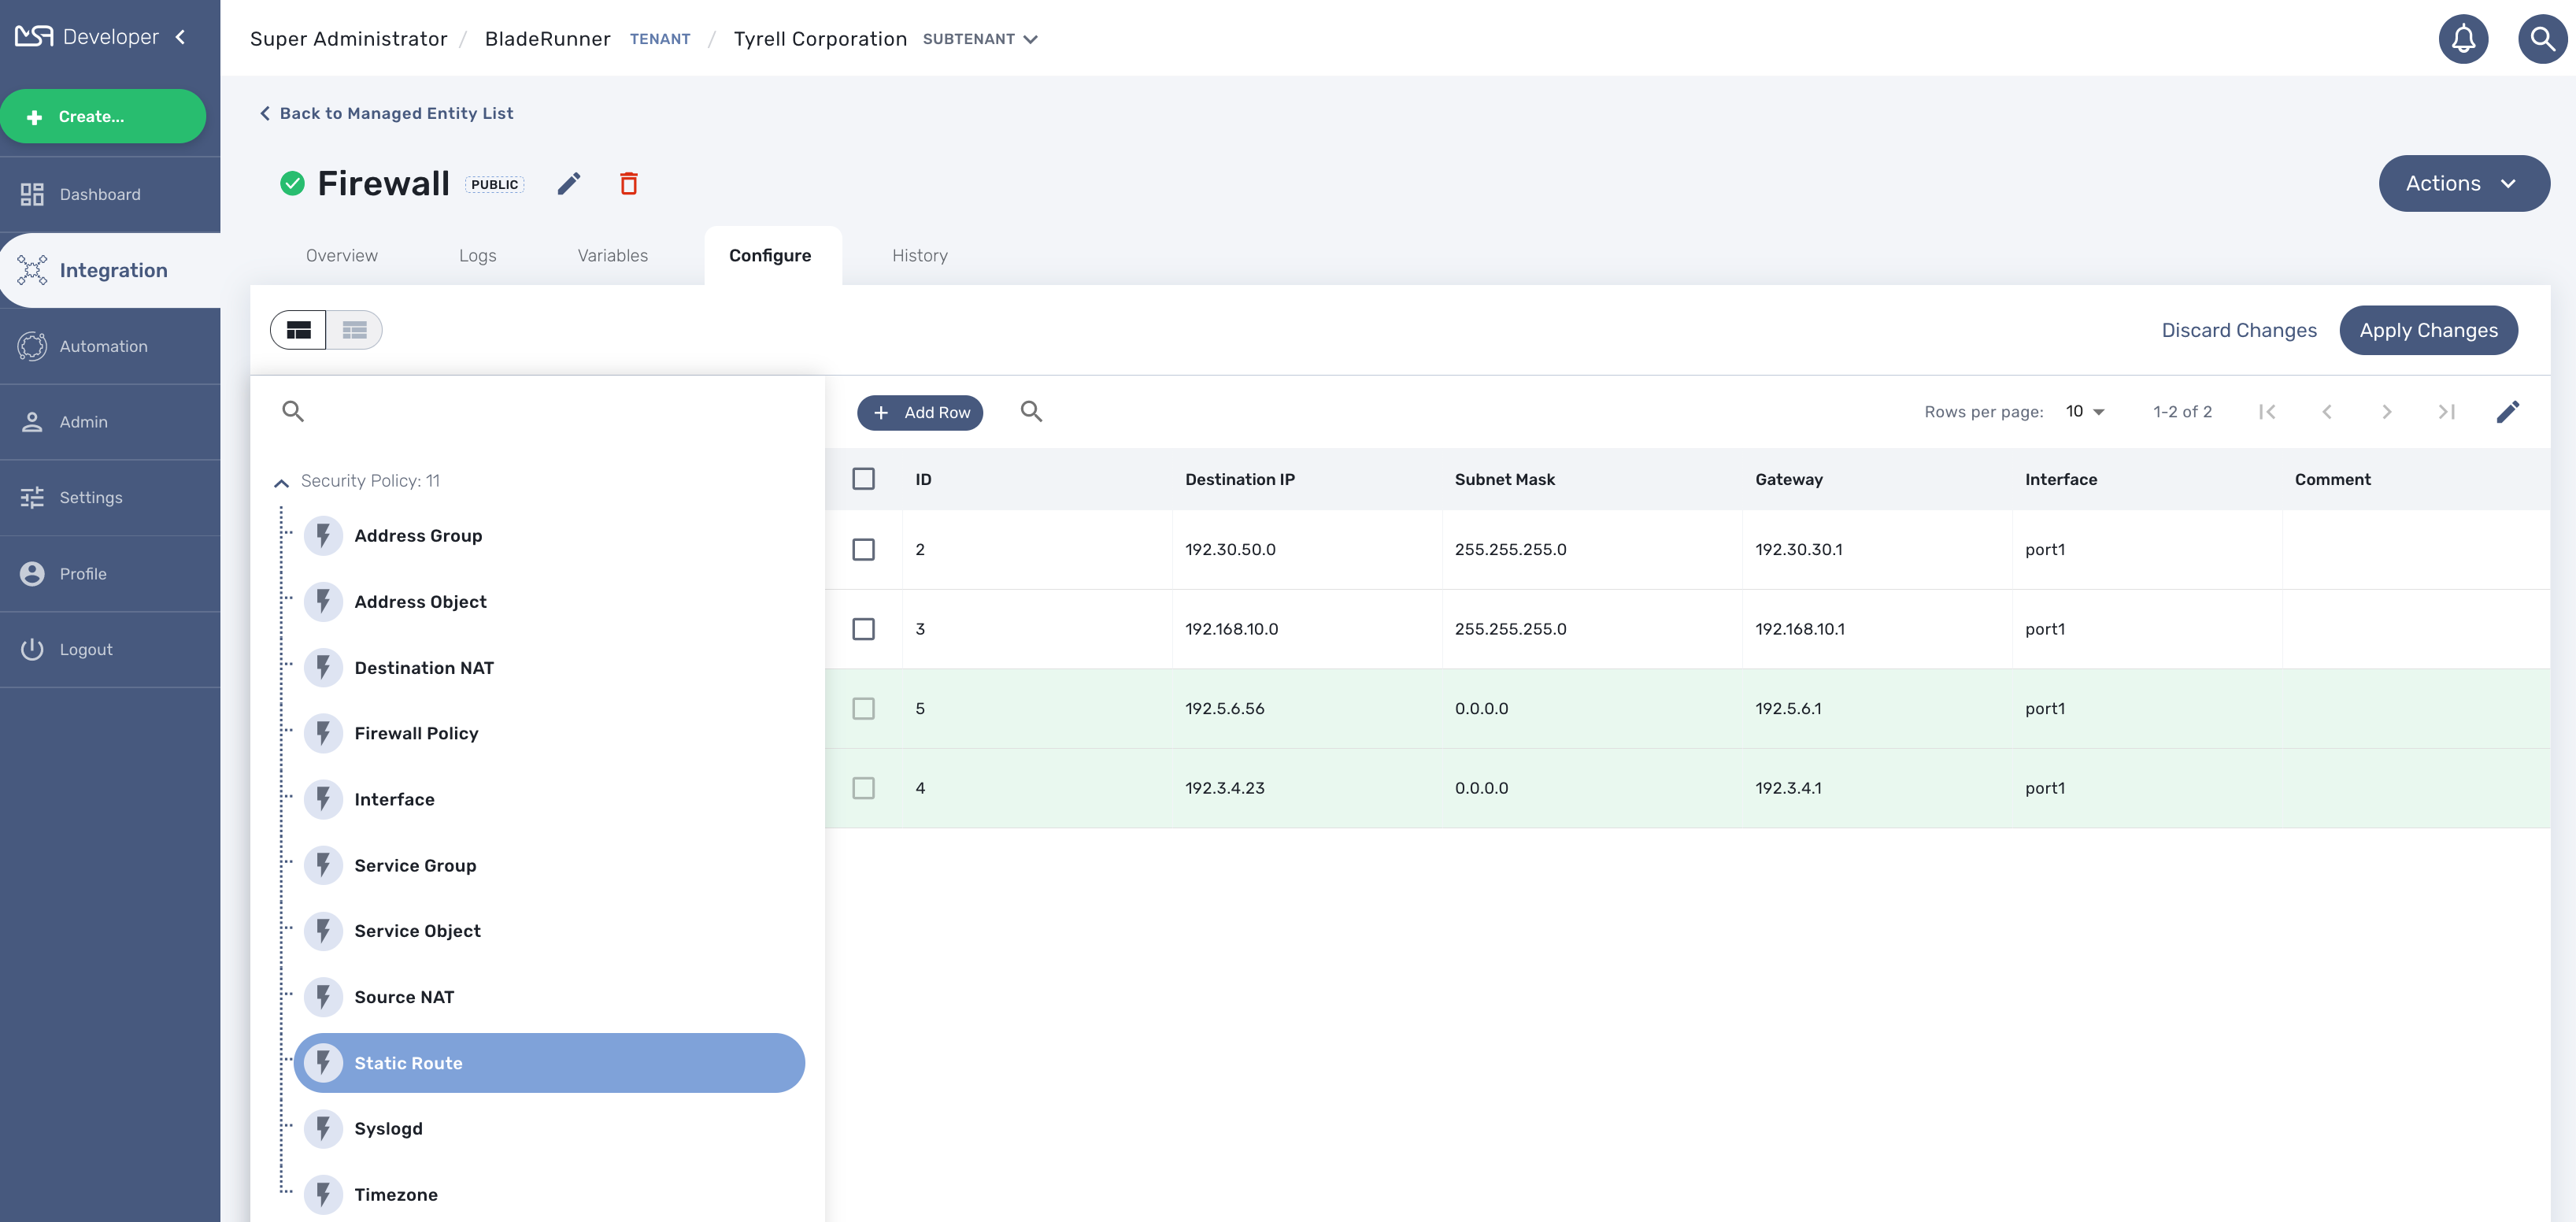
Configuration
Managed entities can be configured with microservices. To access the microservice console, click on the tab "Configure" on the managed entity screen.
In order to be able to use one or several microservices to configure a managed entity, the microservices must be associated to the managed entity via deployment settings.
Once associated to the managed entity, you can navigate to the managed entity tab "Configure" to access the microservice configuration console.
On the left menu of the console, you can see the list of the microservices that are associated to the current managed entity with the deployment setting.
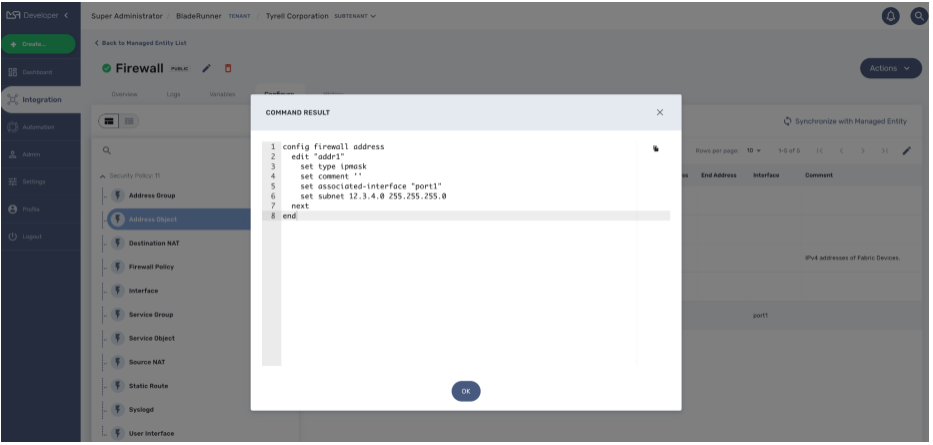
Synchronization with the managed entity
In order to import the configuration from the actual managed entity into the MSactivator™ configuration database, you need to click on the link "Synchronize with Managed Entity".
This will call the CoreEngine and run the Import of each of the microservice.
The Import function may not always be implemented (this depends on the design of the microservice), therefore, the CoreEngine will simply skip these microservices.
Once the synchronization is done, the console will display the microservice instance, one by line, for each microservice.
In order to ensure that the configuration stored in the database is exactly reflecting the actual configuration of the managed entity, the microservice instances, specific to the current managed entity, are deleted from the database before the actual import can start.
Configuration of the managed entity
You can create a new microservice instance by selecting a microservice on the left menu and clicking "+ Add Row" and providing the input parameters to configure.
The input parameters are defined in the microservice "Variable" section.
| "+ Add Row" is only available when the Create function of the selected microservice is implemented. |
To update or delete a microservice instance, you need to select the row and click on "Edit" or "Remove".
| "Edit" or "Remove" actions are only available if the Update or the Delete functions of the microservice are implemented. |
Once you have updated your microservice, you can either click on "Discard Changes" or "Apply Changes".
"Discard Changes" will remove all the orders that where stacked and stored in memory.
"Apply Changes" will unstack all the orders and pass all the orders that were stacked to the CoreEngine configuration daemon. The configuration daemon will process the order, build the configuration and apply it to the managed entity.
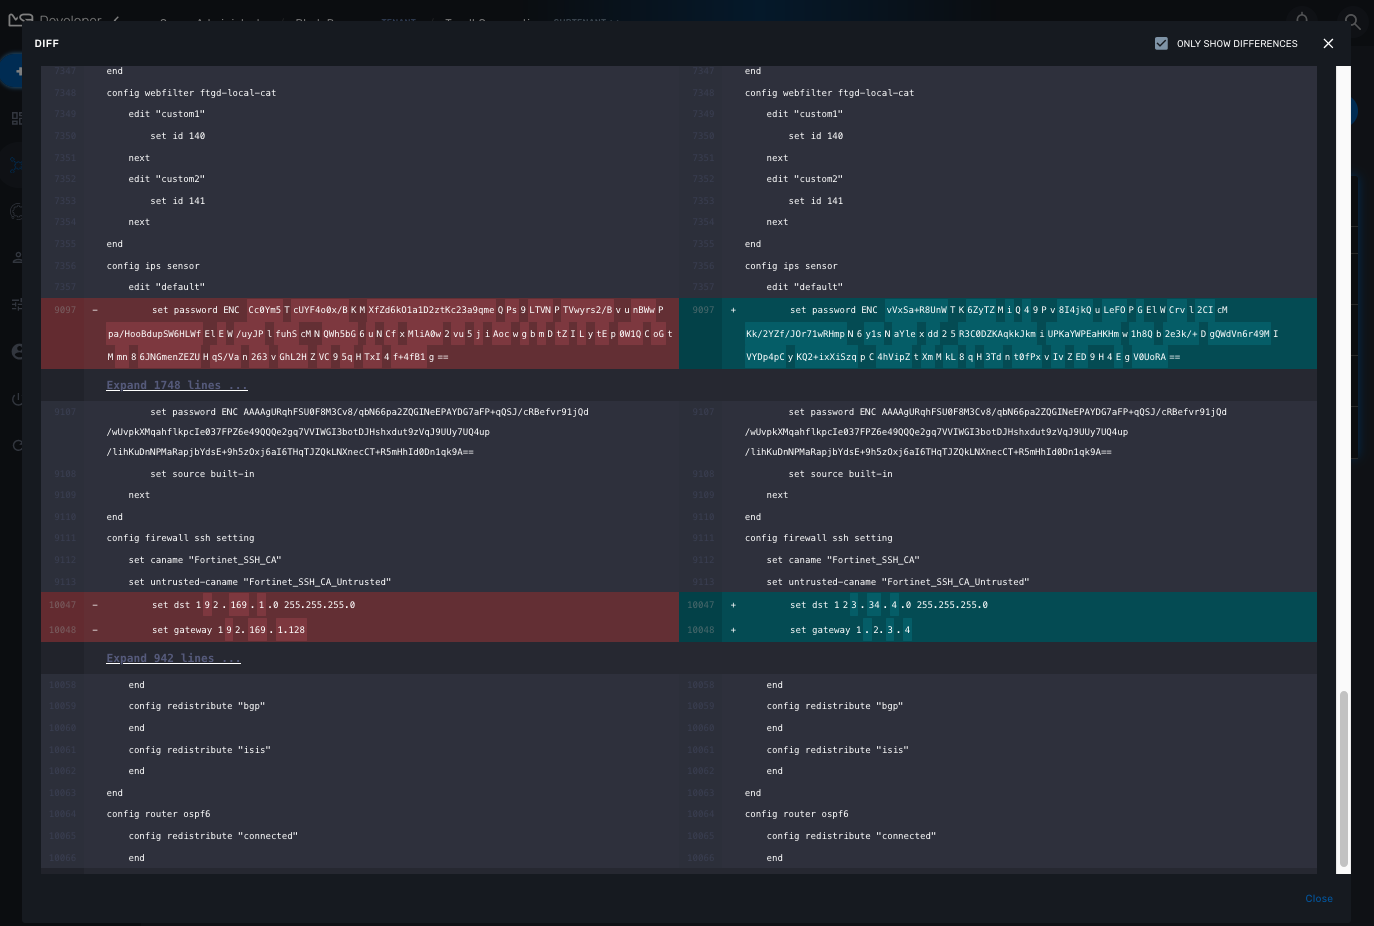
History
The MSactivator™ maintains a configuration history database that allows you to track the configuration changes that occurred on a managed entity and execute some backup/restore actions
In the "History" tab of the managed entity, you will see the list of all configuration versions (revisions) available in the configuration database.
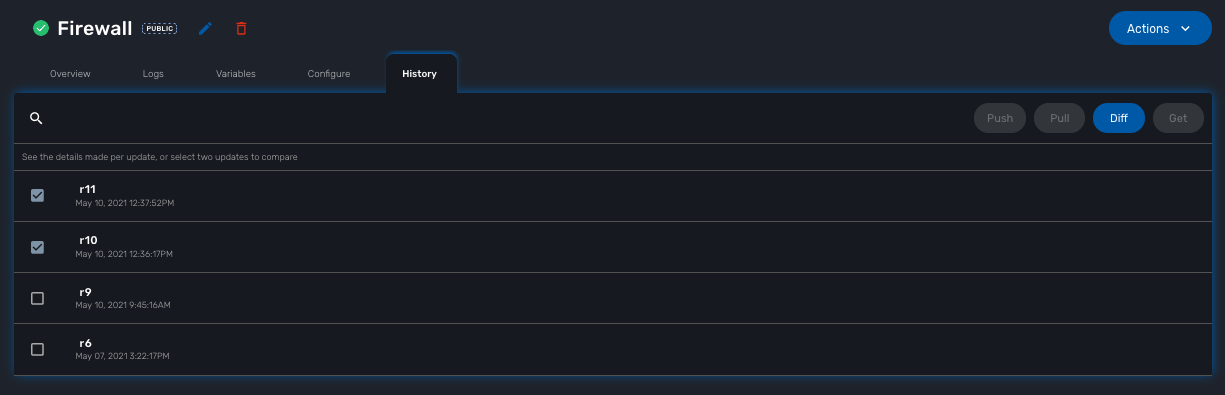
On this screen, you have the possibility to execute some action like restore a configuration (select a revision and use the Push button), backup a running configuration (use the Pull button) or display the differences between 2 selected revisions.
Assurance
The MSactivator™ provides an assurance module for collecting network events and managing alarms
All the events sent by the managed or monitored entities are collected, indexed and analyzed centrally.
Monitoring profiles
Overview
You can configure and monitor your KPI with the monitoring profiles.
A monitoring profiles is a way to configure a set of SNMP based KPI, to configure threshold crossing based alarms and build graphs to display the KPI.
A monitoring profile has to be associated to one or more managed entity(ies) and a managed entity can also be associated to several monitoring profile(s).
Create or edit a monitoring profile
You can create a monitoring profile by browsing to the "Infrastructure" menu and selecting the tab "Monitoring Profiles" and clicking "+ Create Monitoring profile".
A monitoring profile is made out of 2 parts: the SNMP polling and the graphical rendering. Although SNMP polling is mandatory to have the MSactivator™ poll for the KPI, the graphical rendering is optional.
SNMP polling
Click "+ Add Rule" to add a new KPI.
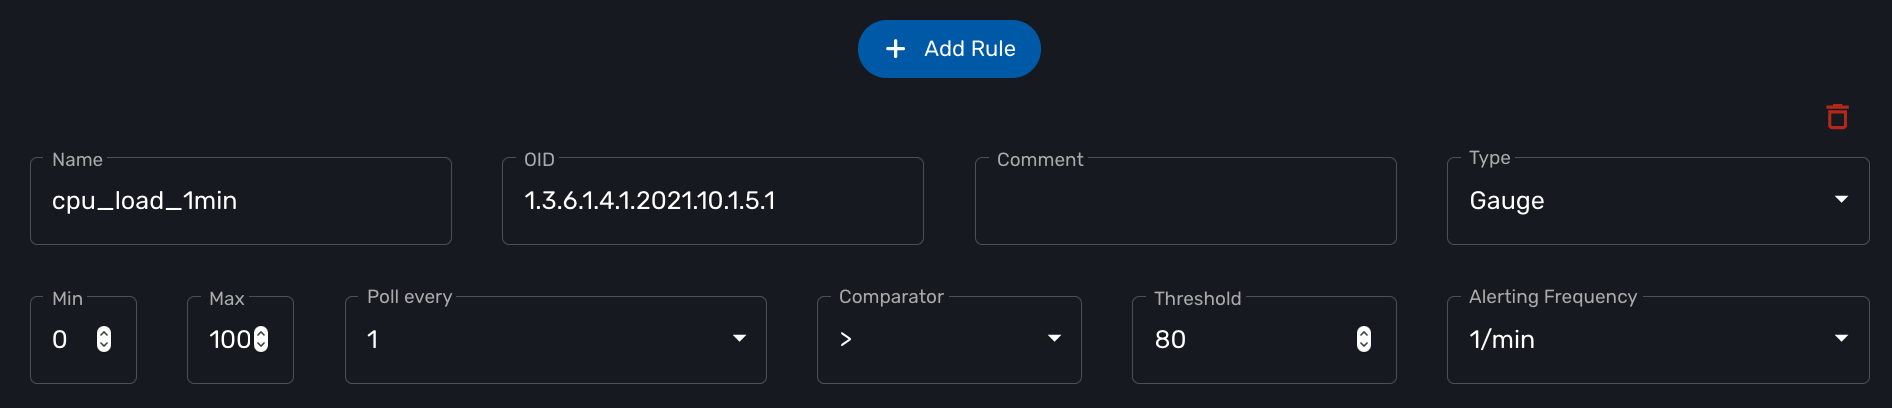
The name will be used internally to identify the KPI in the KPI database and in the UI to build the graphical rendering.
The MIB OID to read to get the value of the KPI.
Select Gauge or Counter (see below for detail on this field).
For gauge, the max value will be used to trim any KPI value to the value set as max.
Default is to poll for the KPI every minute but it possible to set a lower frequency for KPI that are less critical for instance.
Configure an alarm based on threshold crossing (for instance if the CPU goes over 80%). See below for more details
Gauge or Counter
The rrd graph rendering will be different for counter or for gauge.
For a gauge the value of the record is the value on the graph.
For a counter a value in the graph is calculated with the difference between two consecutive records divided by the period of time. In other words a rrd counter will convert the input into a rate.
For example, if you monitor network traffic on an interface you need to use counter because the MIB stores the total traffic that went through the interface and what you want to see in the graph is actually the traffic rate and see how it evolves in time
If you monitor the CPU usage, or the memory usage, you need to select a gauge because the MIB stores the actual value of the KPI.
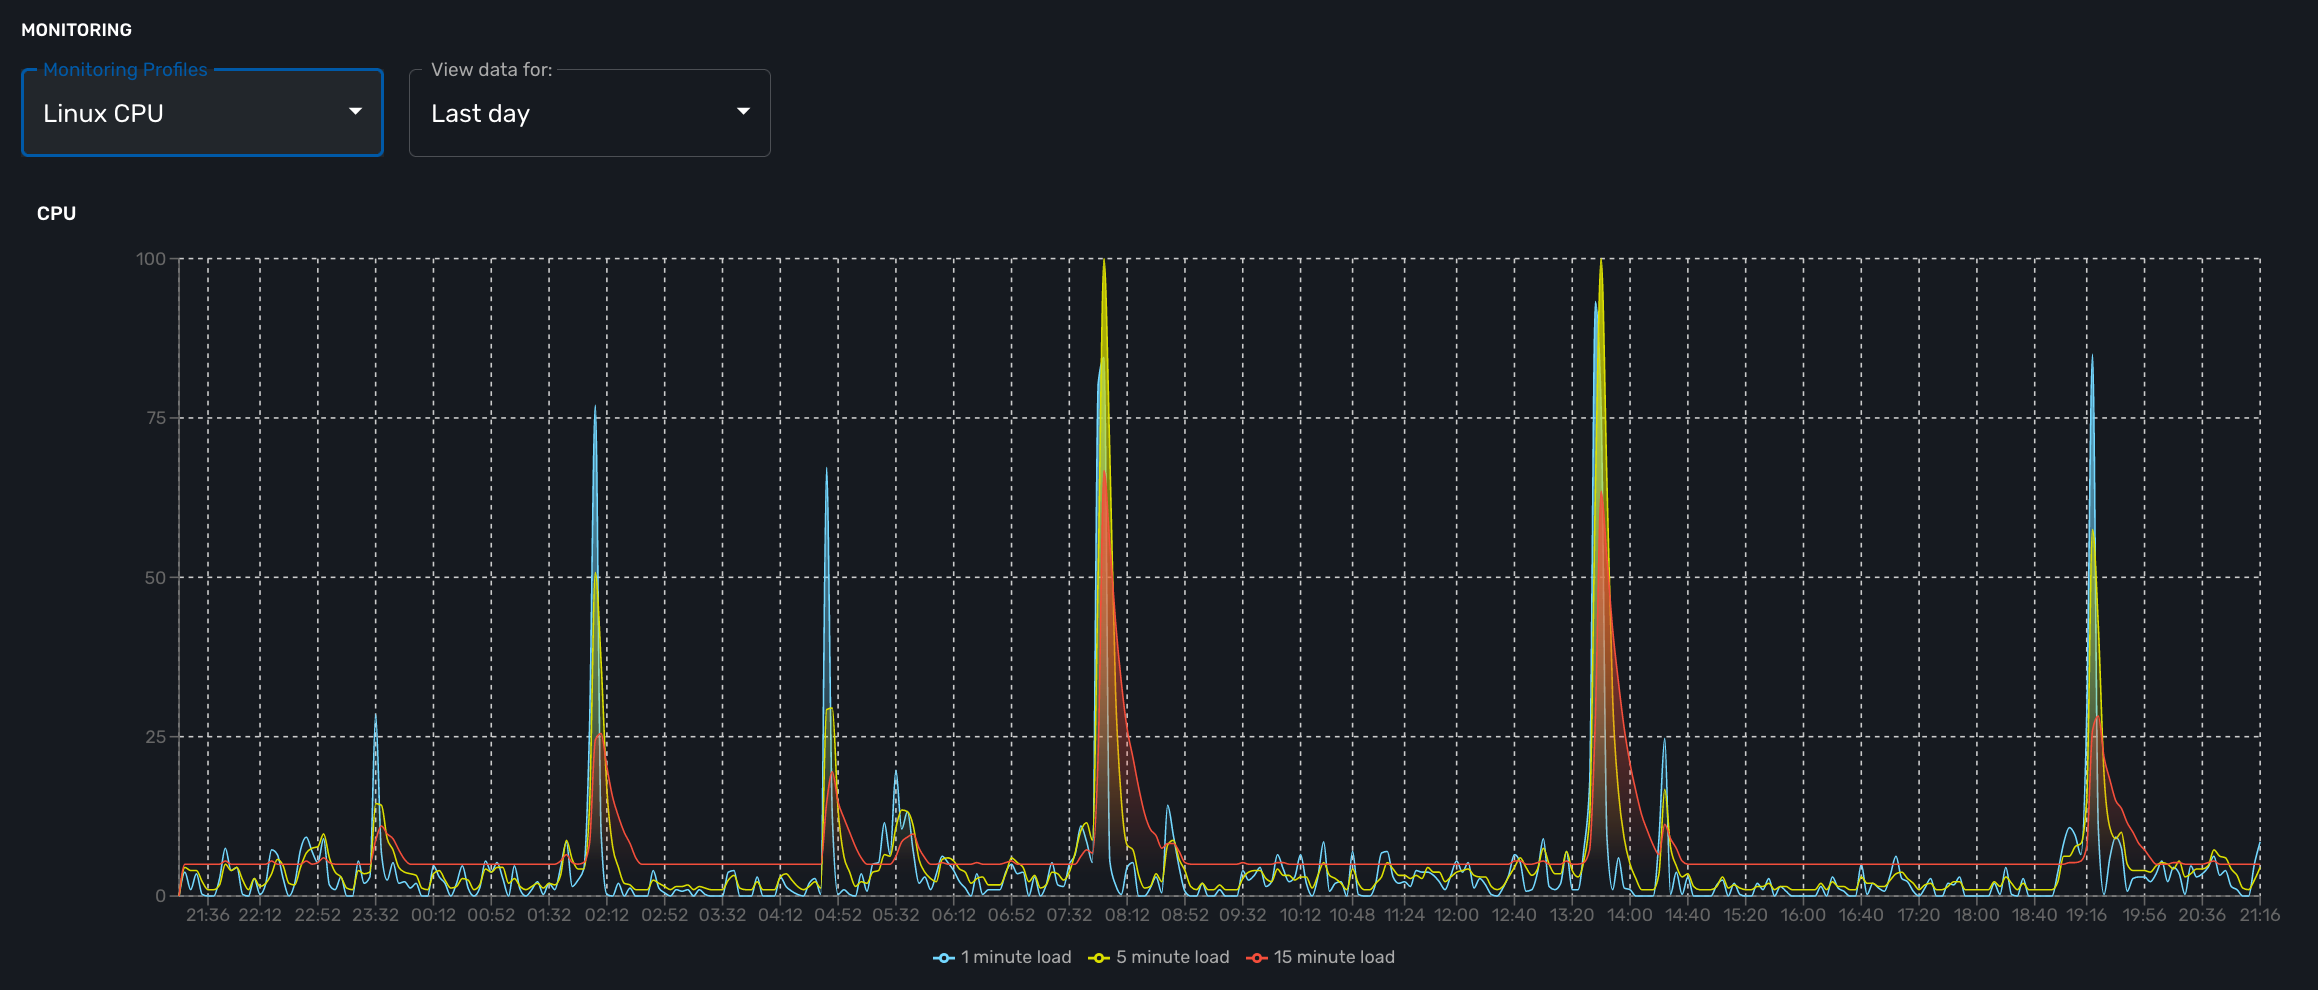
cpu_load_1min : 1.3.6.1.4.1.2021.10.1.5.1 (Gauge)
cpu_load_5min : 1.3.6.1.4.1.2021.10.1.5.2 (Gauge)
cpu_load_15min : 1.3.6.1.4.1.2021.10.1.5.3 (Gauge)
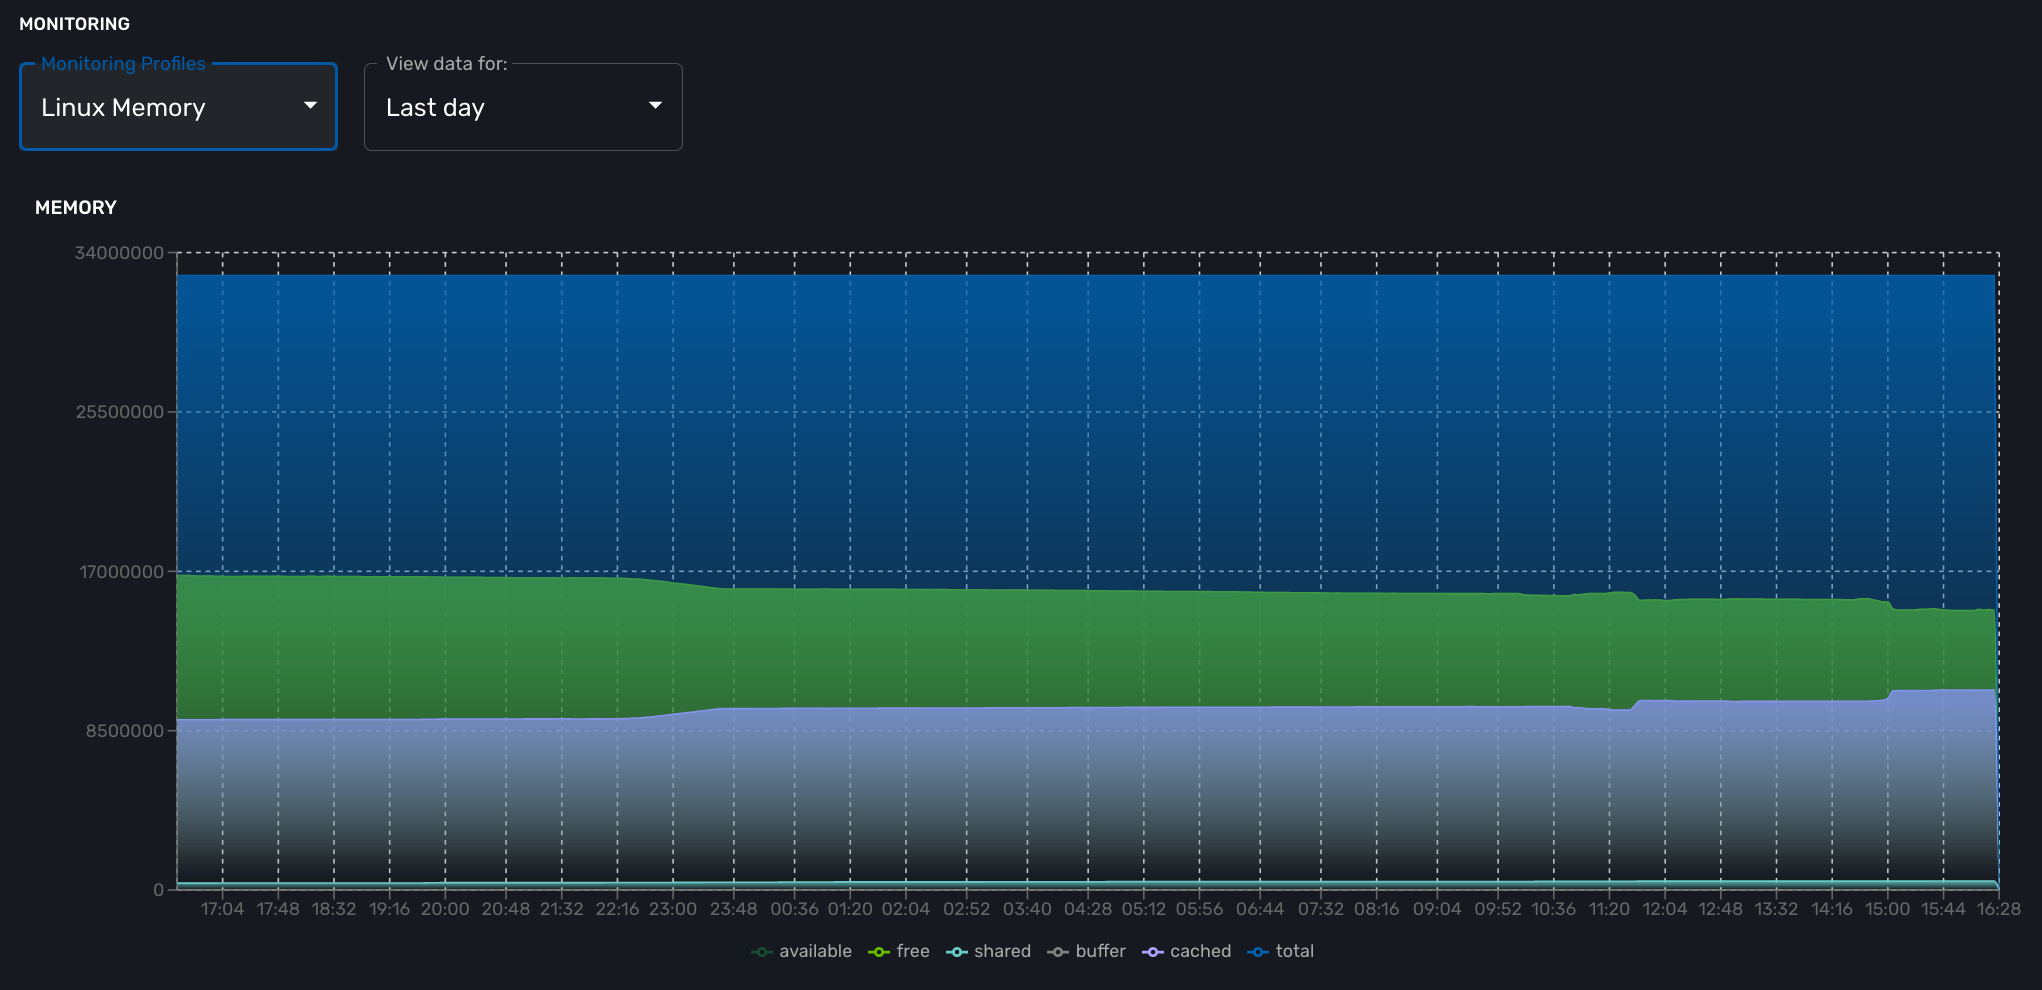
memAvailReal : .1.3.6.1.4.1.2021.4.6.0 (Gauge)
memTotalFree : .1.3.6.1.4.1.2021.4.11.0 (Gauge)
memShared : .1.3.6.1.4.1.2021.4.13.0 (Gauge)
memBuffer : .1.3.6.1.4.1.2021.4.14.0 (Gauge)
memCached : .1.3.6.1.4.1.2021.4.15.0 (Gauge)
memTotalReal : .1.3.6.1.4.1.2021.4.5.0 (Gauge)
traffic_in : 1.3.6.1.2.1.2.2.1.10.2 (Counter)
traffic_out : 1.3.6.1.2.1.2.2.1.16.2 (Counter)
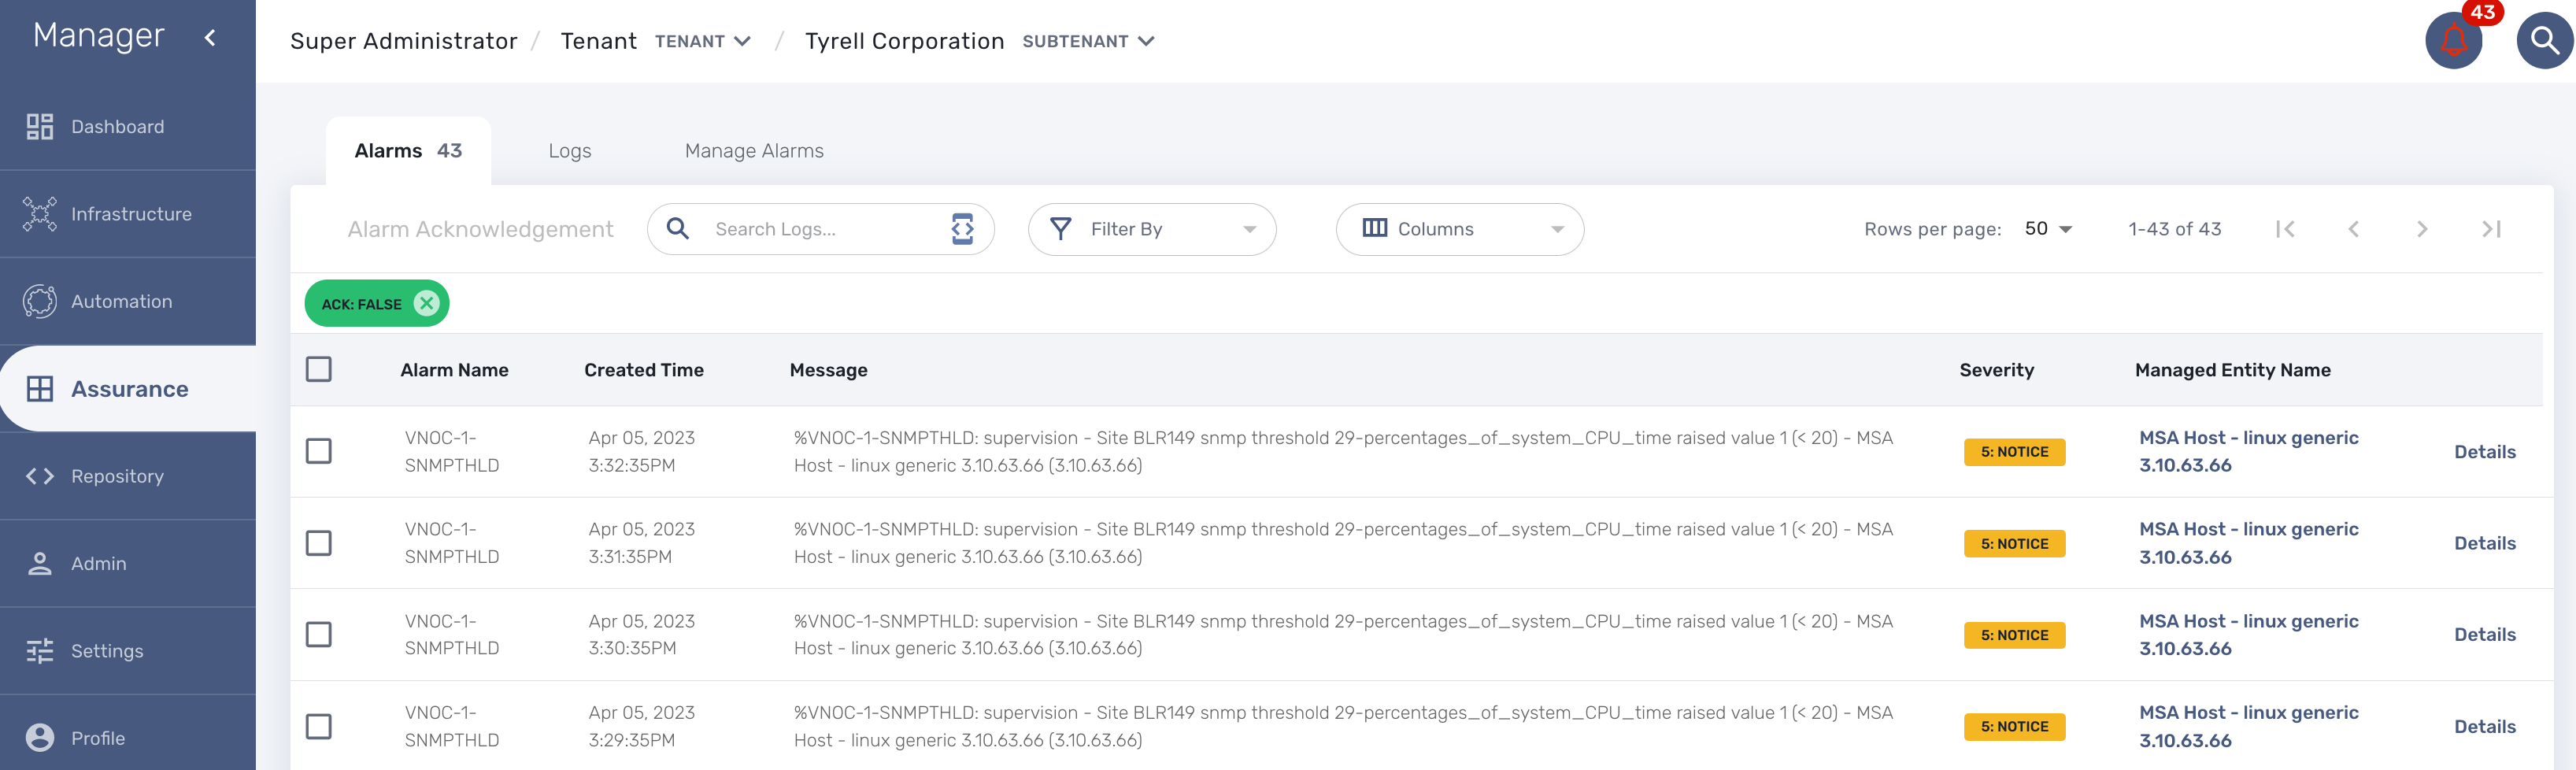
Is is possible to configure VNOC events based on KPI threshold crossing.
This is useful to monitor resources such as CPU or memory consumption. When a KPI crosses a threshold and event is generated and visible in the assurance "Logs" section.
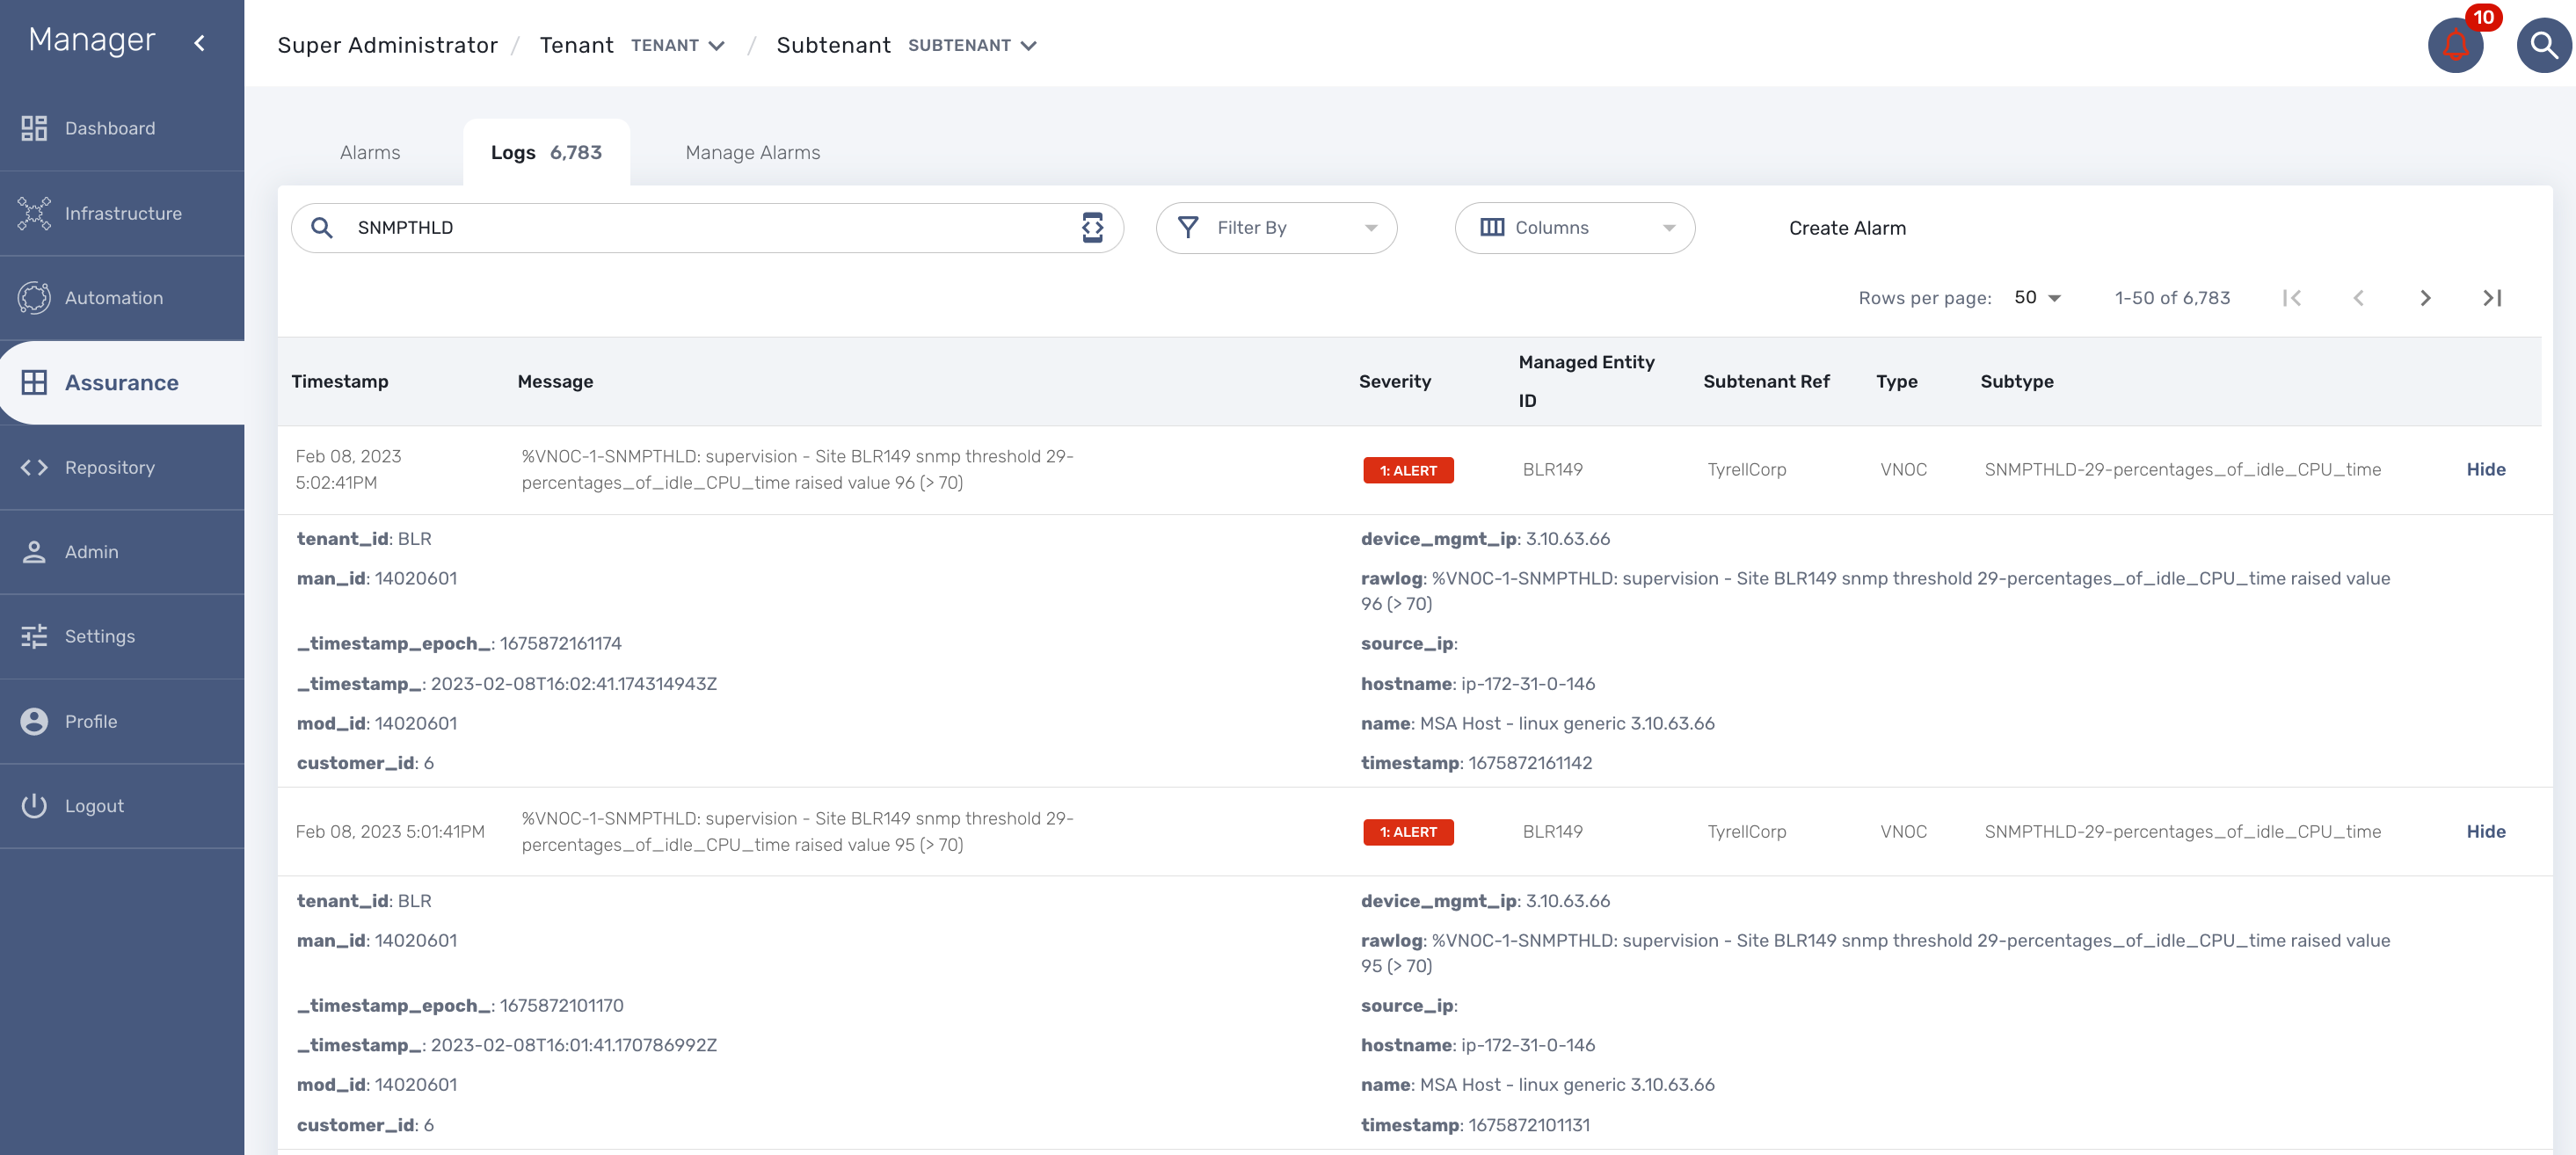
When a monitoring threshold is crossed the log message will be similar to "%VNOC-1-SNMPTHLD: supervision - Site BLR126 snmp threshold 31-cpu_load_1min raised value 173 (> 10)" where you can see that the threshold 10 has been crossed by a greater value 69.
This configuration is done at the SNMP polling rule in the monitoring profile by setting a comparator '>' or '<' and a threshold.
VNOC threshold crossing events can be used to configure alarms in order to be notified by email or SNMP trap or simply by the alarm bell icon on the top right of the screen.
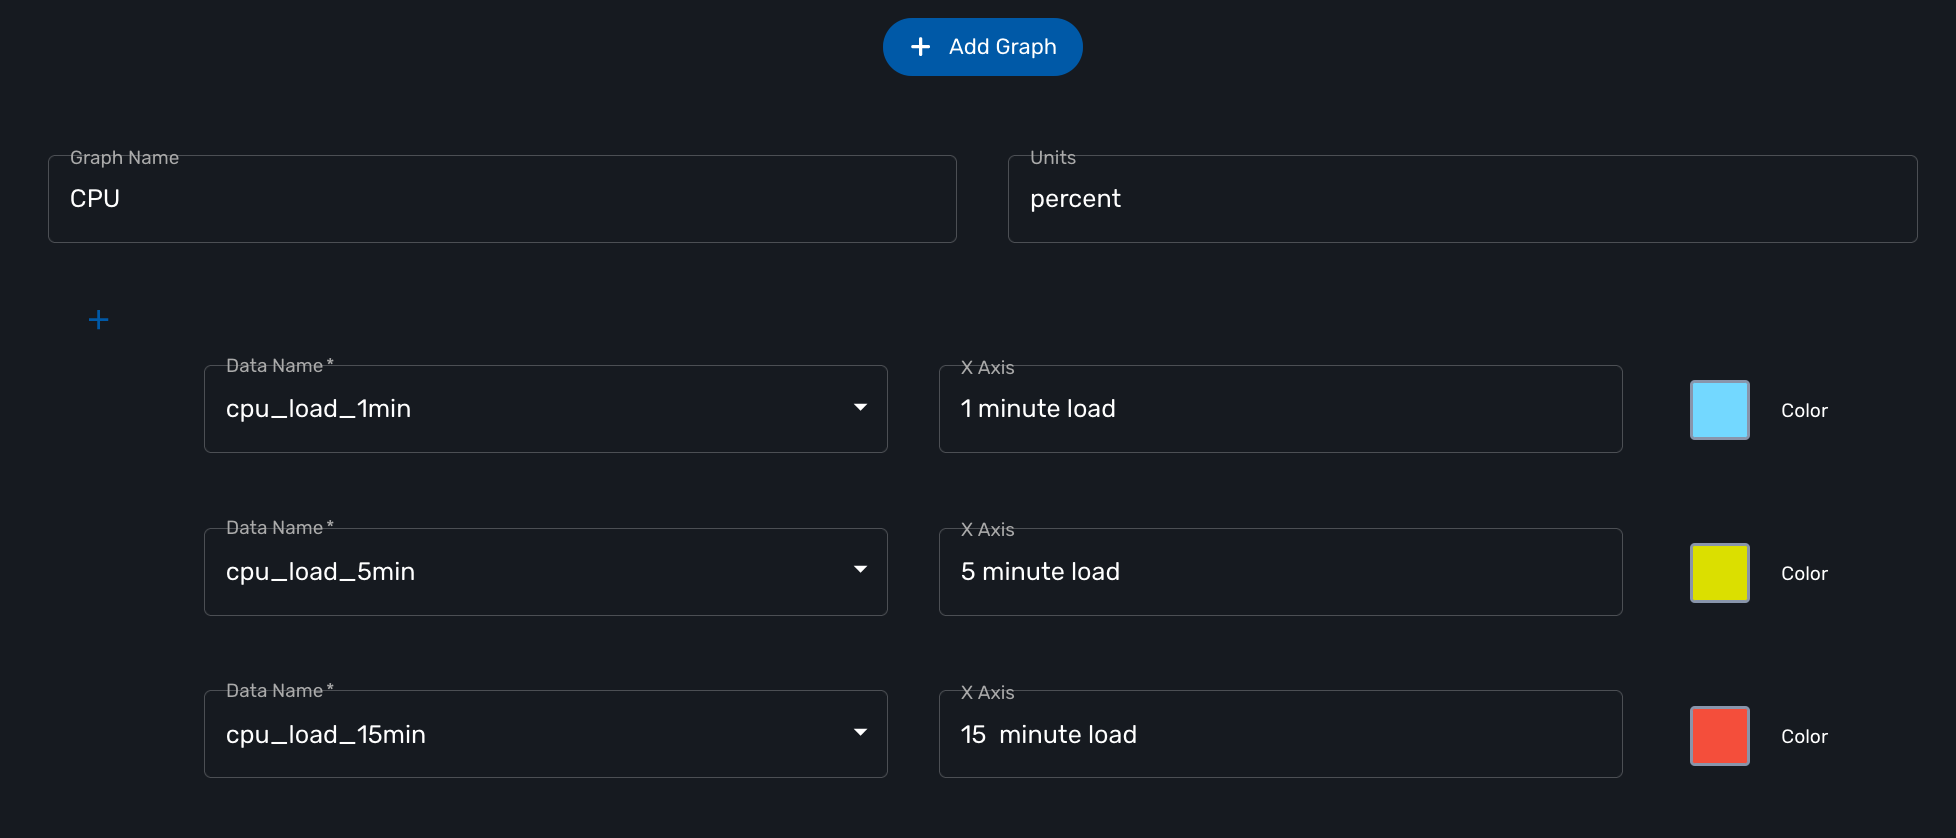
Graphical rendering
For each monitoring profile you can also create a graph to aggregate and display 1 or more KPI defined in the SNMP polling section.
Since the KPI are going to be displayed in the same graph, you need to ensure that the data is consistent. Displaying CPU load and network traffic in the same graph is allowed but will not make any sense. In this case you need to have 2 monitoring profiles for each set of KPI.
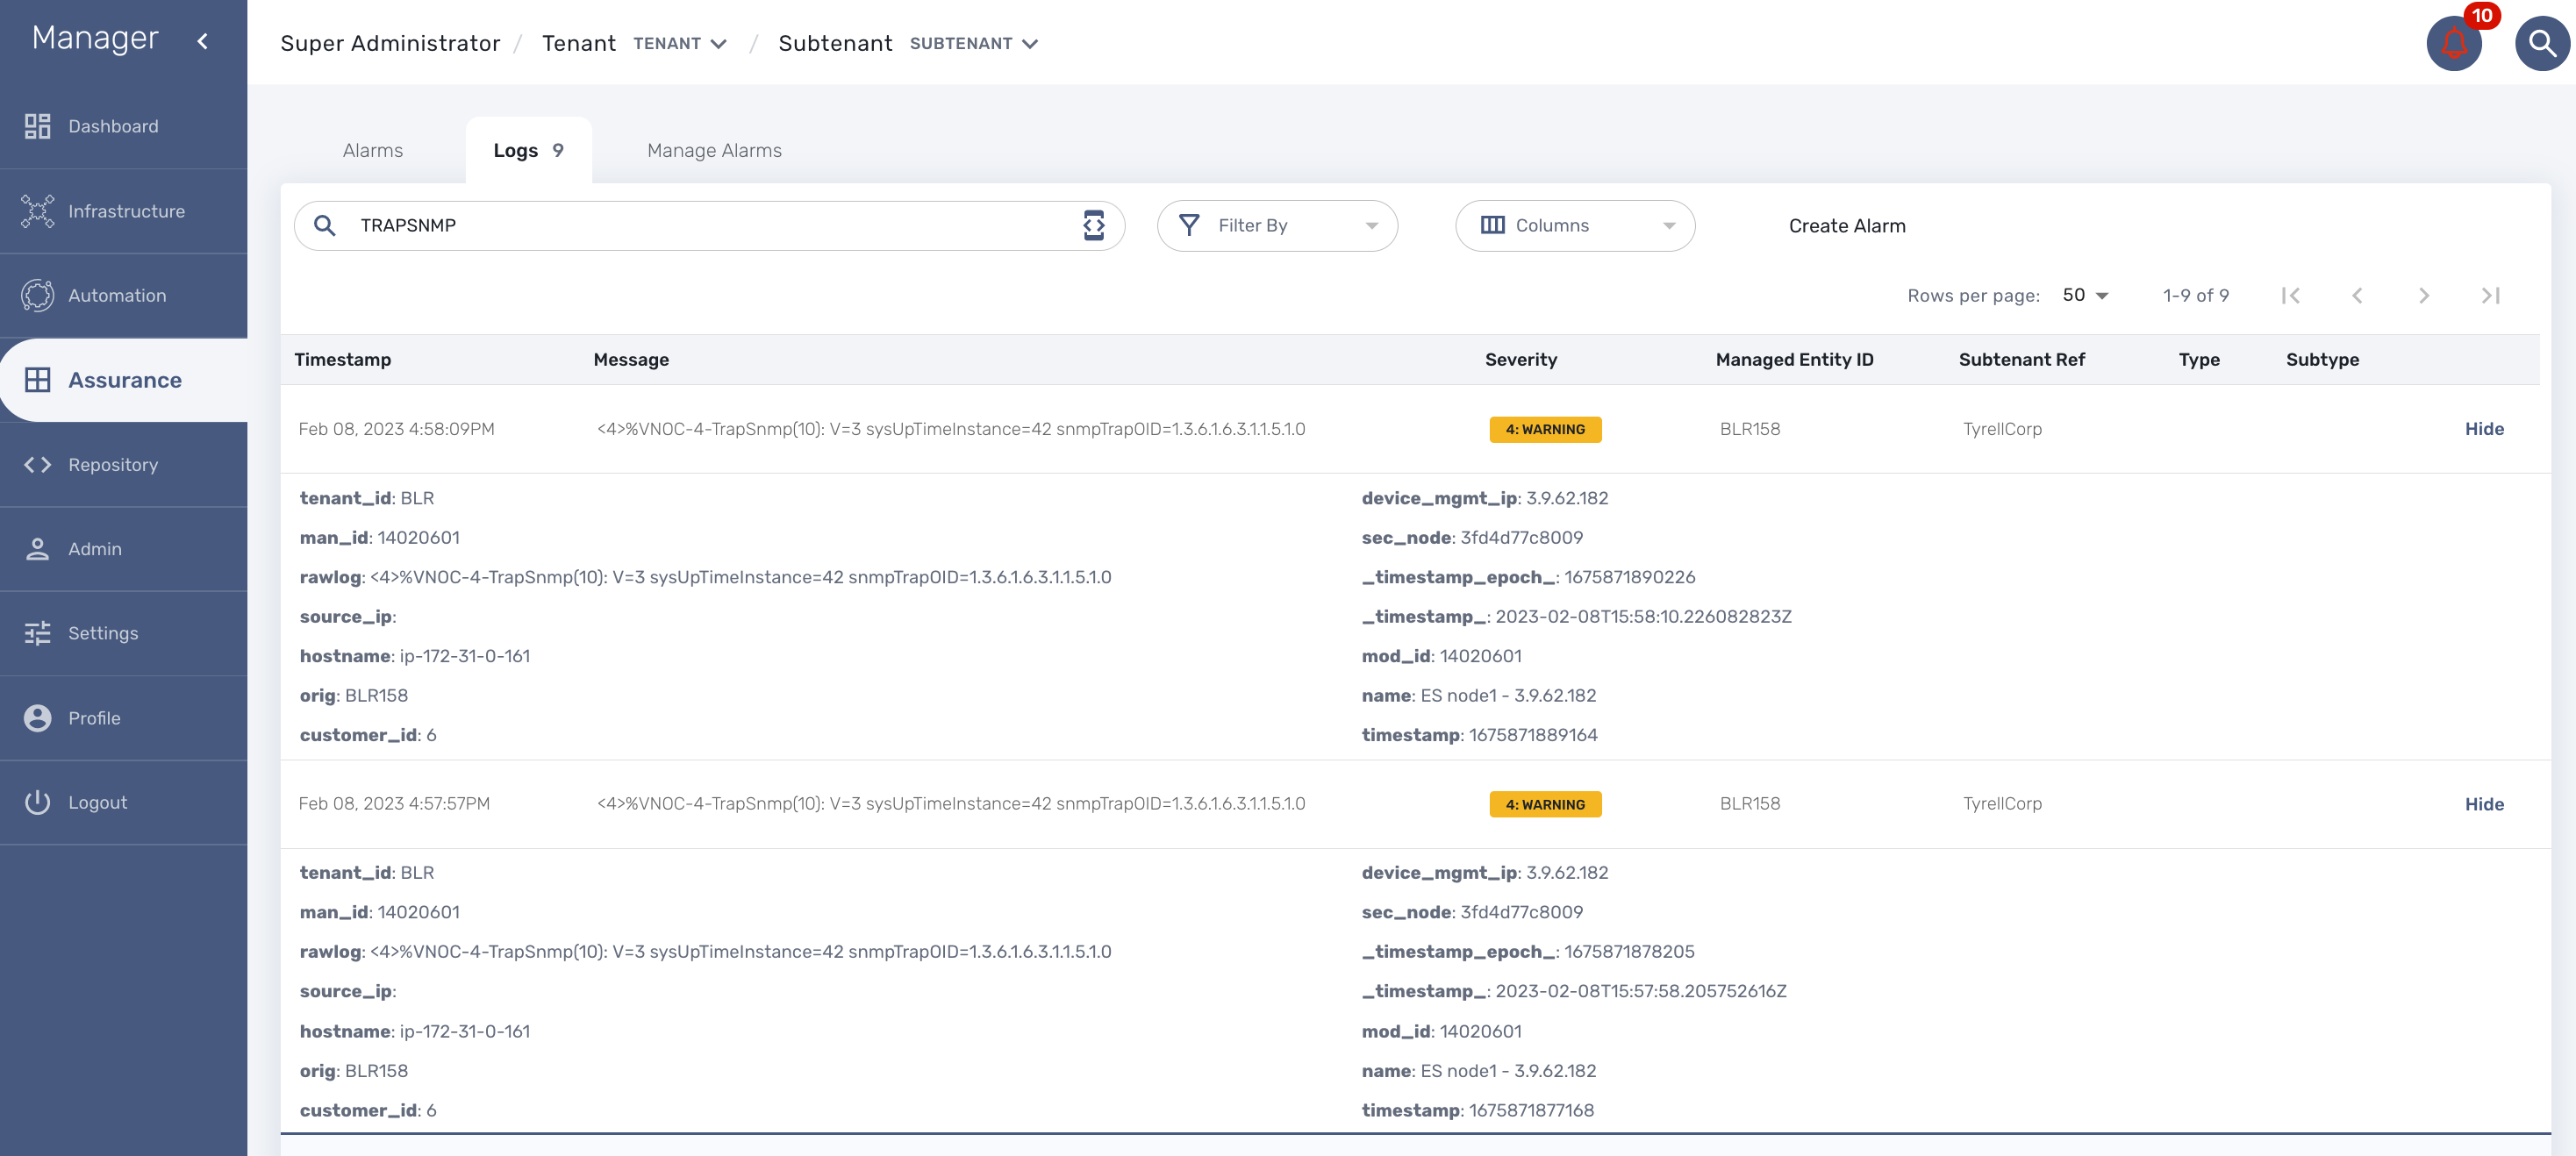
SNMP trap monitoring
The MSactivator™ can collect and index SNMP trap out of the box.
To monitor a managed entity with SNMP trap you need to configure the managed entity with Collect Syslog and Analyze Syslog enabled.
When the MSactivator™ collects a trap, it relies on the trap source IP address to identify the managed entity by it’s management IP address.
Once a management entity is identified, the trap will be processed the same way as a syslog and will be indexed in Elasticsearch. It will then be listed in the logs screen in the "Alarms" section.
SNMP v2/v3
By default the MSactivator™ will be using SNMP v2.
Starting with MSactivator™ v2.8.3 SNMPv3 is also supported.
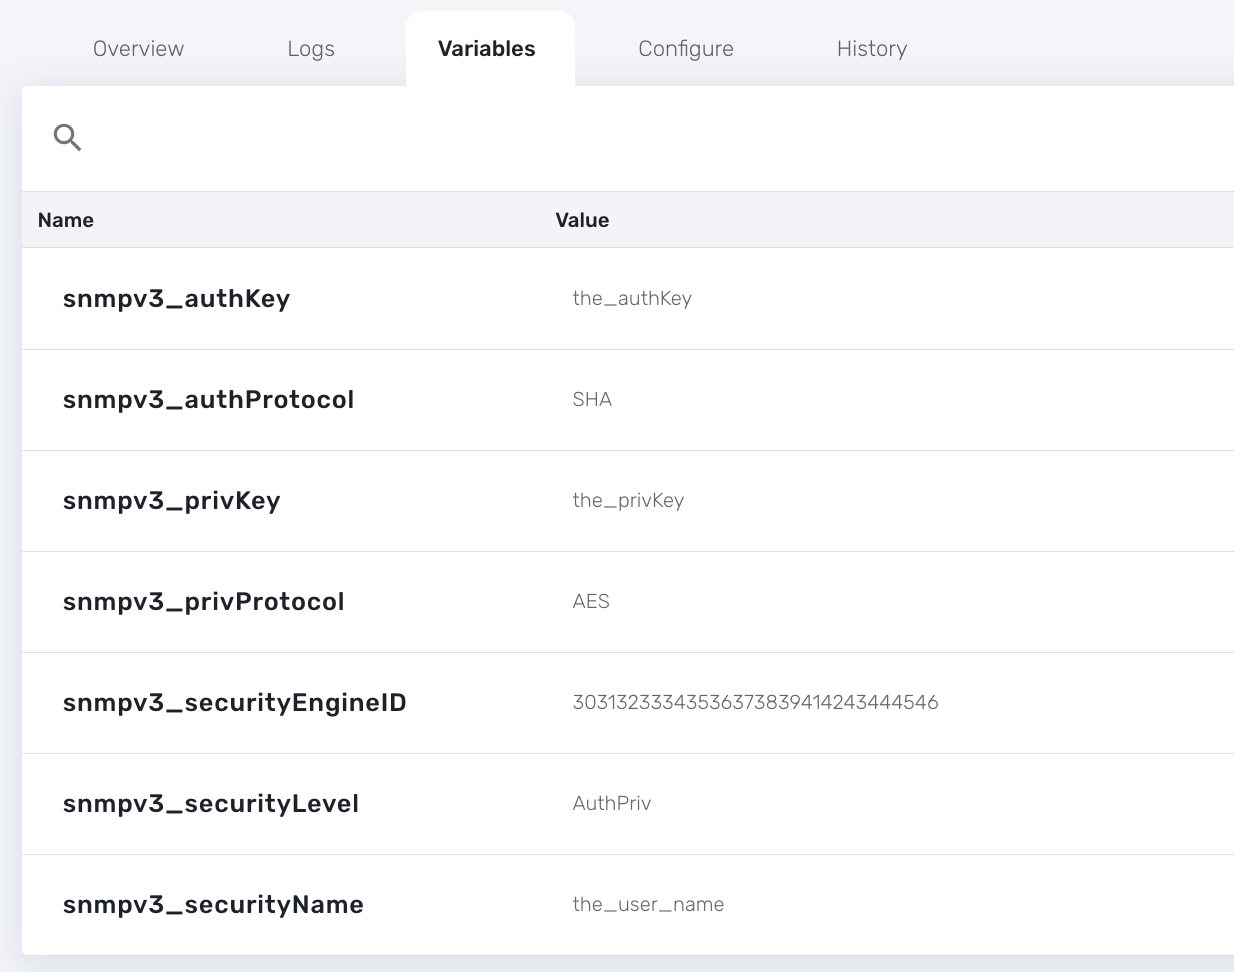
In order to use SNMPv3 to monitor a managed entity you need to configure its variables with the SNMPv3 parameters.
-
snmpv3_securityName
-
snmpv3_securityLevel: possible values are noAuthNoPriv, authNoPriv, and authPriv
-
snmpv3_authKey
-
snmpv3_authProtocol: possible values are MD5 or SHA
-
snmpv3_privKey
-
snmpv3_privProtocol: possible values are DES or AES
-
snmpv3_securityEngineID
For the polling, the mandatory variables are snmpv3_securityName, snmpv3_securityLevel, the others depends of snmpv3_securityLevel value, see below.
For receiving SNMP trap, the mandatory variables are snmpv3_securityName, snmpv3_securityLevel, snmpv3_securityEngineID, the others depends of snmpv3_securityLevel value, see below.
-
if snmpv3_securityLevel is set to authPriv, the additional mandatory variables are snmpv3_authKey, snmpv3_authProtocol, snmpv3_privKey, snmpv3_privProtocol
-
if snmpv3_securityLevel is set to authNoPriv, the additional mandatory variables are snmpv3_authKey, snmpv3_authProtocol
-
if snmpv3_securityLevel is set to noAuthNoPriv, no other additional variables are mandatory
You also need to enable "SNMP Monitoring", use the SNMPv3 user for the community field.
The parameter values should match the SNMPv3 configuration that was set in your actual device.
For instance on a Linux Centos7:
[centos@ip-172-31-0-52 ~]$  snmpwalk -v3 -u ubiqube -l authNoPriv -a MD5 -A Ubiqube2021 localhost
SNMPv2-MIB::sysDescr.0 = STRING: Linux ip-172-31-0-52.eu-west-2.compute.internal 3.10.0-957.12.2.el7.x86_64 #1 SMP Tue May 14 21:24:32 UTC 2019 x86_64
SNMPv2-MIB::sysObjectID.0 = OID: NET-SNMP-MIB::netSnmpAgentOIDs.10
DISMAN-EVENT-MIB::sysUpTimeInstance = Timeticks: (116126) 0:19:21.26
SNMPv2-MIB::sysContact.0 = STRING: root@localhost
SNMPv2-MIB::sysName.0 = STRING: ip-172-31-0-52.eu-west-2.compute.internal
SNMPv2-MIB::sysLocation.0 = STRING: Unknown
SNMPv2-MIB::sysORLastChange.0 = Timeticks: (8) 0:00:00.08
SNMPv2-MIB::sysORID.1 = OID: SNMP-MPD-MIB::snmpMPDCompliance
SNMPv2-MIB::sysORID.2 = OID: SNMP-USER-BASED-SM-MIB::usmMIBCompliance
SNMPv2-MIB::sysORID.3 = OID: SNMP-FRAMEWORK-MIB::snmpFrameworkMIBCompliance
SNMPv2-MIB::sysORID.4 = OID: SNMPv2-MIB::snmpMIB
To verify that SNMP v3 monitoring is working properly you can check that the sysuptime graph is plotting data.
You can also monitor specific KPI based on the OID of your vendor.
Collecting SNMPv3 trap
For SNMPv3 traps, the managed entity should be configured as explained above and the variable snmpv3_securityEngineID is mandatory for decoding the SNMP traps.
SNMP trap translation
Architecture overview
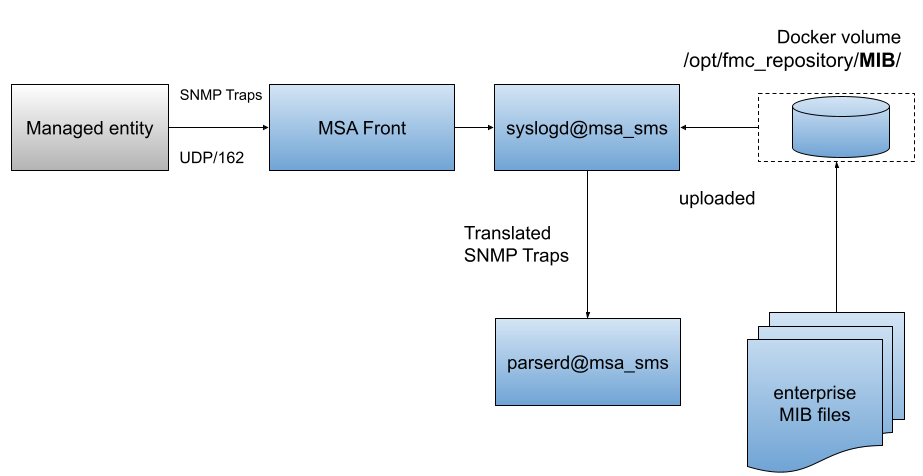
The MIB translation is automatically done based on the MIB definition files loaded in the repository
First put the MIB definition files into the repository under a folder "MIBs".
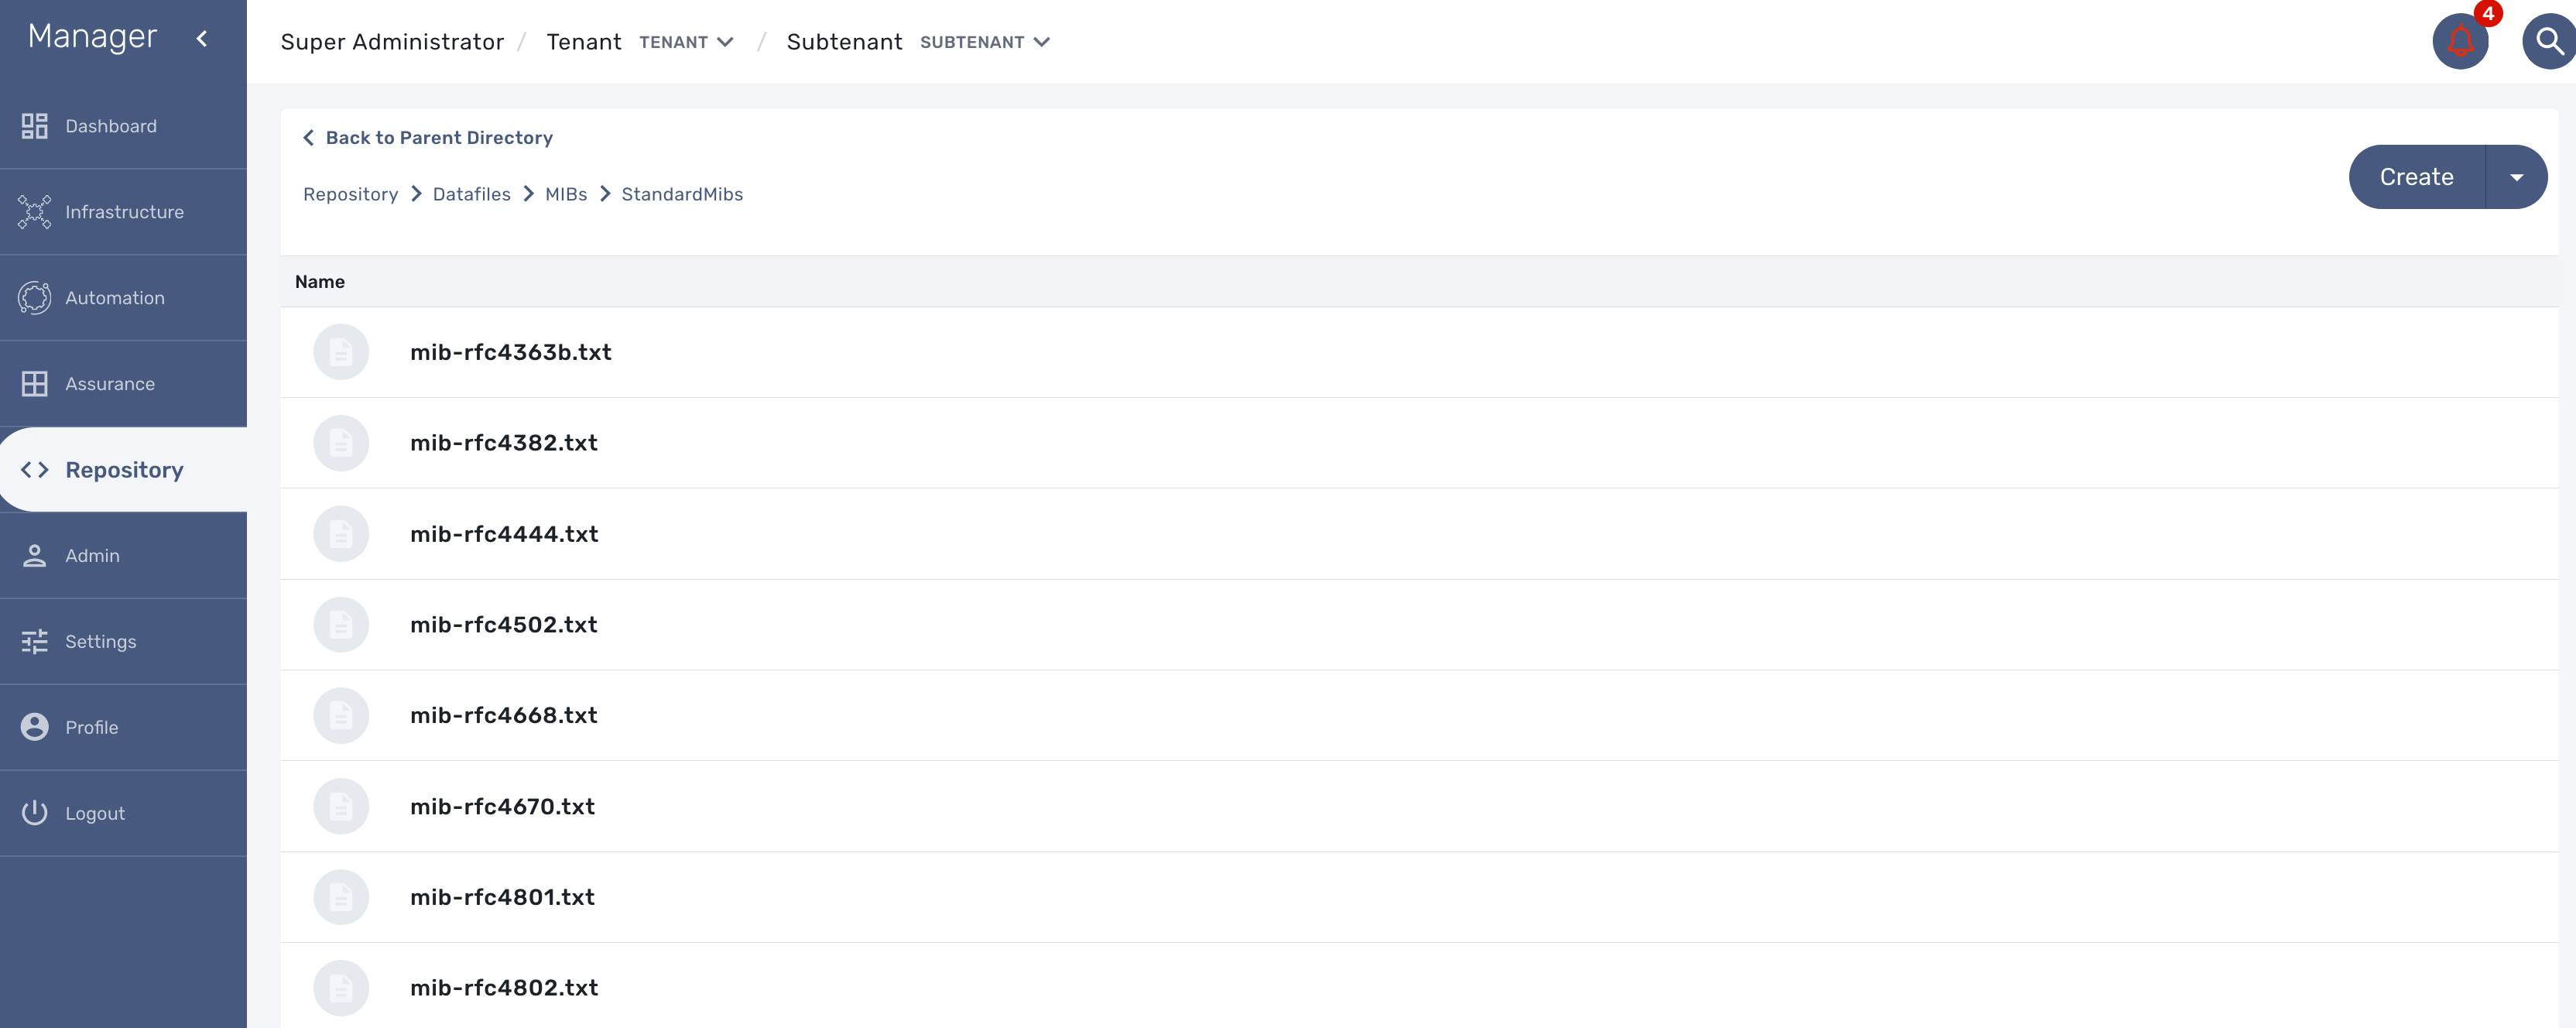
The translation process is reading the text (*.txt) files in /opt/fmc_repository/Datafiles/MIBs/ in order to get the list of the available MIBs (recursive reading is supported)
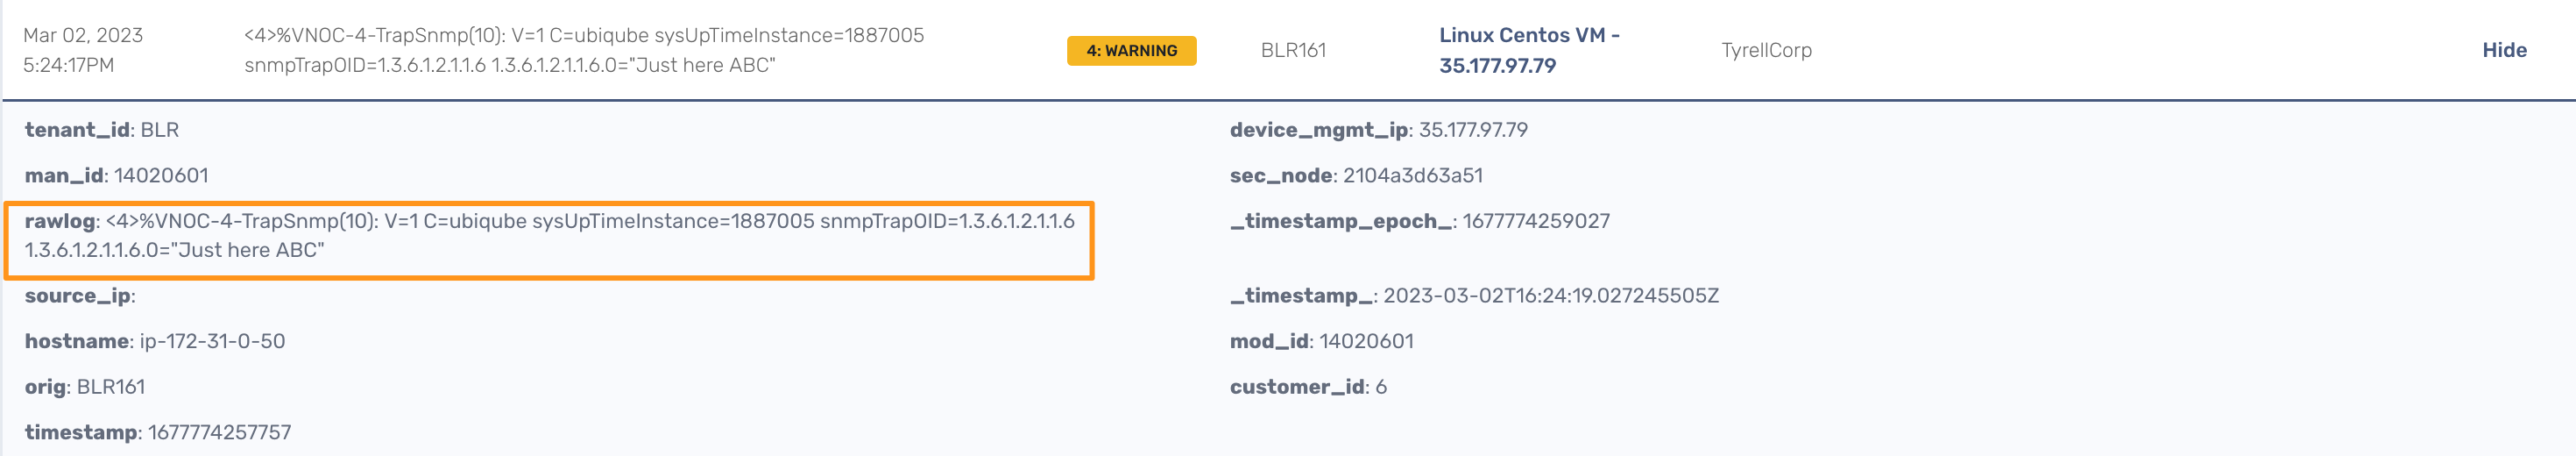
Testing
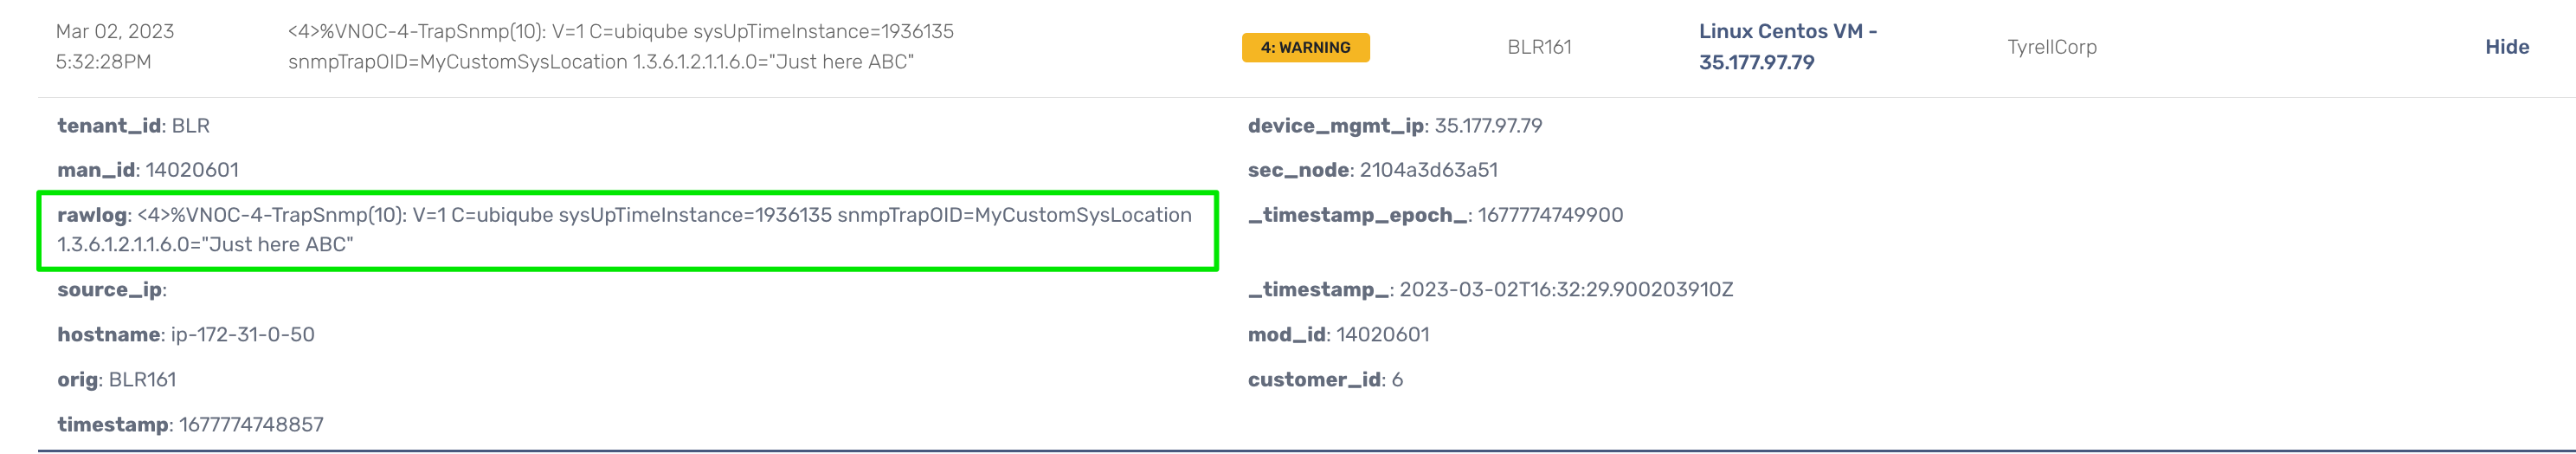
We can now launch a snmp trap command with OID 1.3.6.1.2.1.1.6
snmptrap -v2c -c ubiqube 3.10.63.66 "" 1.3.6.1.2.1.1.6 1.3.6.1.2.1.1.6.0 s "Just here ABC"
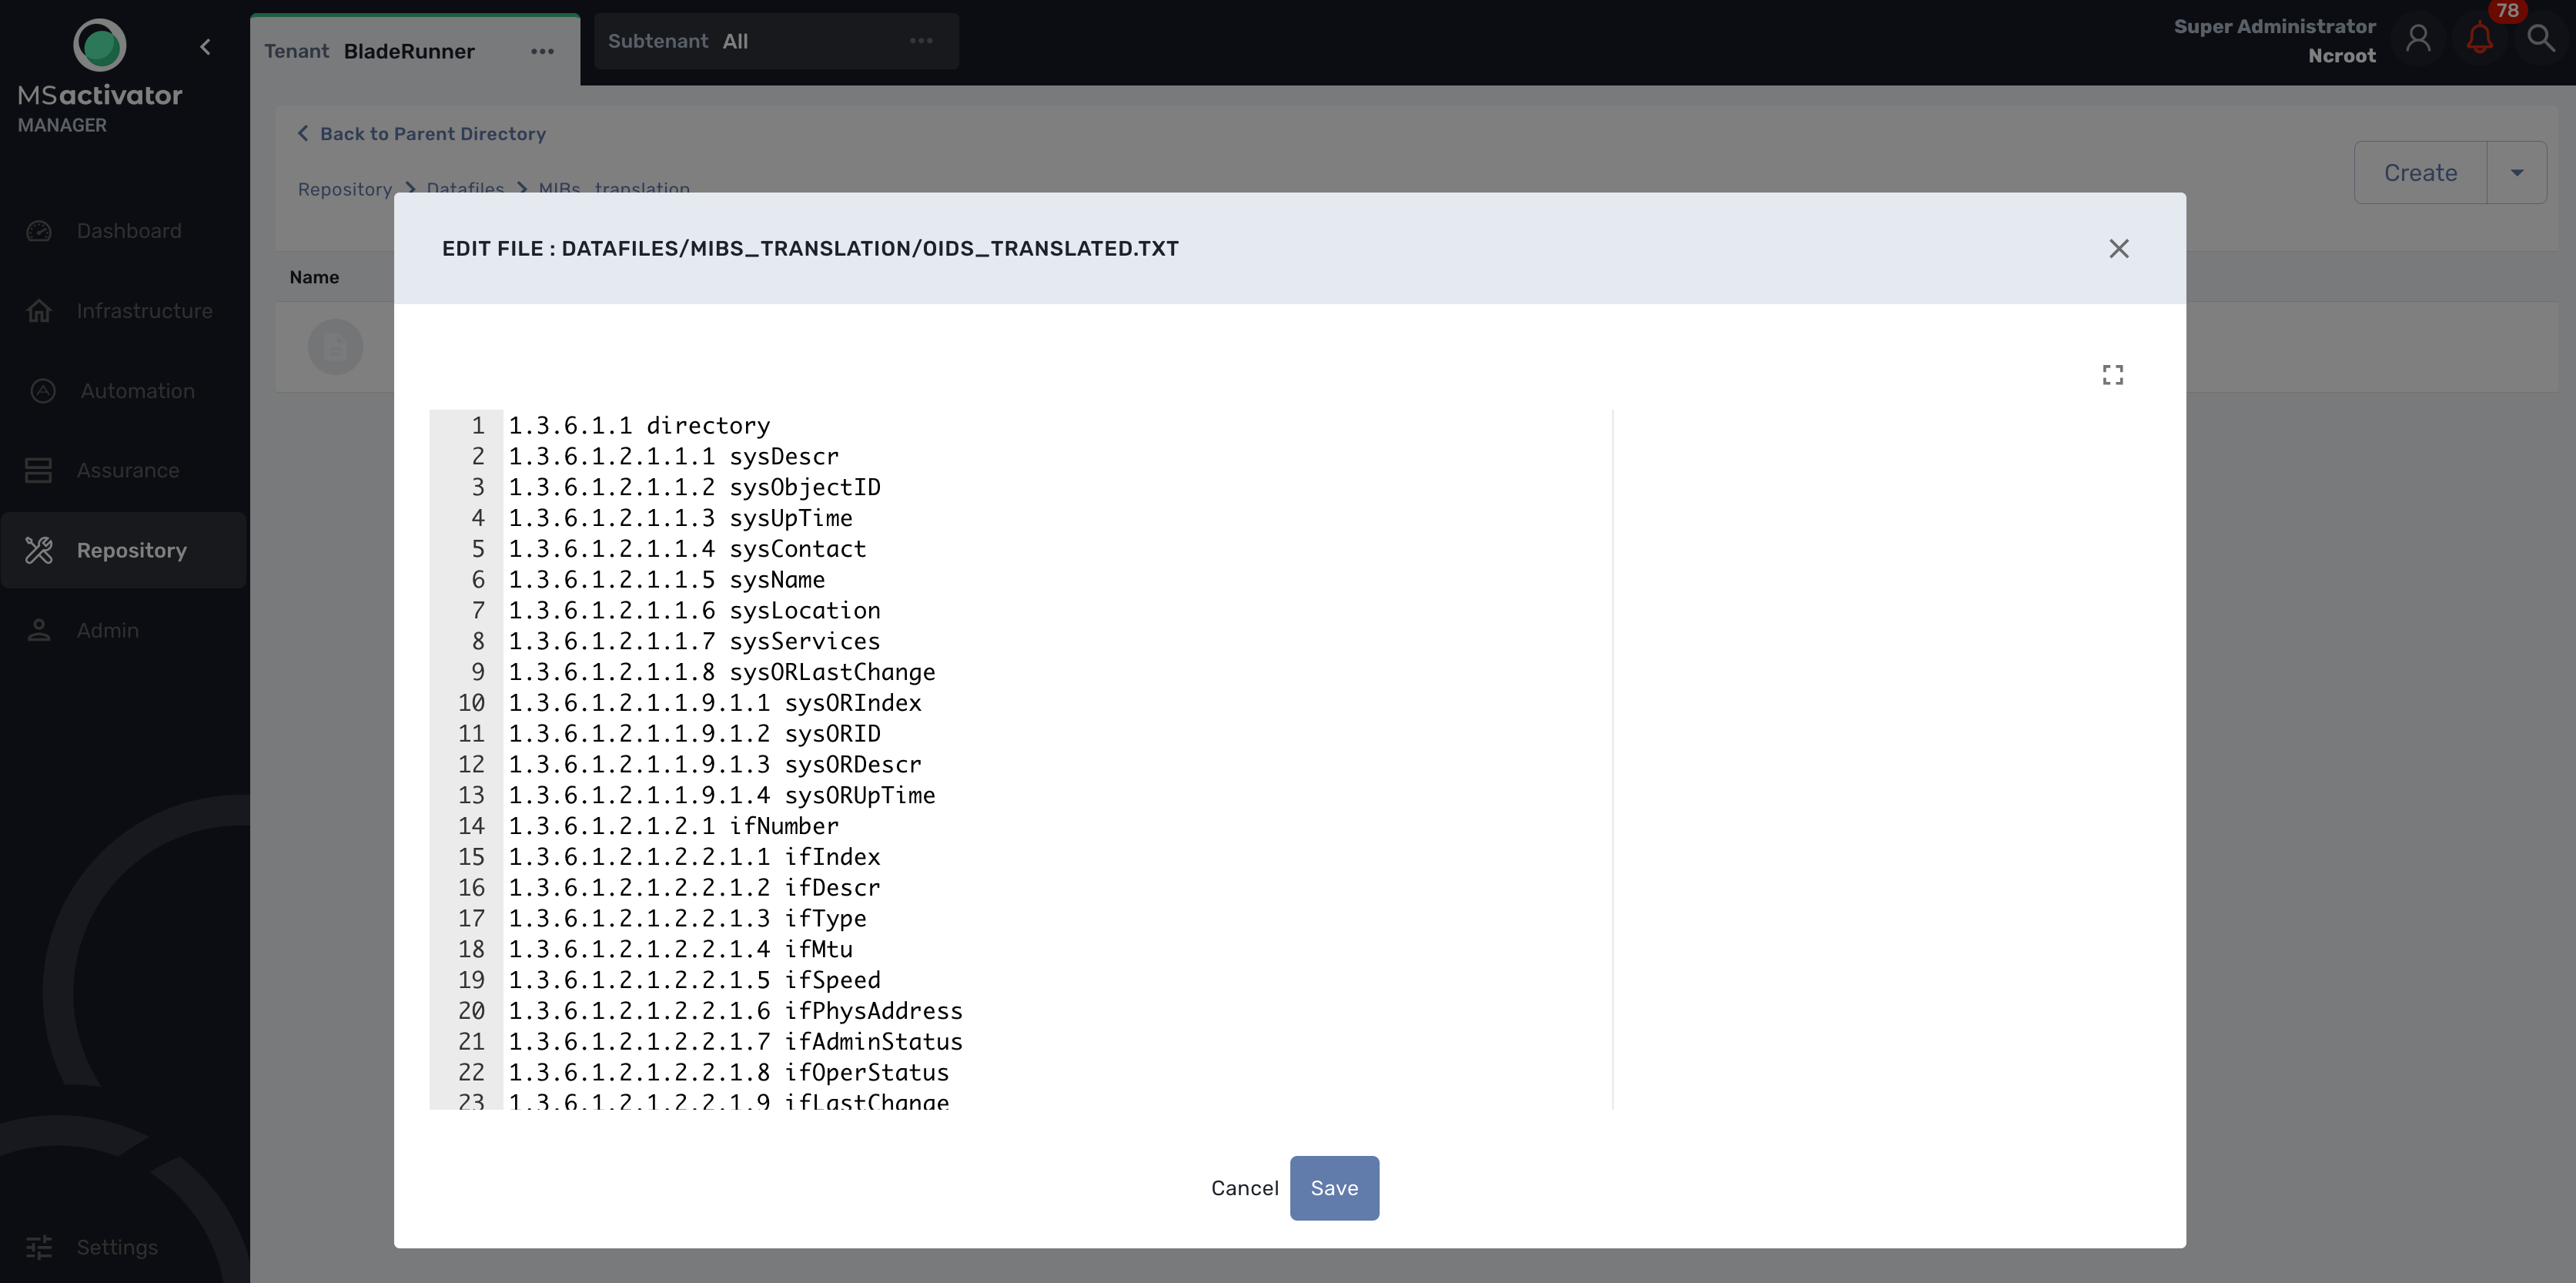
Without the translation, the UI shows
With the translation of 1.3.6.1.2.1.1.6 to sysLocation
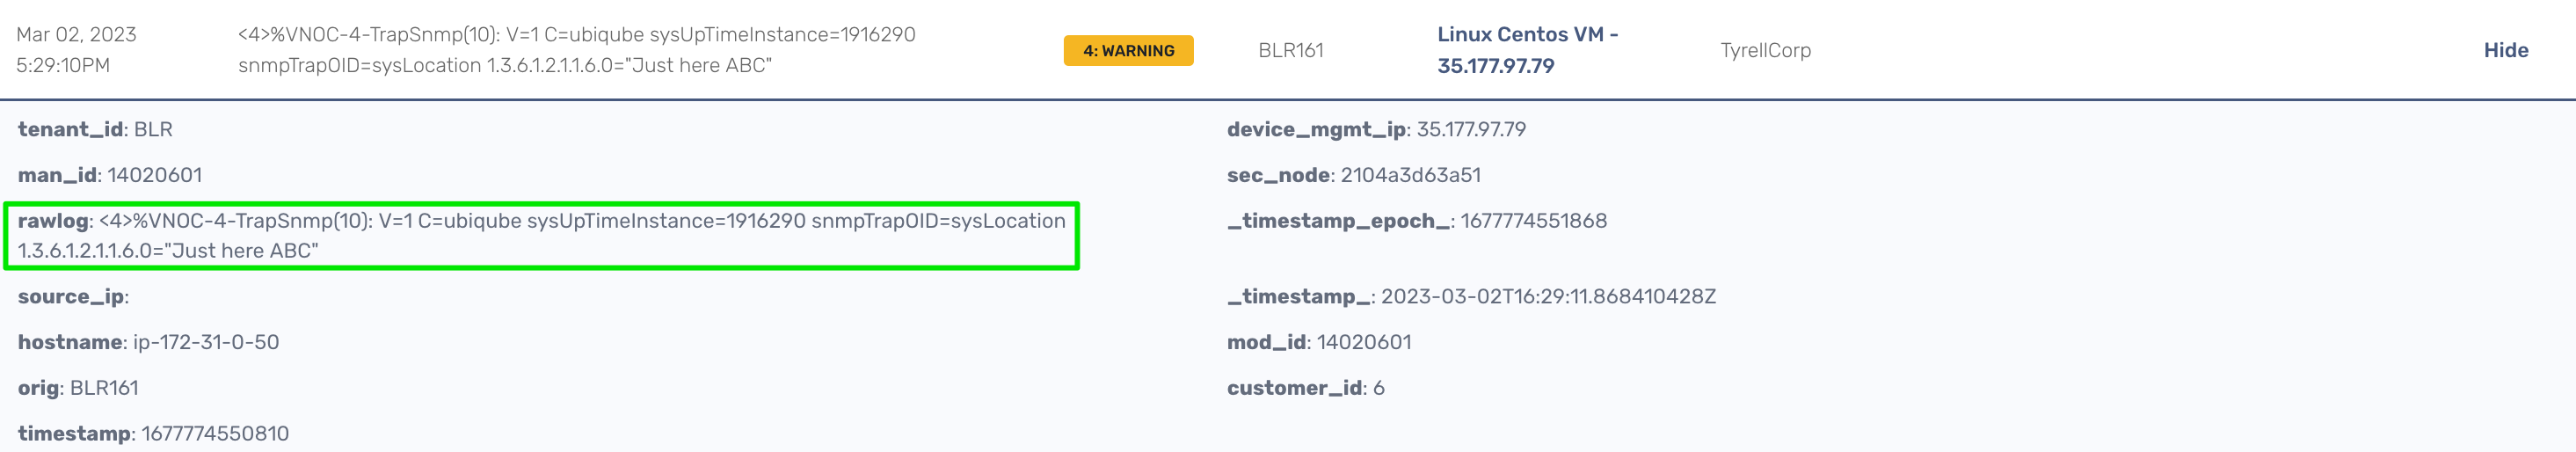
With a custom translation of 1.3.6.1.2.1.1.6 to MyCustomSysLocation
Log analytics
Overview
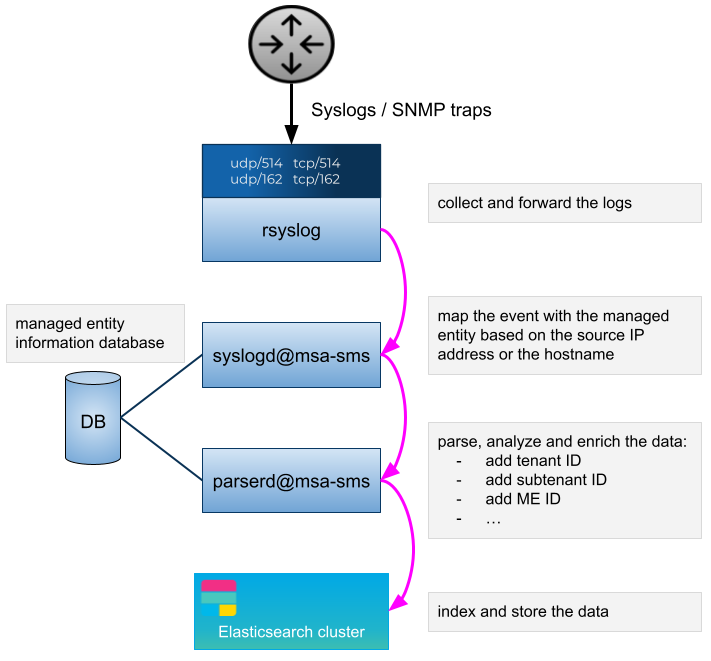
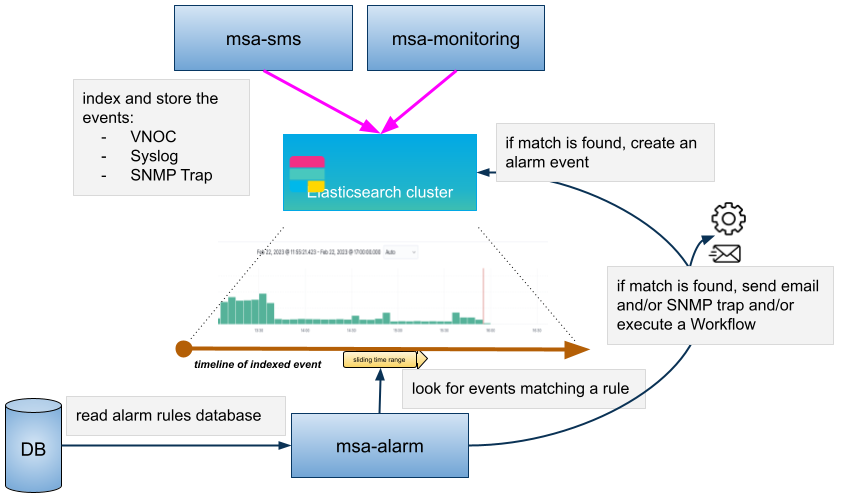
The MSactivator™ can collect, index and store events received from the managed entities. Once indexed, the logs are fully searchable from the user interface.
The diagram below shows the syslog processing steps from the device to Elasticsearch.
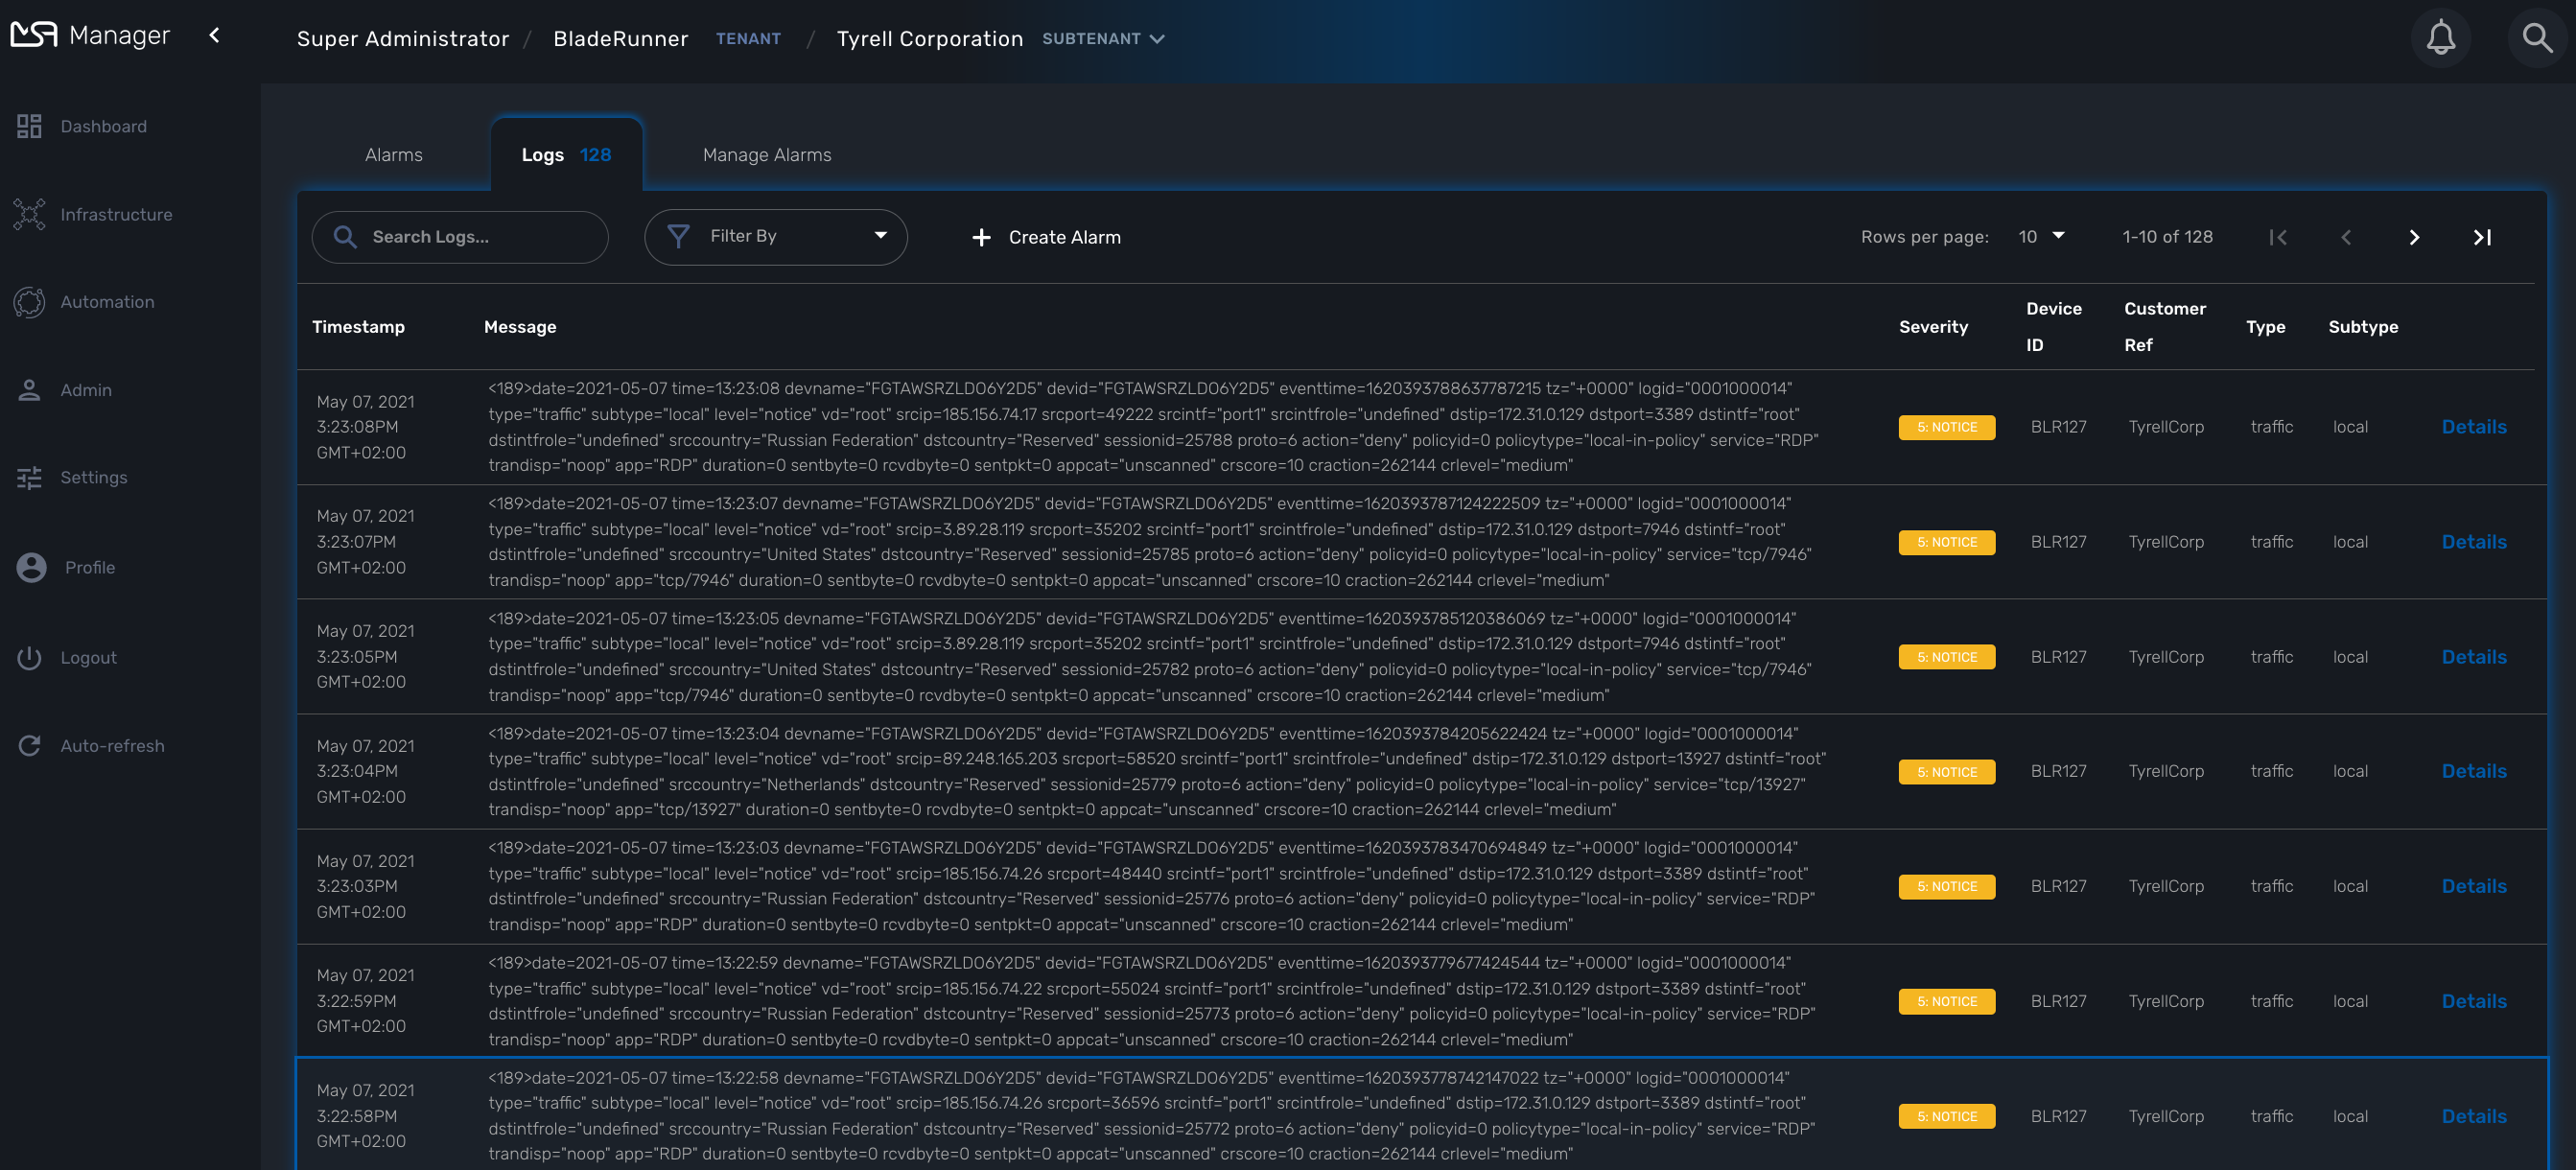
Search logs
To view and search the logs you can either access the global log and alarm view by clicking on the bell icon at the screen top right or by browsing to a specific managed entity and selecting the tab "Logs"
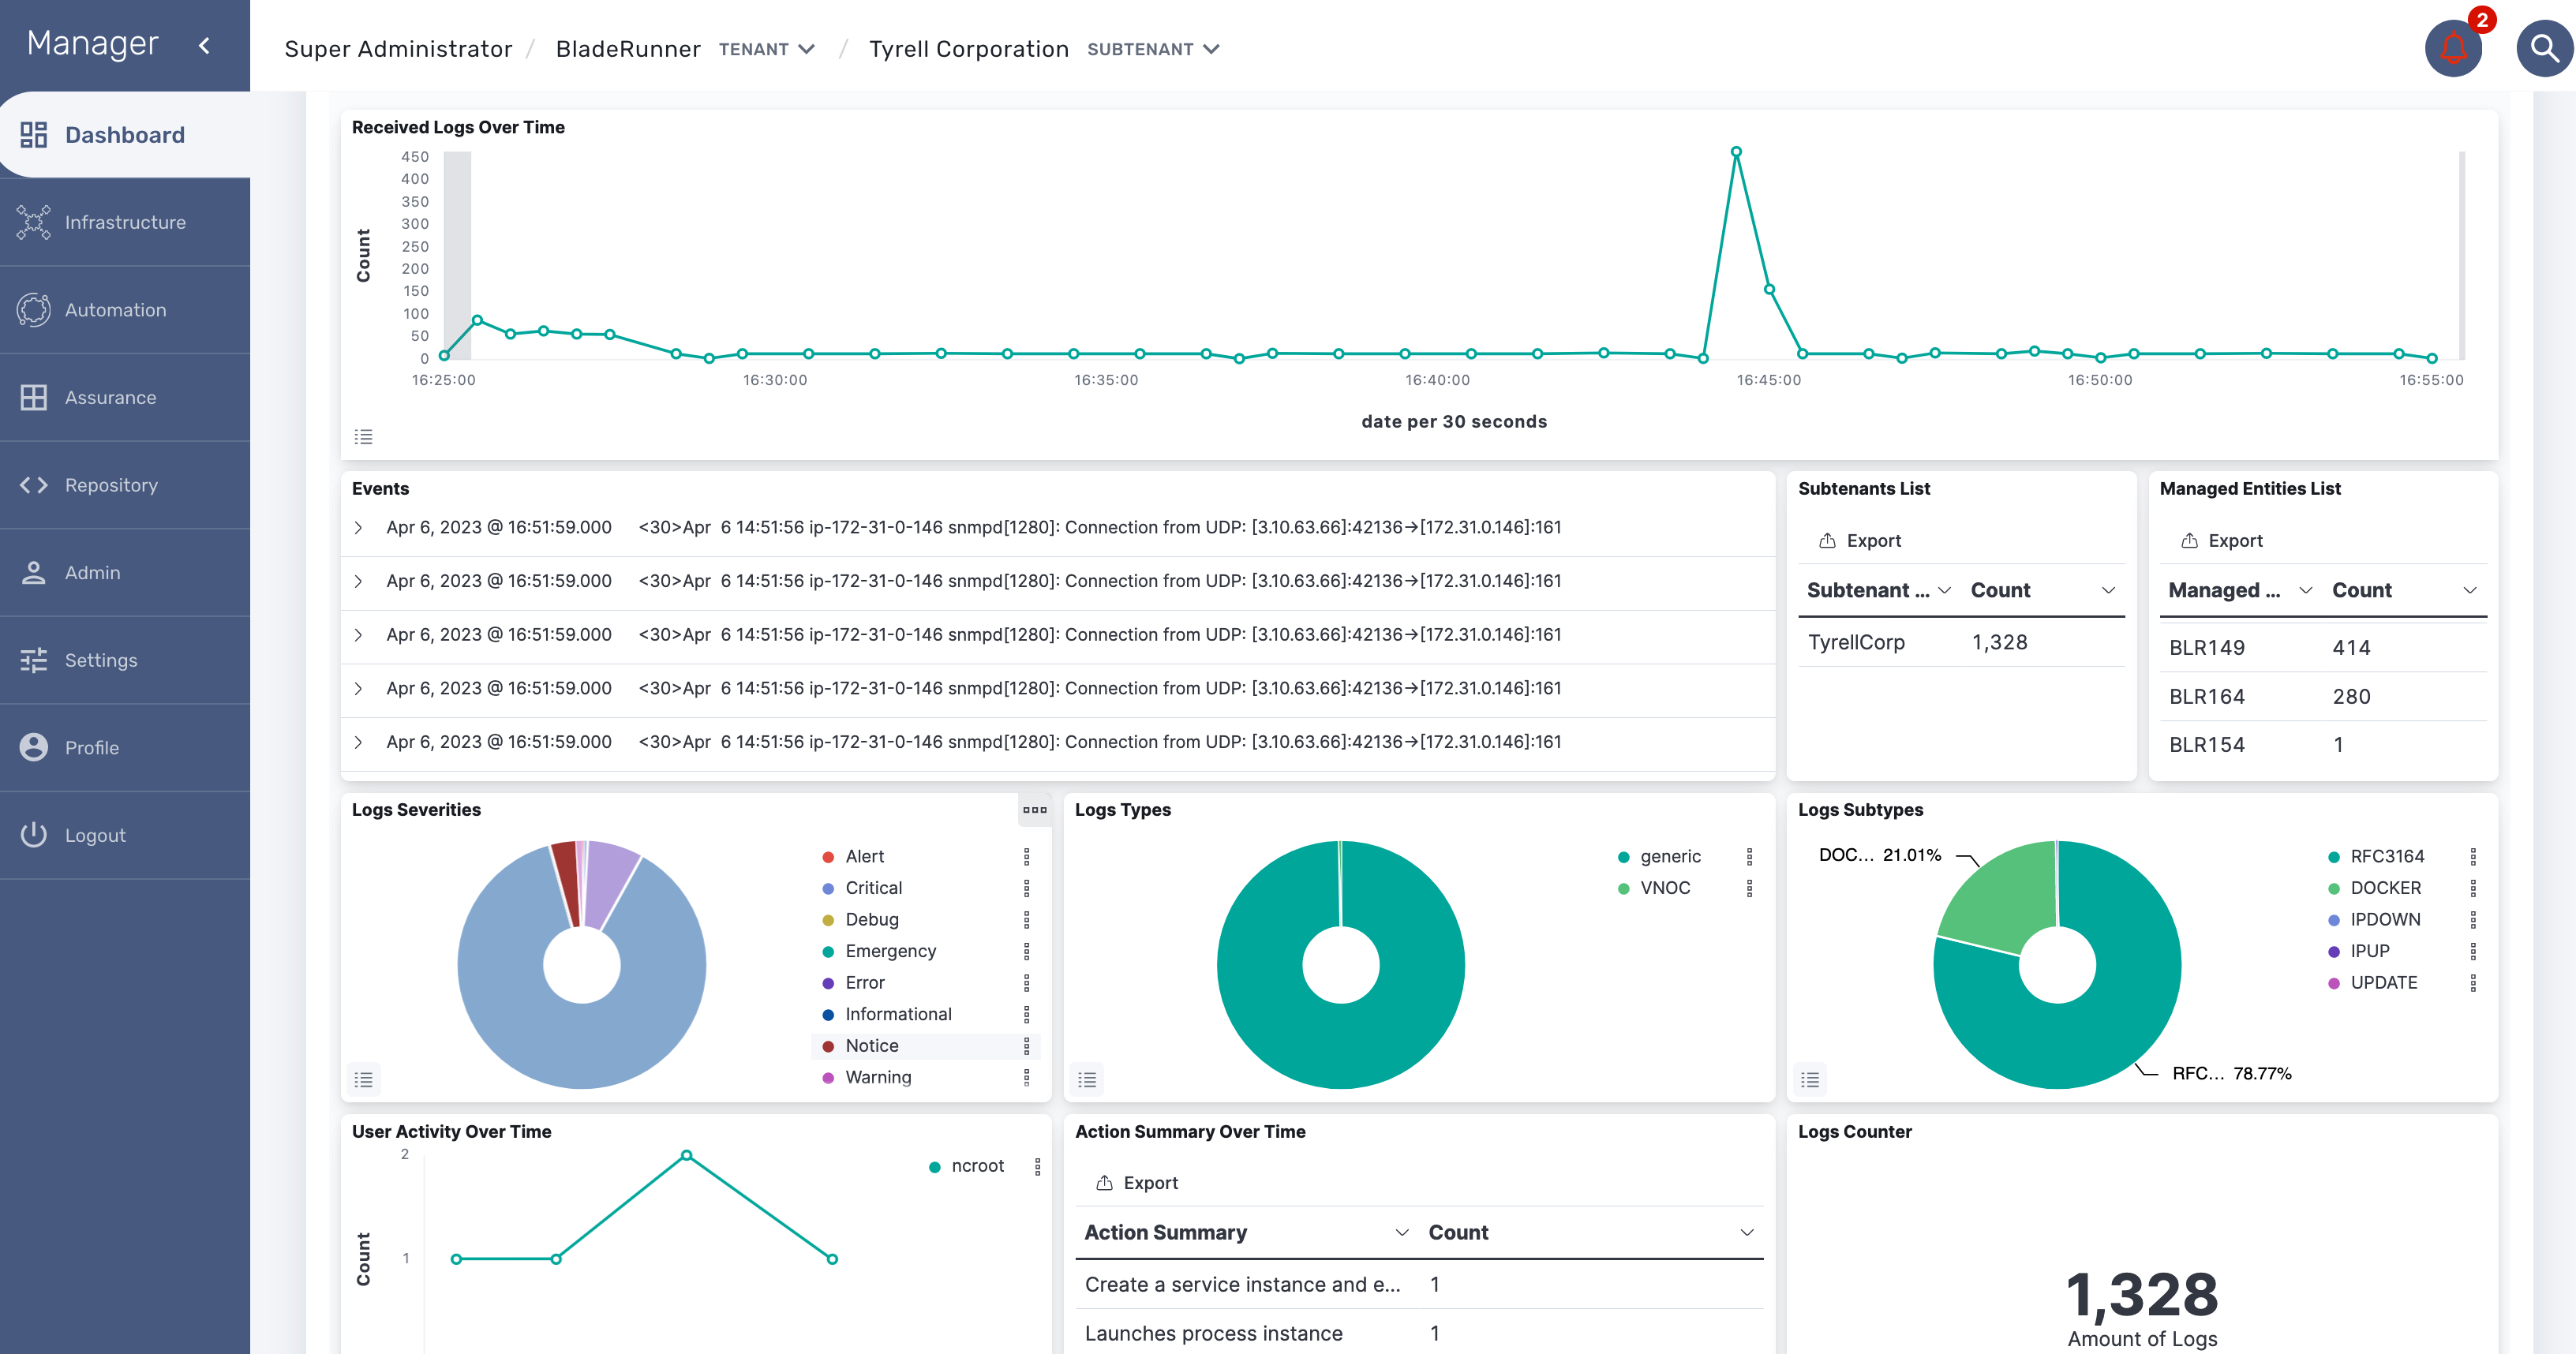
Dashboard
Dashboard will allow you to visualize the data store in Elasticsearch
You can access Kibana on port 5601 (https://localhost:5601/kibana) and use Kibana to:
-
discover the data indexed and stored in Elasticsearch
-
create your own dashboard templates
-
reuse or edit the dashboard included in the MSactivator™
Deploy an existing dashboard for a subtenant
You can use the workflow "Deploy Dashboard" to deploy the dashboards packaged in the MSactivator™.
Use the Kibana URL from the workflow instance to browse to the Kibana dashboard
Alarm
Overview
The alarm management module is based on the detection of events which internal (VNOC), SNMP thresholds, or sylogs sent by the managed devices and collected by the MSactivator™. Alarm management is designed to provide email notifications to customers or managers or administrator
The detection of events relies on rules configured at the super administrator level.
Rule management is available for the super administrator (ncroot). The rules are defined globally and can be modified by the operation team.
The infrastructure management team can modify the setting of the notifications on a per-event and/or per-subtenant basis. The rules are executed on a periodic basis (the period frequency can be configured) and alarms are generated whenever a rule matches.
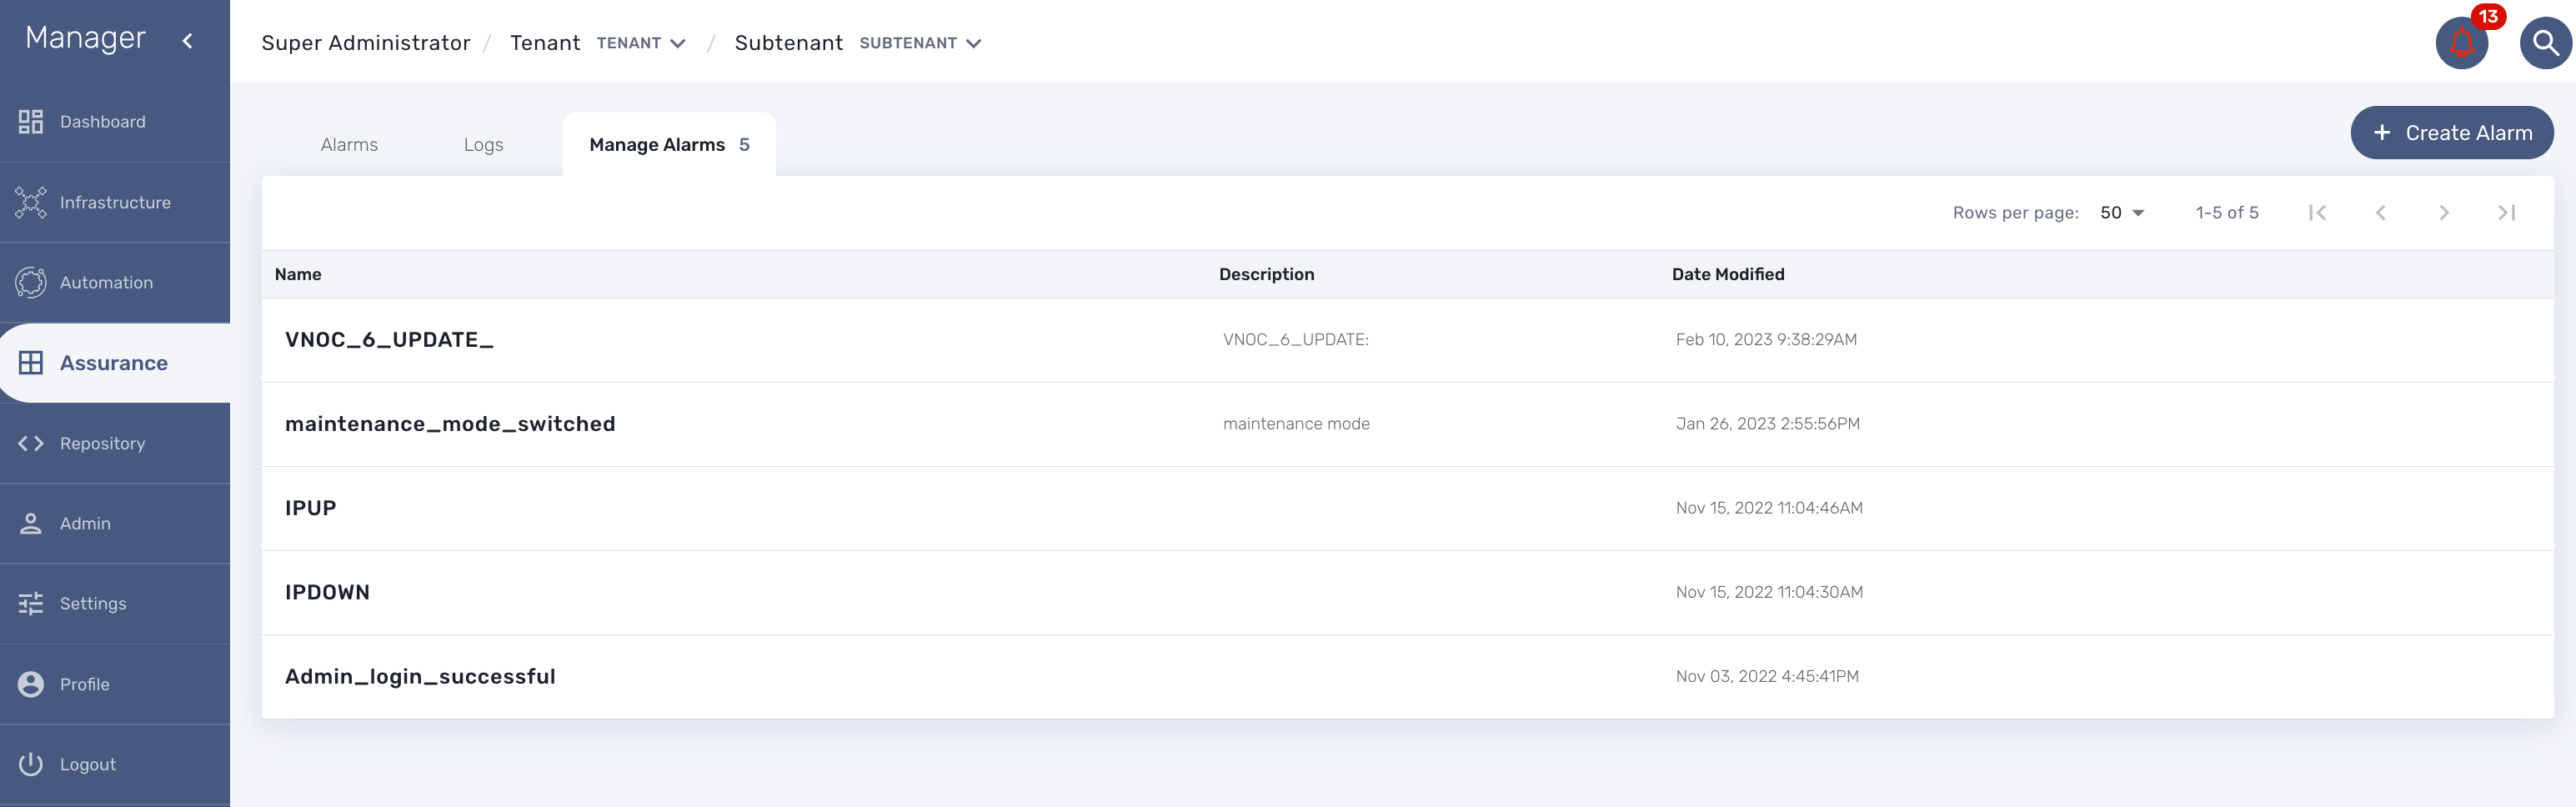
Manage alarm rules
The Alarm management screen is available by clicking on the bell icon on the top right of the screen.
Alarm Rule can be created from the Manage Alarms tab, as show in the below screen shot. Alarm Name should be Unique across the MSactivator™ and it should not contain space.
Create or edit an alarm
Alarm creation contains Four sections below
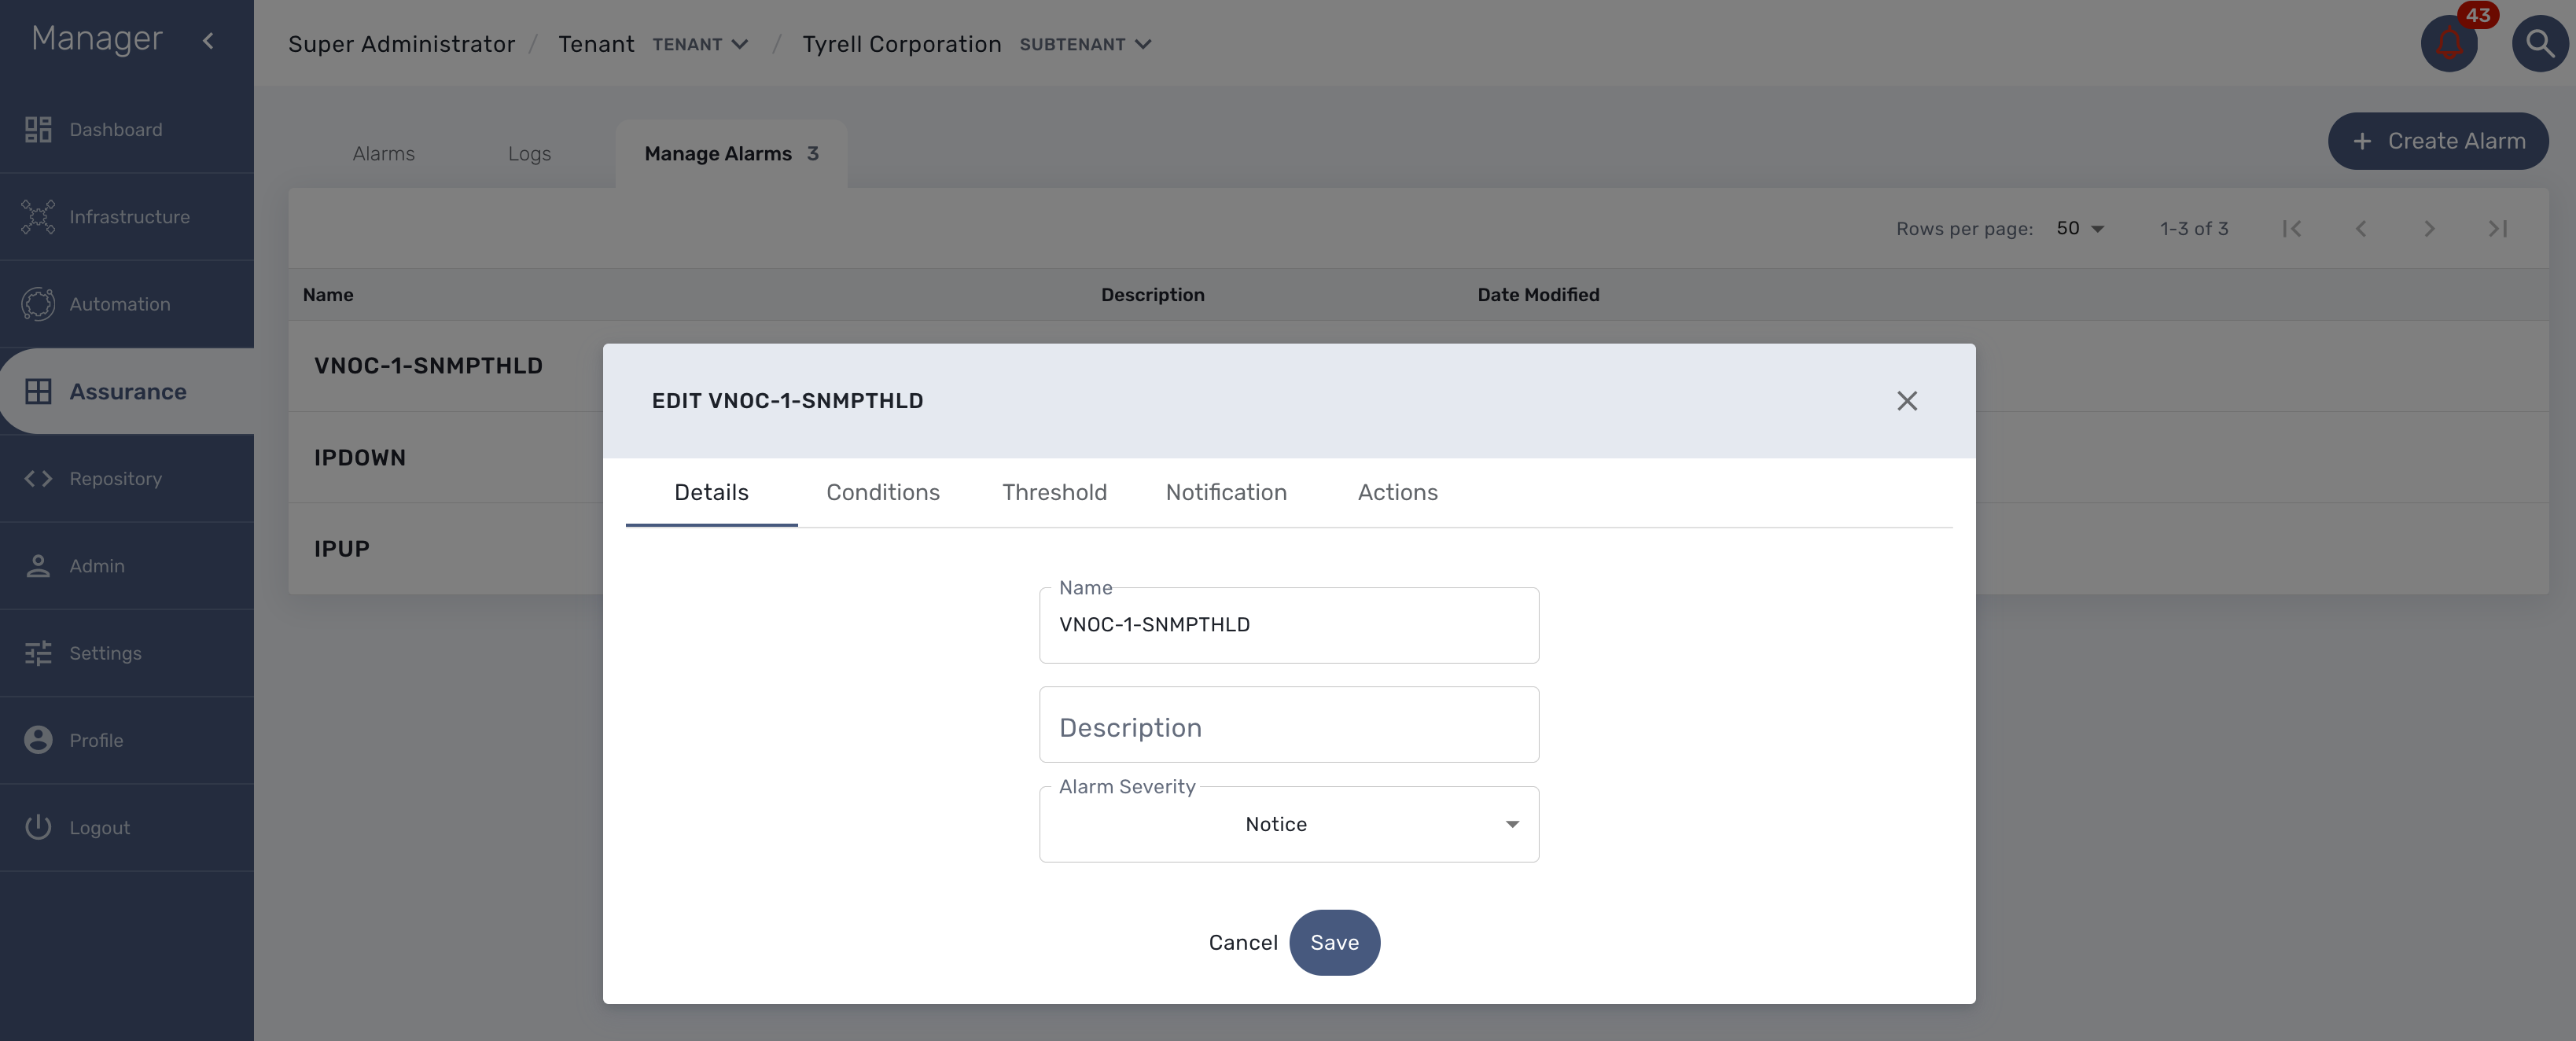
Detail
Provide a name for the alarm and the alarm severity.
Alarm severity selection will allow you to decide what will be the severity of the alarm.
Conditions
This is where we define the matching rules for the alarm.
A text that will used to search in the incoming logs to generate alarm.
If selected, the logs search for the alarm triggering will be considered only for the Manage Entity that belongs to that subtenant
If selected, the logs search for the alarm triggering will be considered only for that Manage Entity
If selected, alarm wil be triggered for the logs with only those Severities.
Threshold
Define the number of events and the time period to consider for triggering one workflow.
With the default value 0 log within 0 minute, no workflow process execution will be triggered so you need to set it at least as 1 log within 1 minute.
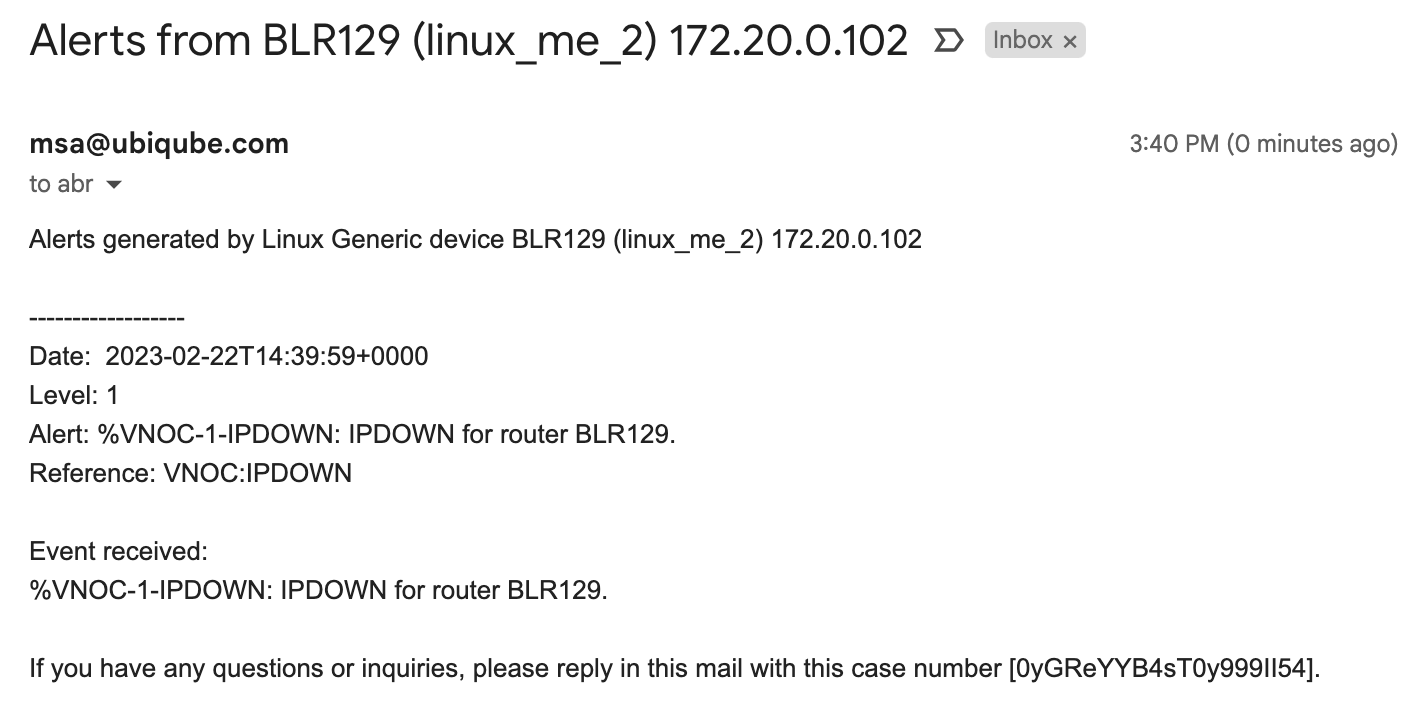
Notification
Select the user roles that will be notified by email when an alarm is raised.
| make sure that you have set an email to your user |
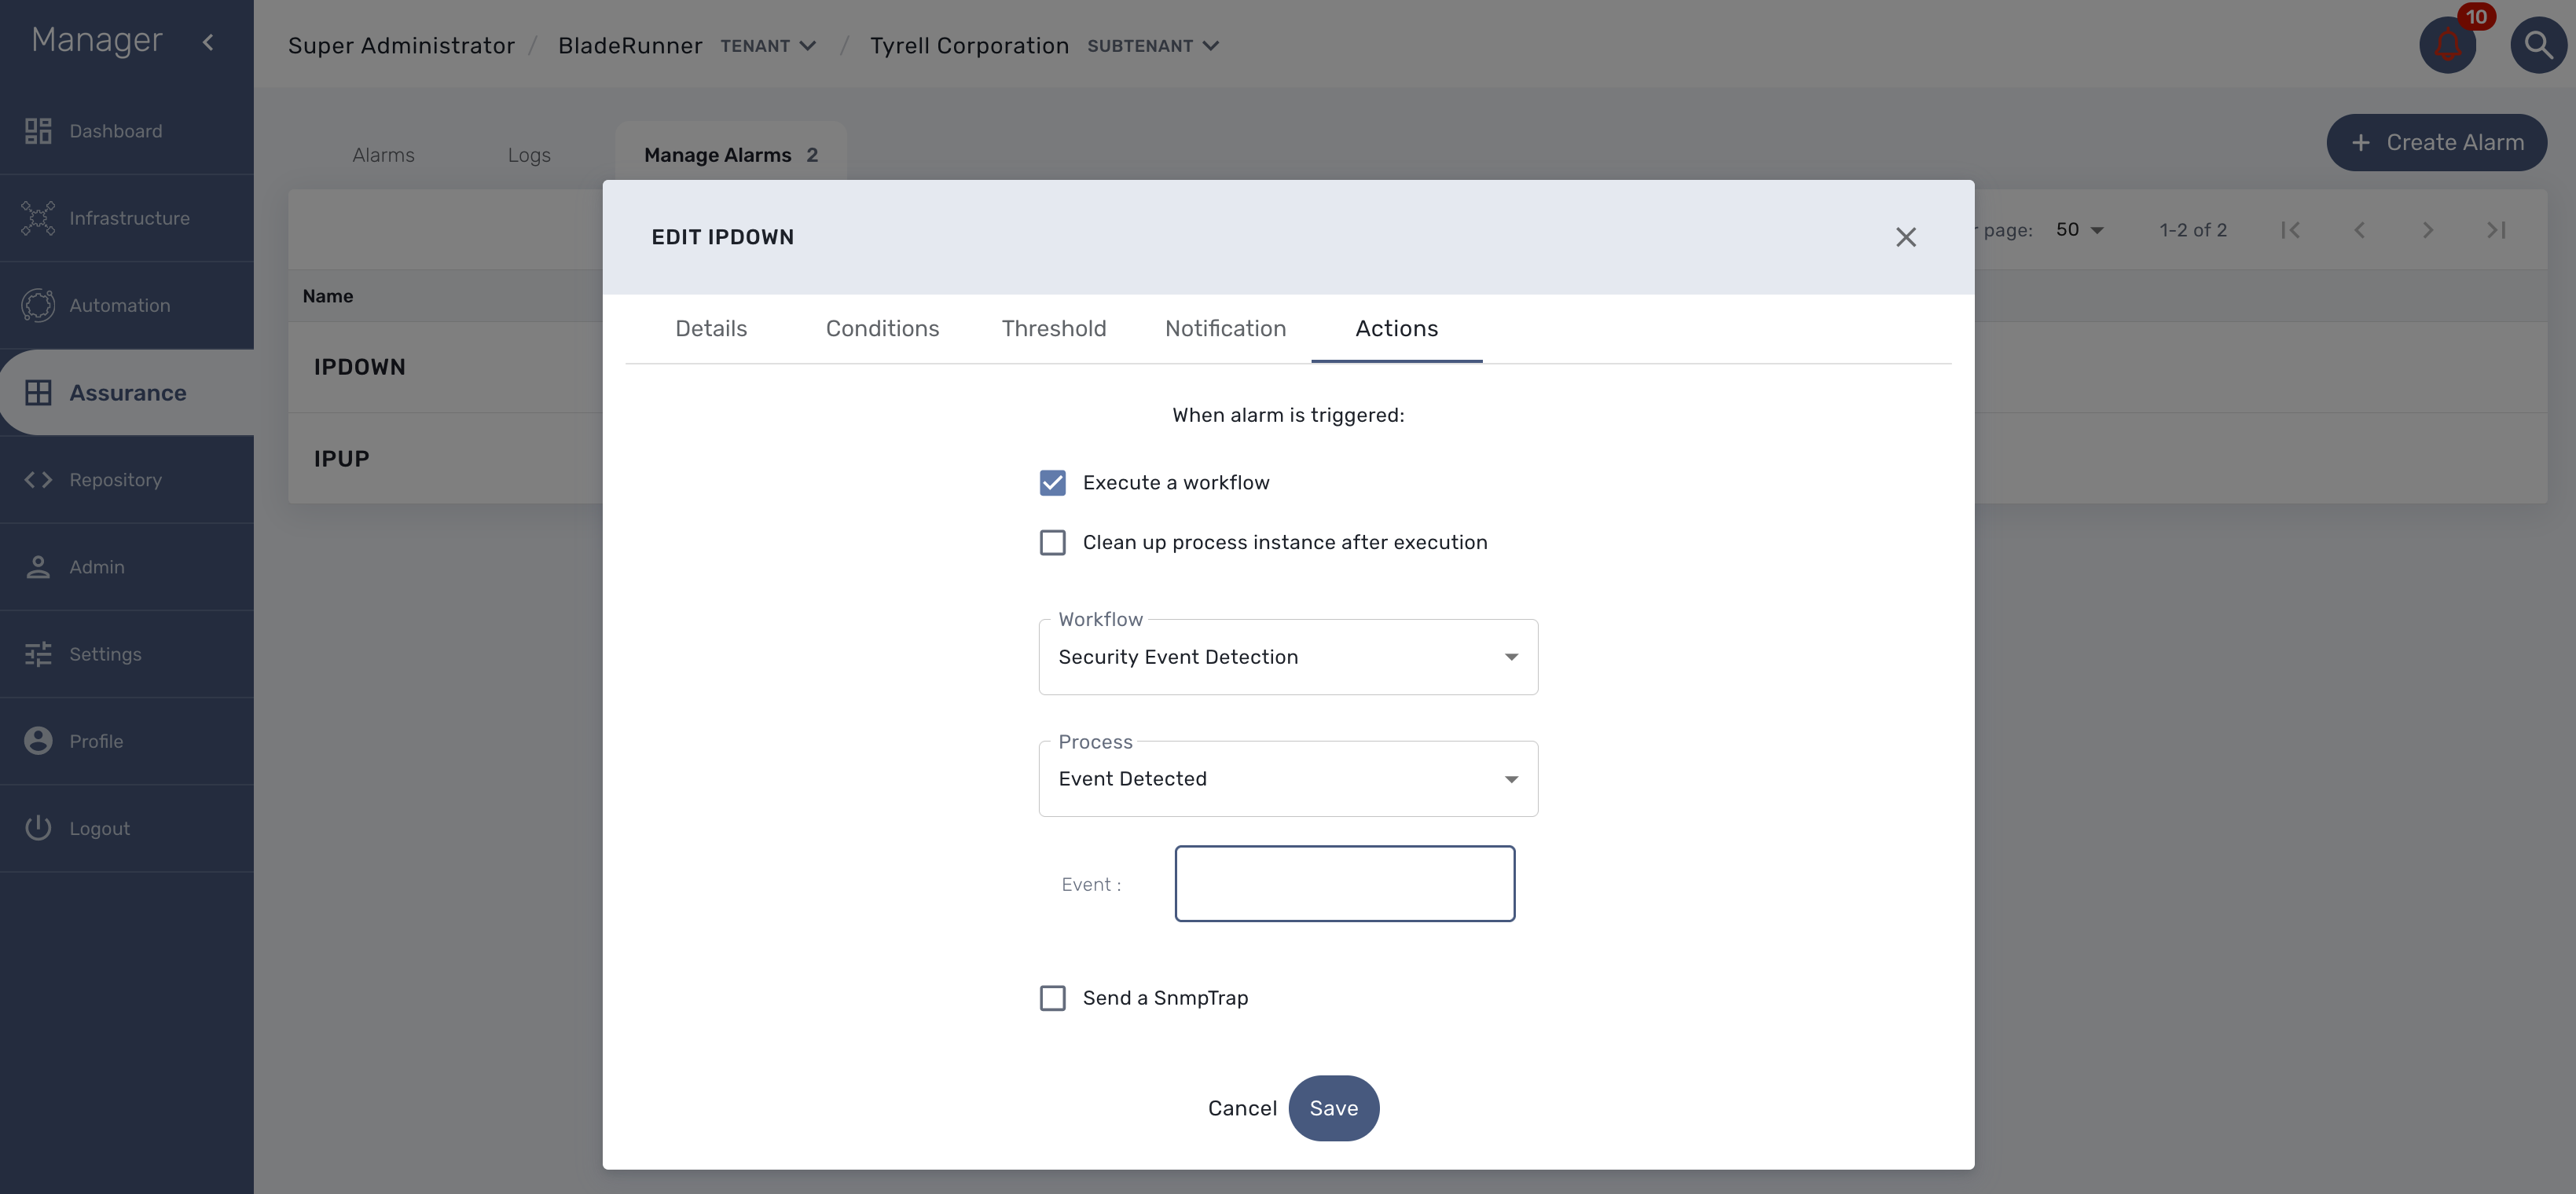
Actions
Choose the workflow and the process to execute when an alarm is triggered.
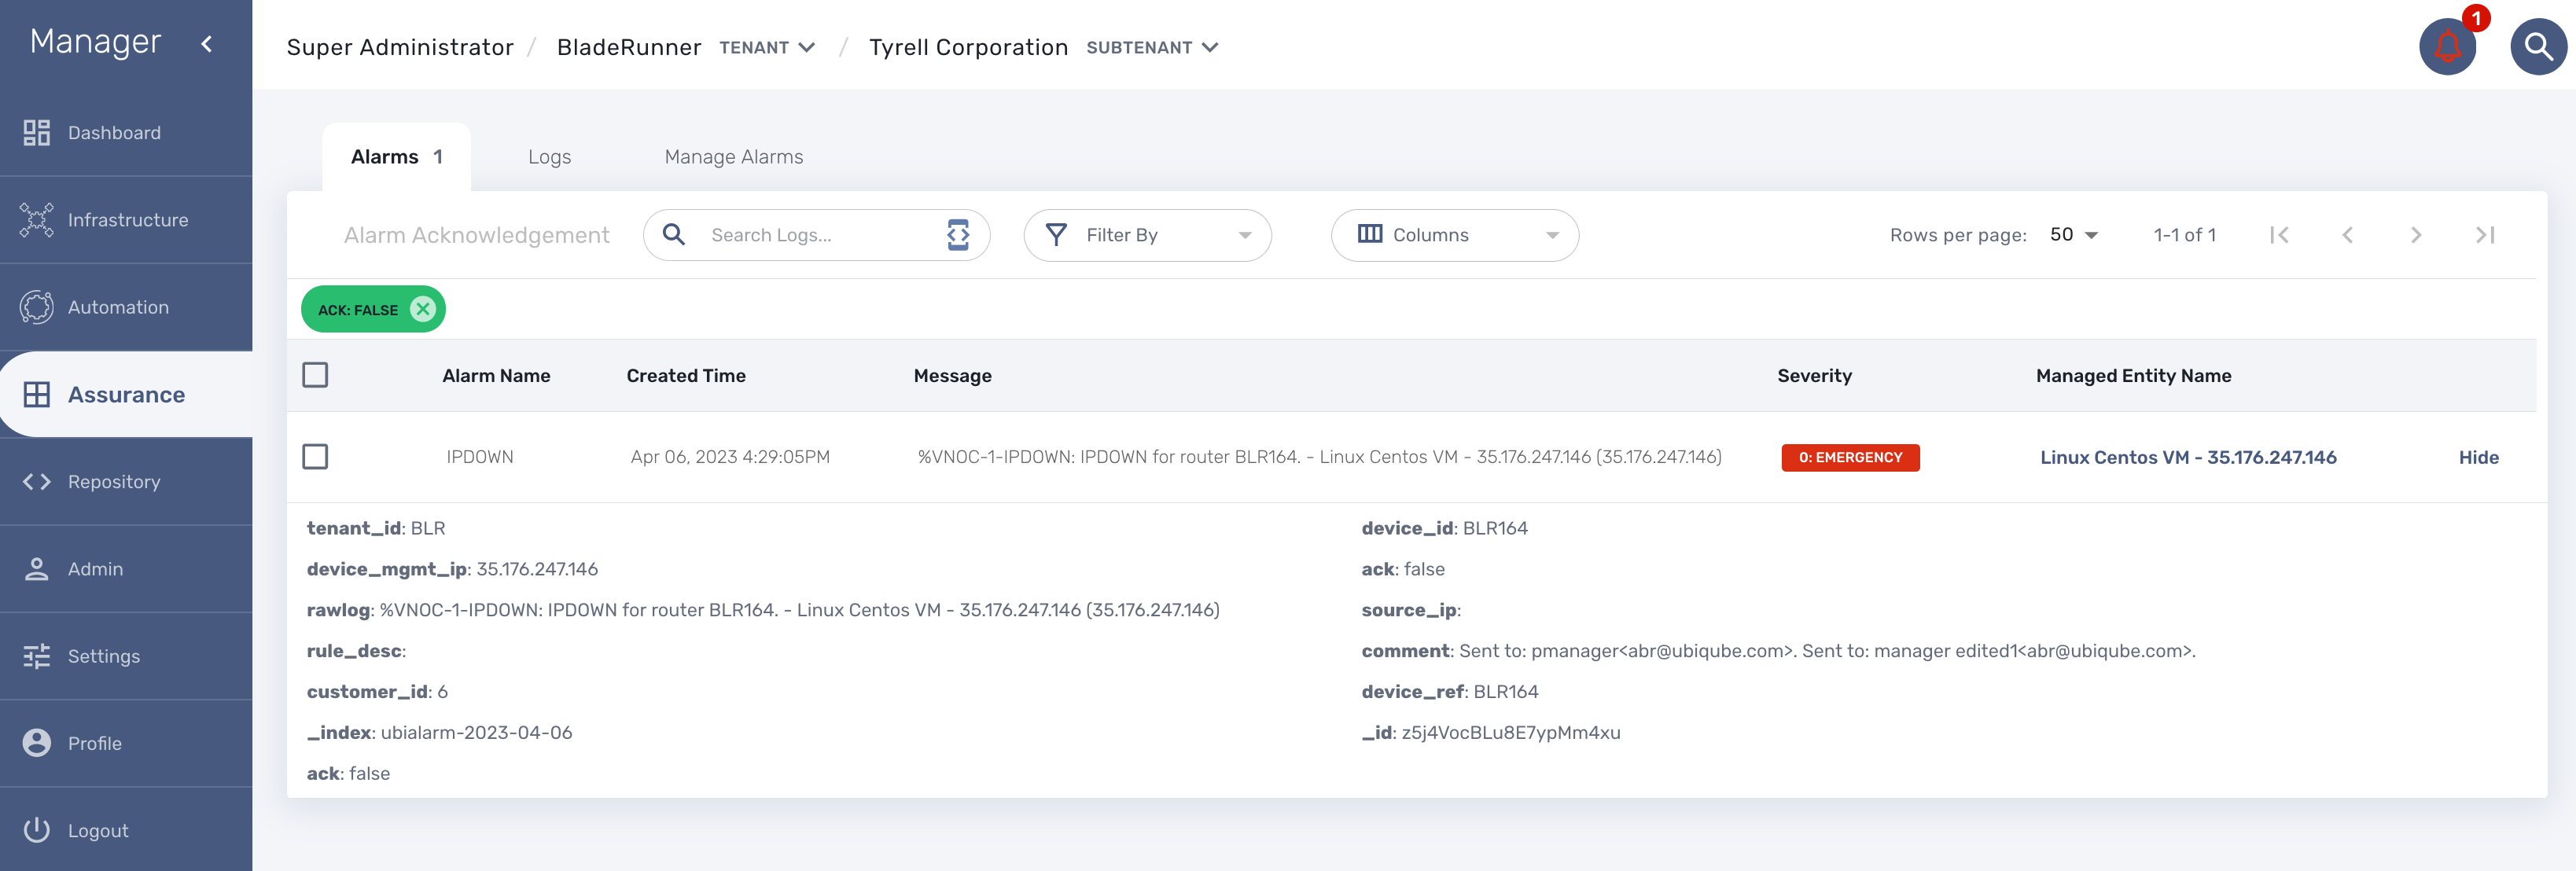
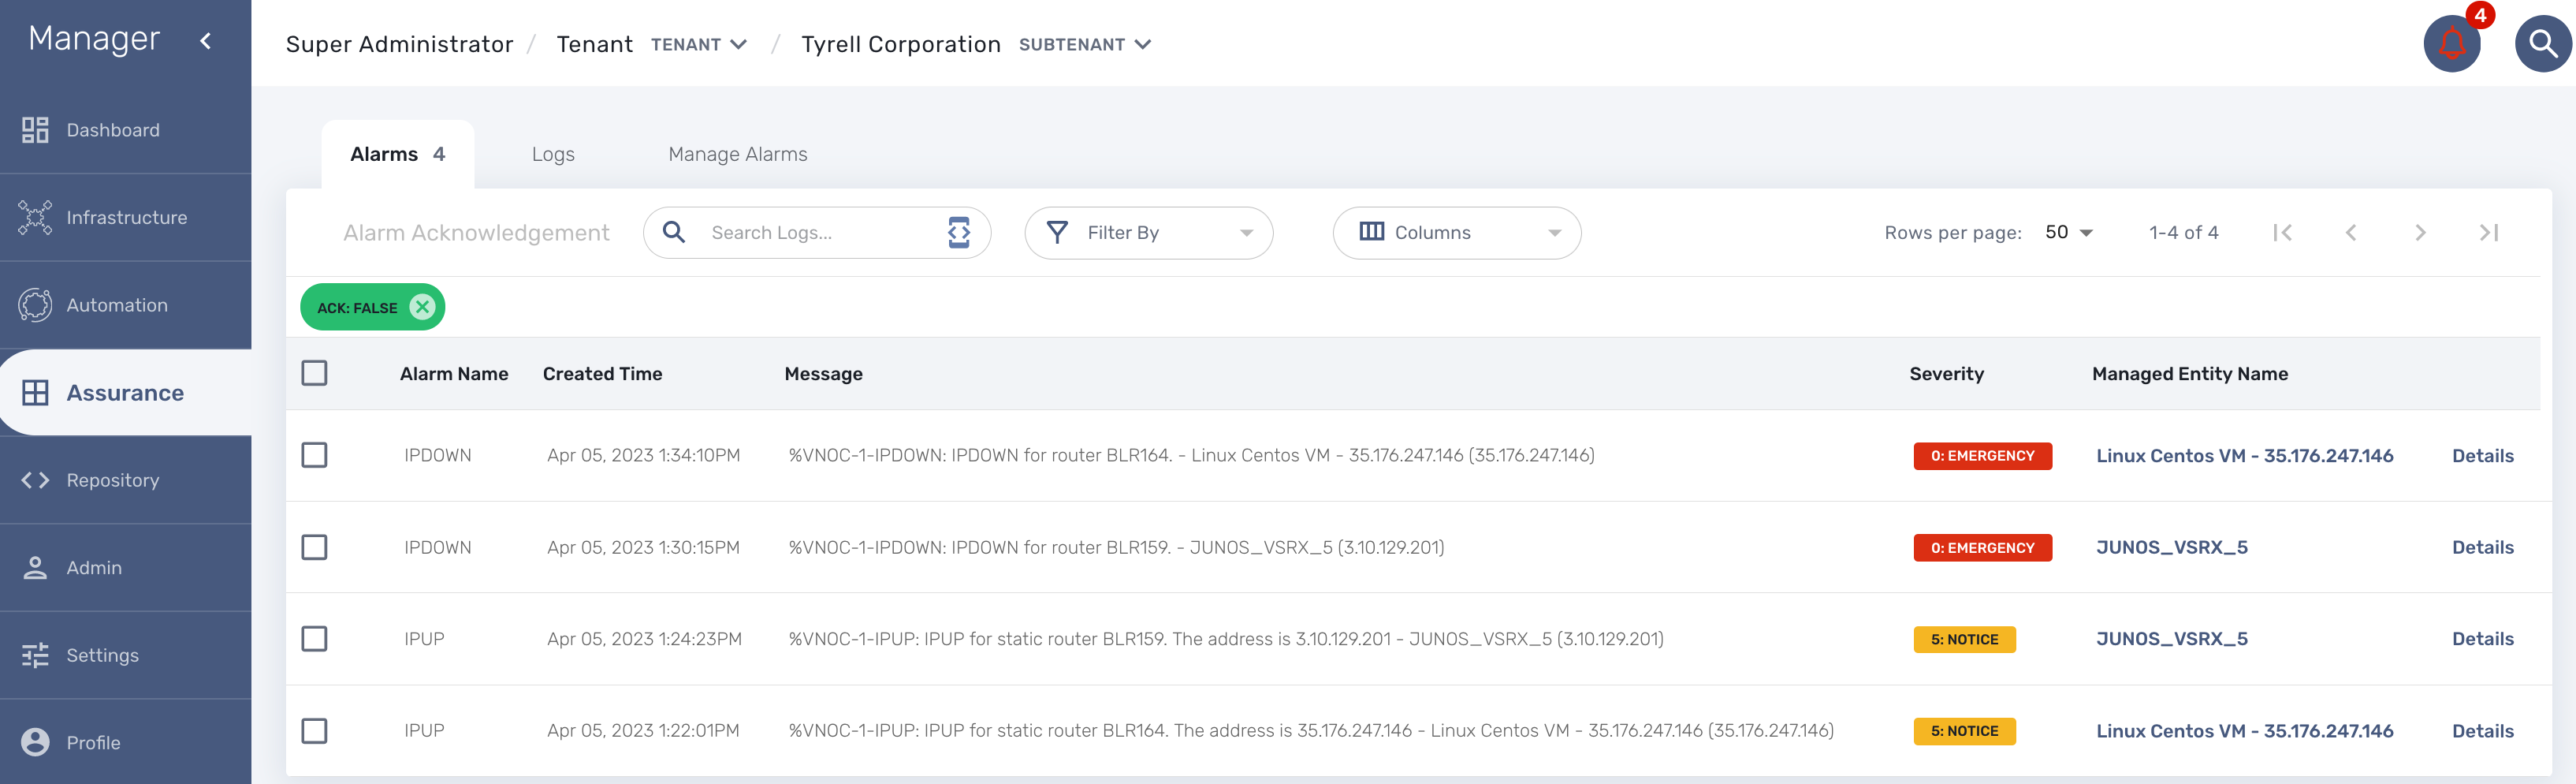
Alarm acknowledgement
As soon as an event is detected to be an alarm, a notification badge will appear at the top right of the screen showing the number of new alarm that require an user action (acknowledgement)
You have the possibility to edit an alarm, add a comment and acknowledge the alarm.
Testing
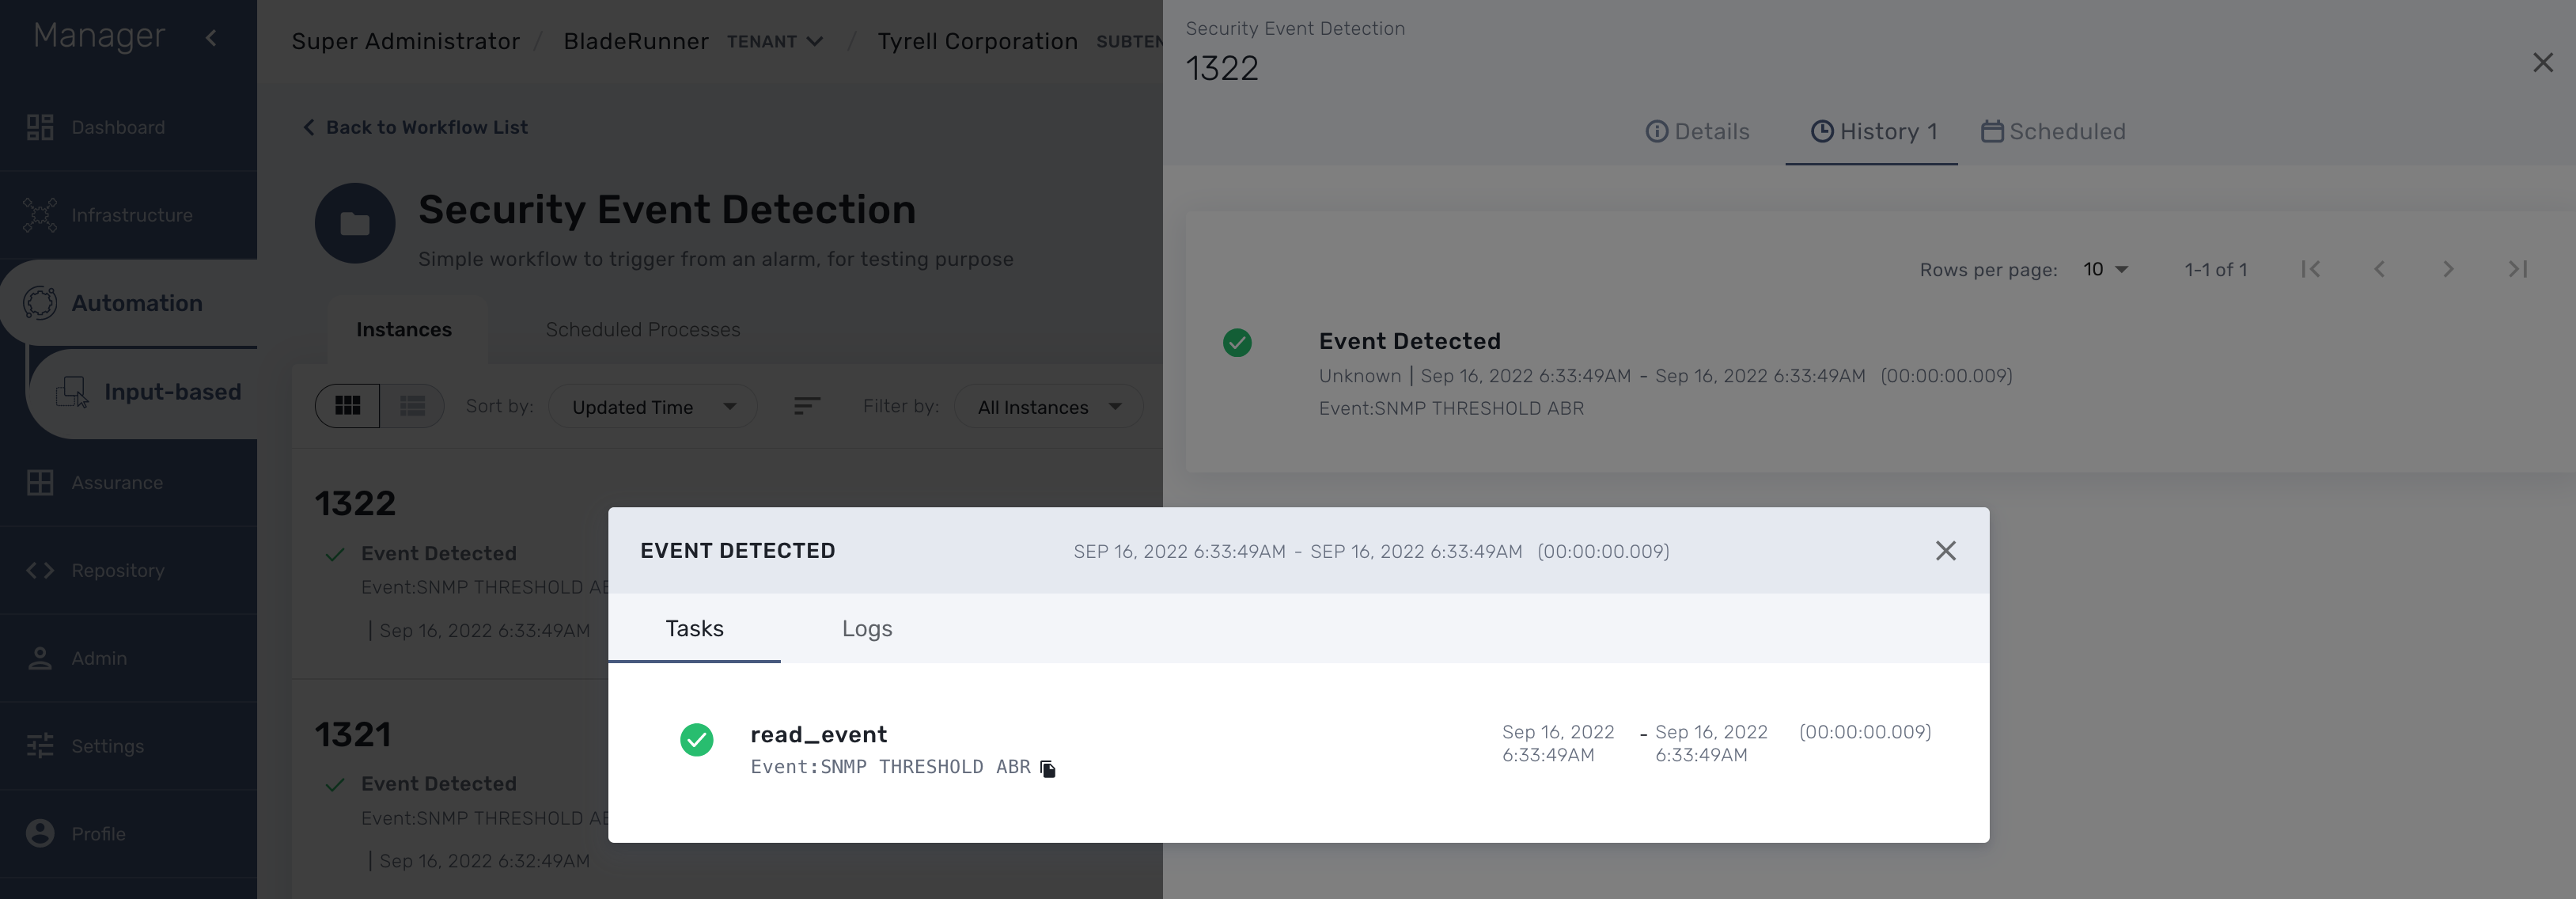
You can test the triggering of a process execution with the simple workflow "Security Event Detection" included in the mini-lab.
This workflow will execute a process to display the raw log that cause the alarm.
To trigger an event you can, for instance, stop one of the Linux container which will raise a IPDOWN event.
A new instance of the workflow should be created
Email alerting: SMTP configuration
For alarms to be notified as email, we need the Docker host to be properly configured as a SMTP server or relay.
Alarm severity tuning
An alarm severity can be tuned by choosing the severity of the alarm when editing the alarm rule.
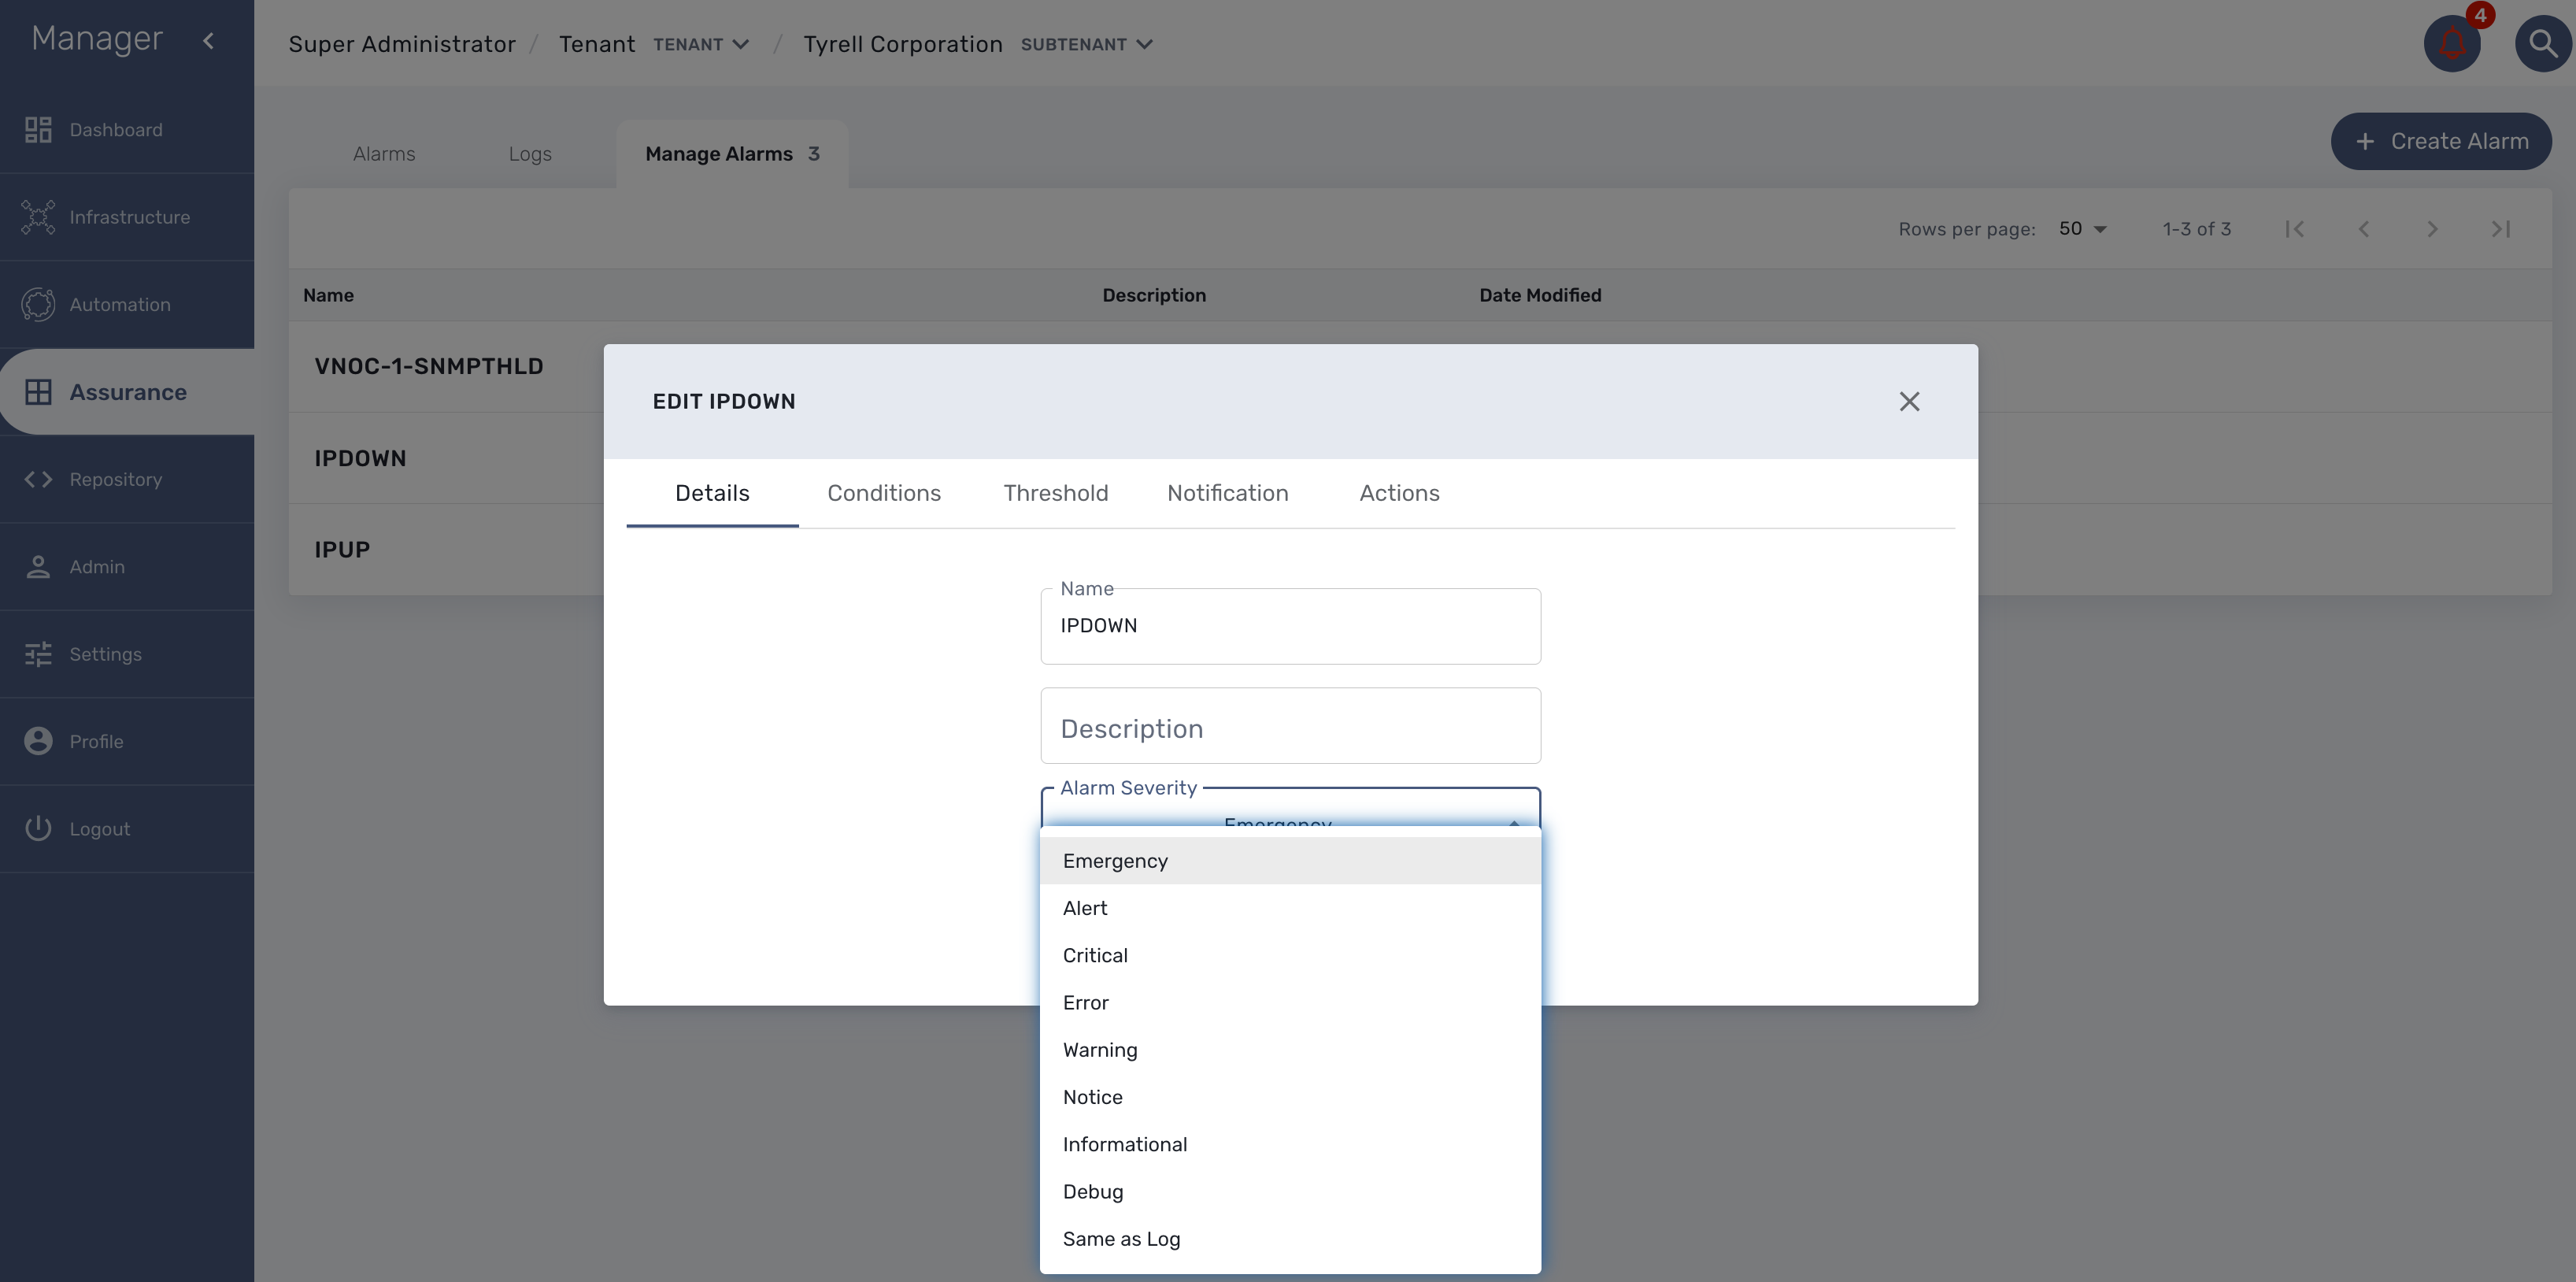
By default the alarm severity is the same as the severity of the source event but by selecting the severity, you can decide that an event with a high severity level should raise an alarm with a low severity level (or the other way around).
Example: it is possible to have an alarm rule to detect the VNOC event IPDOWN and configure the rule to have the highest level (Emergency) and an other alarm rule to detect the event IPUP with a lower severity (Informational)
This is very useful if SNMP traps are configured to be sent as you may not want to have all the SNMP traps detected with the same severity level.
Microservices
Microservices can be used to manage a wide variety of services on numerous types of devices, such as network equipment, virtualization infrastructure managers, or even Linux servers.
Overview
Any feature of any device can be managed with one or more microservices.
The MSactivator™ microservices engine is designed as an automation object-based programming language. Microservice designers define the variables and implement the Create | Read | Update | Delete method.
Such an open and agile approach is required to provide the abstraction layer on top of any device from the core to the edge.
The implementation of the functions allows us to create, update, or delete sub-parts of the configuration on our managed devices. A function can also be implemented to import the device configuration into the MSactivator™ configuration database.
Microservices can be used to manage a wide variety of services on numerous types of devices, such as network equipment, virtualization infrastructure managers, or even Linux servers.
Microservices can be designed graphically in the MSactivator™ developer portal.
Scripting is not mandatory but simple programming functions, such as conditional statements, loops, and variable assignments, is available to incorporate advanced function behaviors.
Select microservices
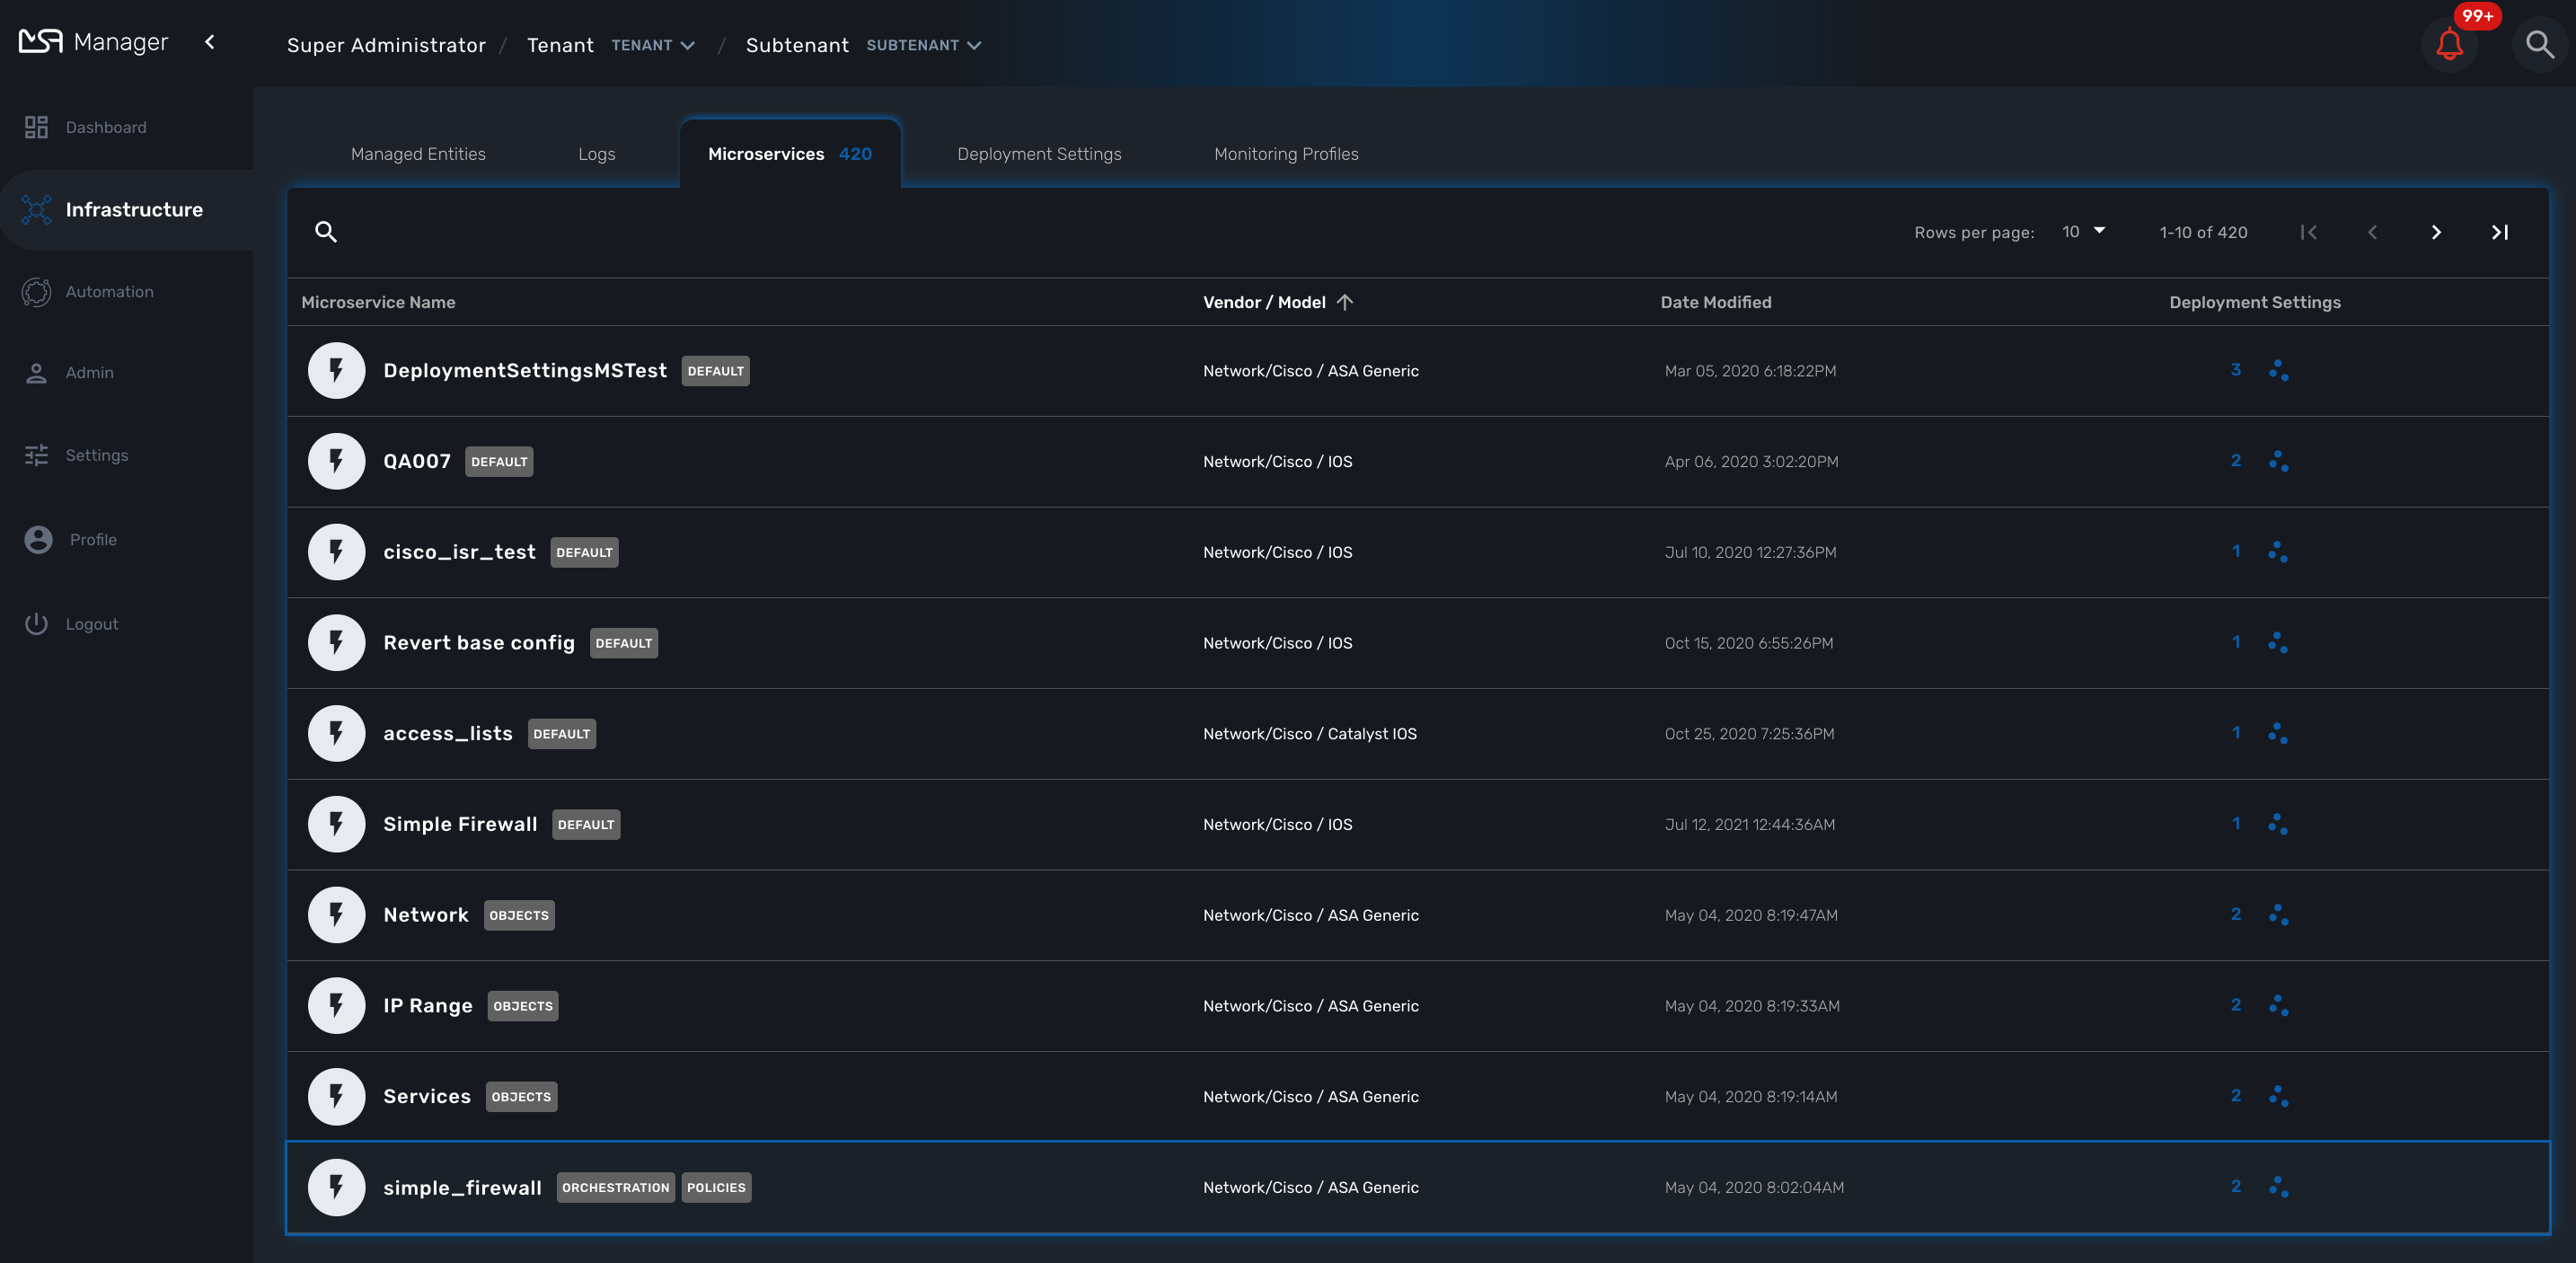
The list microservices available can be viewed by clicking on the "Infrastructure" link from the left menu.
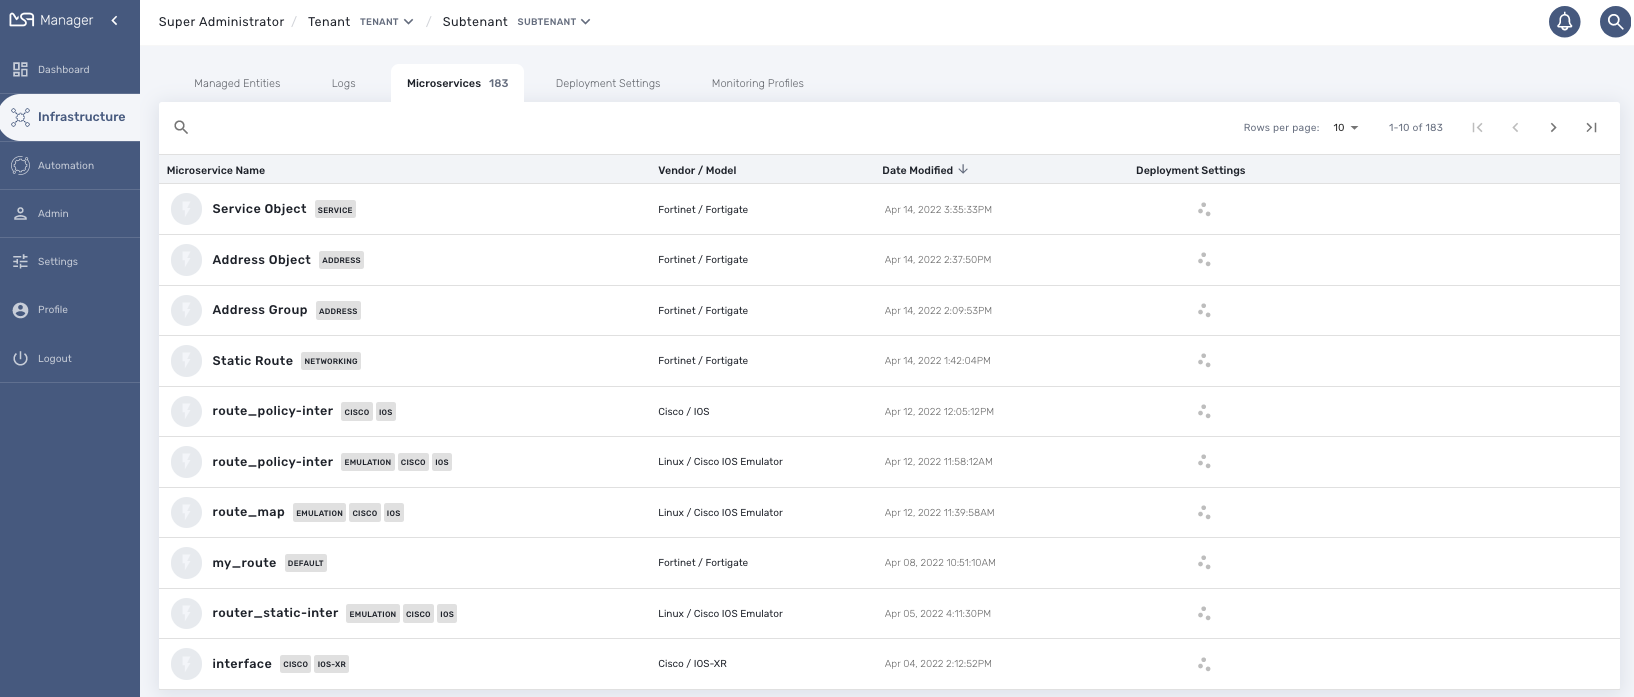
From this page you can search for a named microservice by using the search field with the magnifier icon.
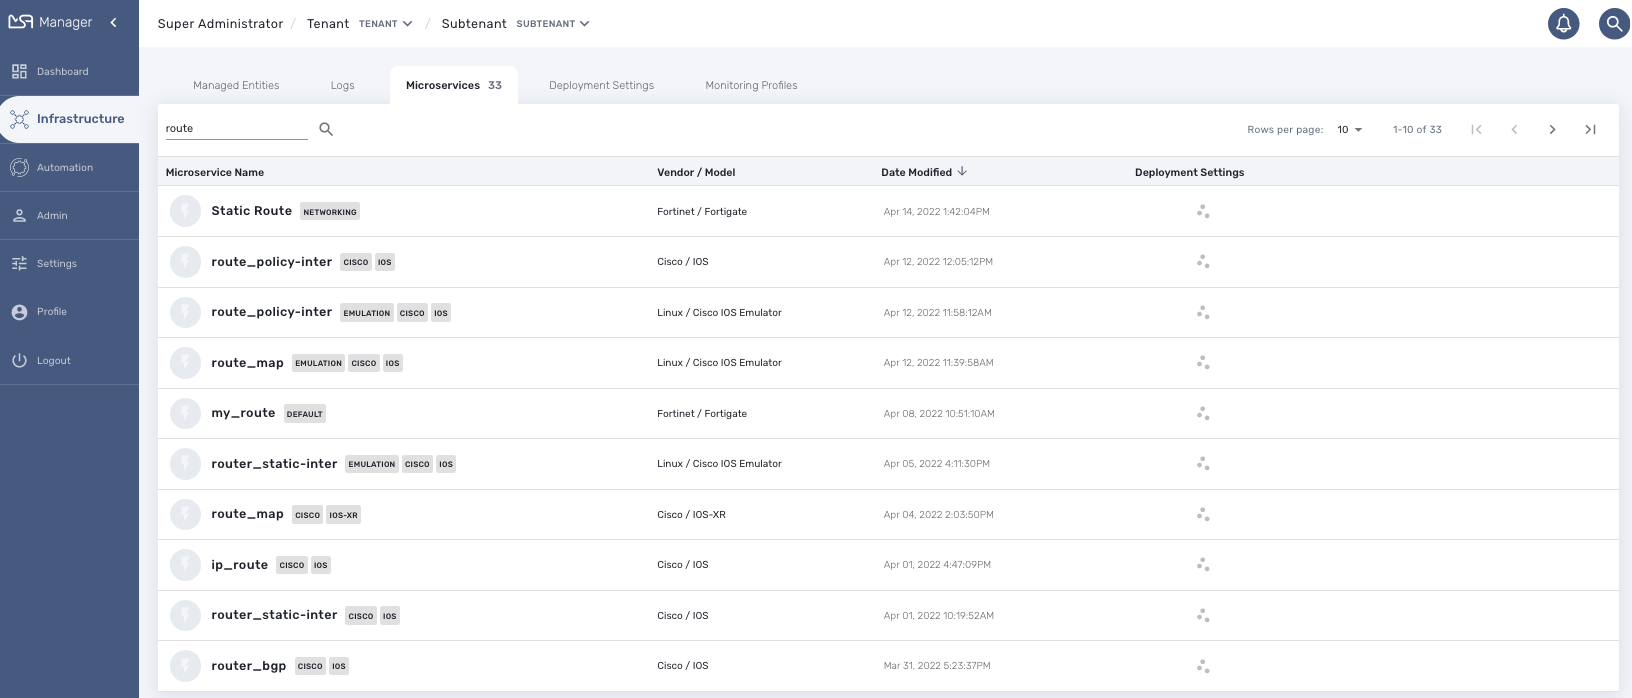
From this page you can create or edit microservices - which is part of microservice design (cf. section below).
The list of microservice can be sorted by name, vendor/model, last update date and number of deployment settings.
In order to use a microservice, it has to be associated to a managed entity via a deployment setting.
Microservice console
With the microservice console you will be able to use the microservices associated to a managed entity to configure the managed entity.
To access the console, select the managed entity and browse to the tab "Configure"
Calling the Microservice functions
Import
Click on "Synchronize With Managed Entity" to call the Import functions of the Microservices associated to the Managed Entity
Create
Select a Microservice on the left menu. If the Create function of the Microservice is implemented, you can use the button "+ Add Row".
Use the form to provide the values to use and click "Save" to record the value in the execution OpenStack
Update and Delete
Select a Microservice on the left menu and select a Microservice instance to update or delete. A button "Edit" or "Remove" will be displayed if the UPDATE or the DELETE function is implemented for the Microservice.
Read
Select a Microservice on the left menu and select a Microservice instance to read. A button "Read" will be displayed if the READ function is implemented for the Microservice.
The read should be implemented by a Smarty template to generate a text file based on the microservice variable read in the database.
| read more about this in the developer guide. |
Execute the Microservice
You can stack multiple Create, Update and Delete orders for multiple Microservices. Once you are finished, you can either discard the changes or apply the changes.
If you discard the changes, the current order stack will be erased.
If you apply the changes, the configuration engine will go through the stack and apply the changes one by one on the Managed Entity.
Bulk Operations
With version 2.8.0, it is possible to execute bulk operations on the microservices.
Bulk operations allow you to select multiple instance to delete or update or create multiple instances.
Microservice bulk operation usually requires that some variables are configured to allow "Primary Composite Key". This is done by setting the parameter "Primary Composite Key" to true in the advanced parameter tab of the variable.
Primary Composite Key
In order to allow to bulk update a variable, the "Primary Composite Key" should be enabled for the variable.
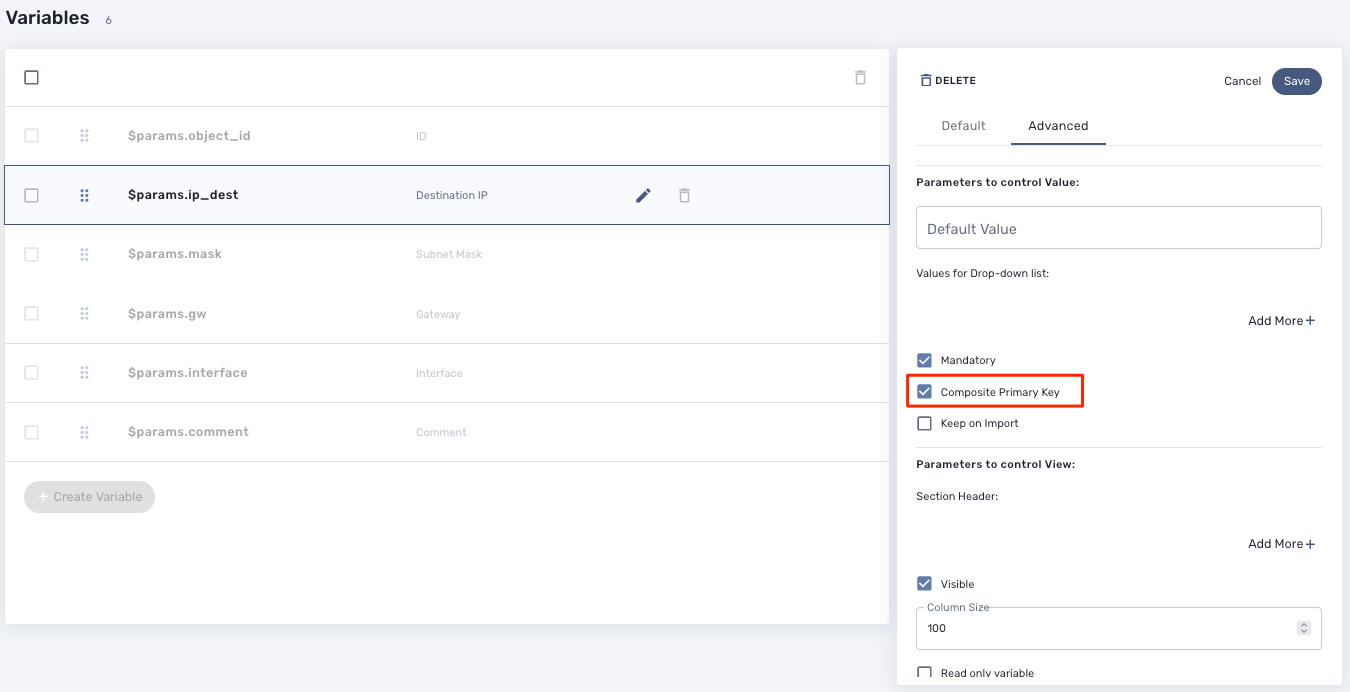
When "Primary Composite Key" is enabled, you can assign multiple values to the variable field when creating or updating a microservice by clicking on the button "Edit Keys".
| a composite key variable can only be edited by clicking on "Edit Keys" as the form input field is not editable in the parent screen. |
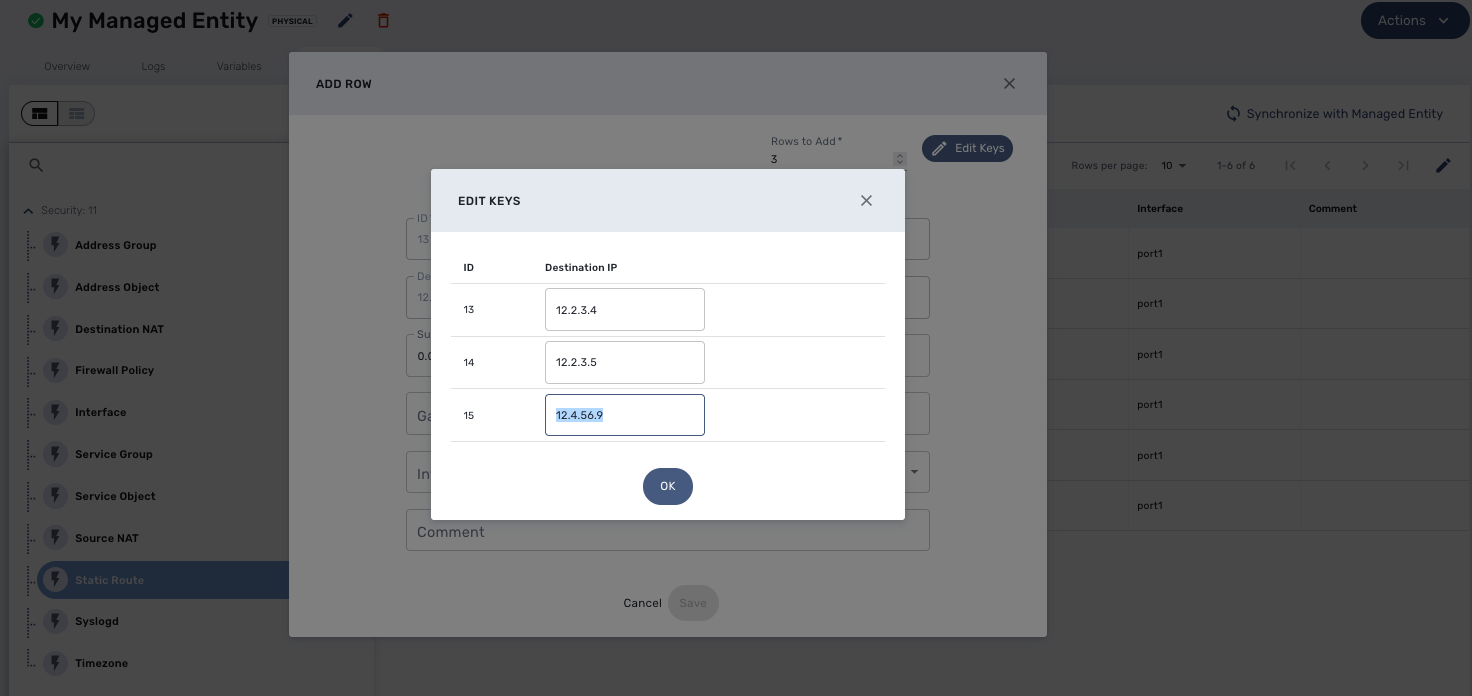
Bulk creation
Select a microservice in the managed entity tab "Configure".
The microservice should have its Create function implemented with the "+ Add Row" button visible.
Click on "+ Add Row", by default the user form allows to create one instance. You can create more instances by changing the number of rows to add. This will show the button "Edit Keys".
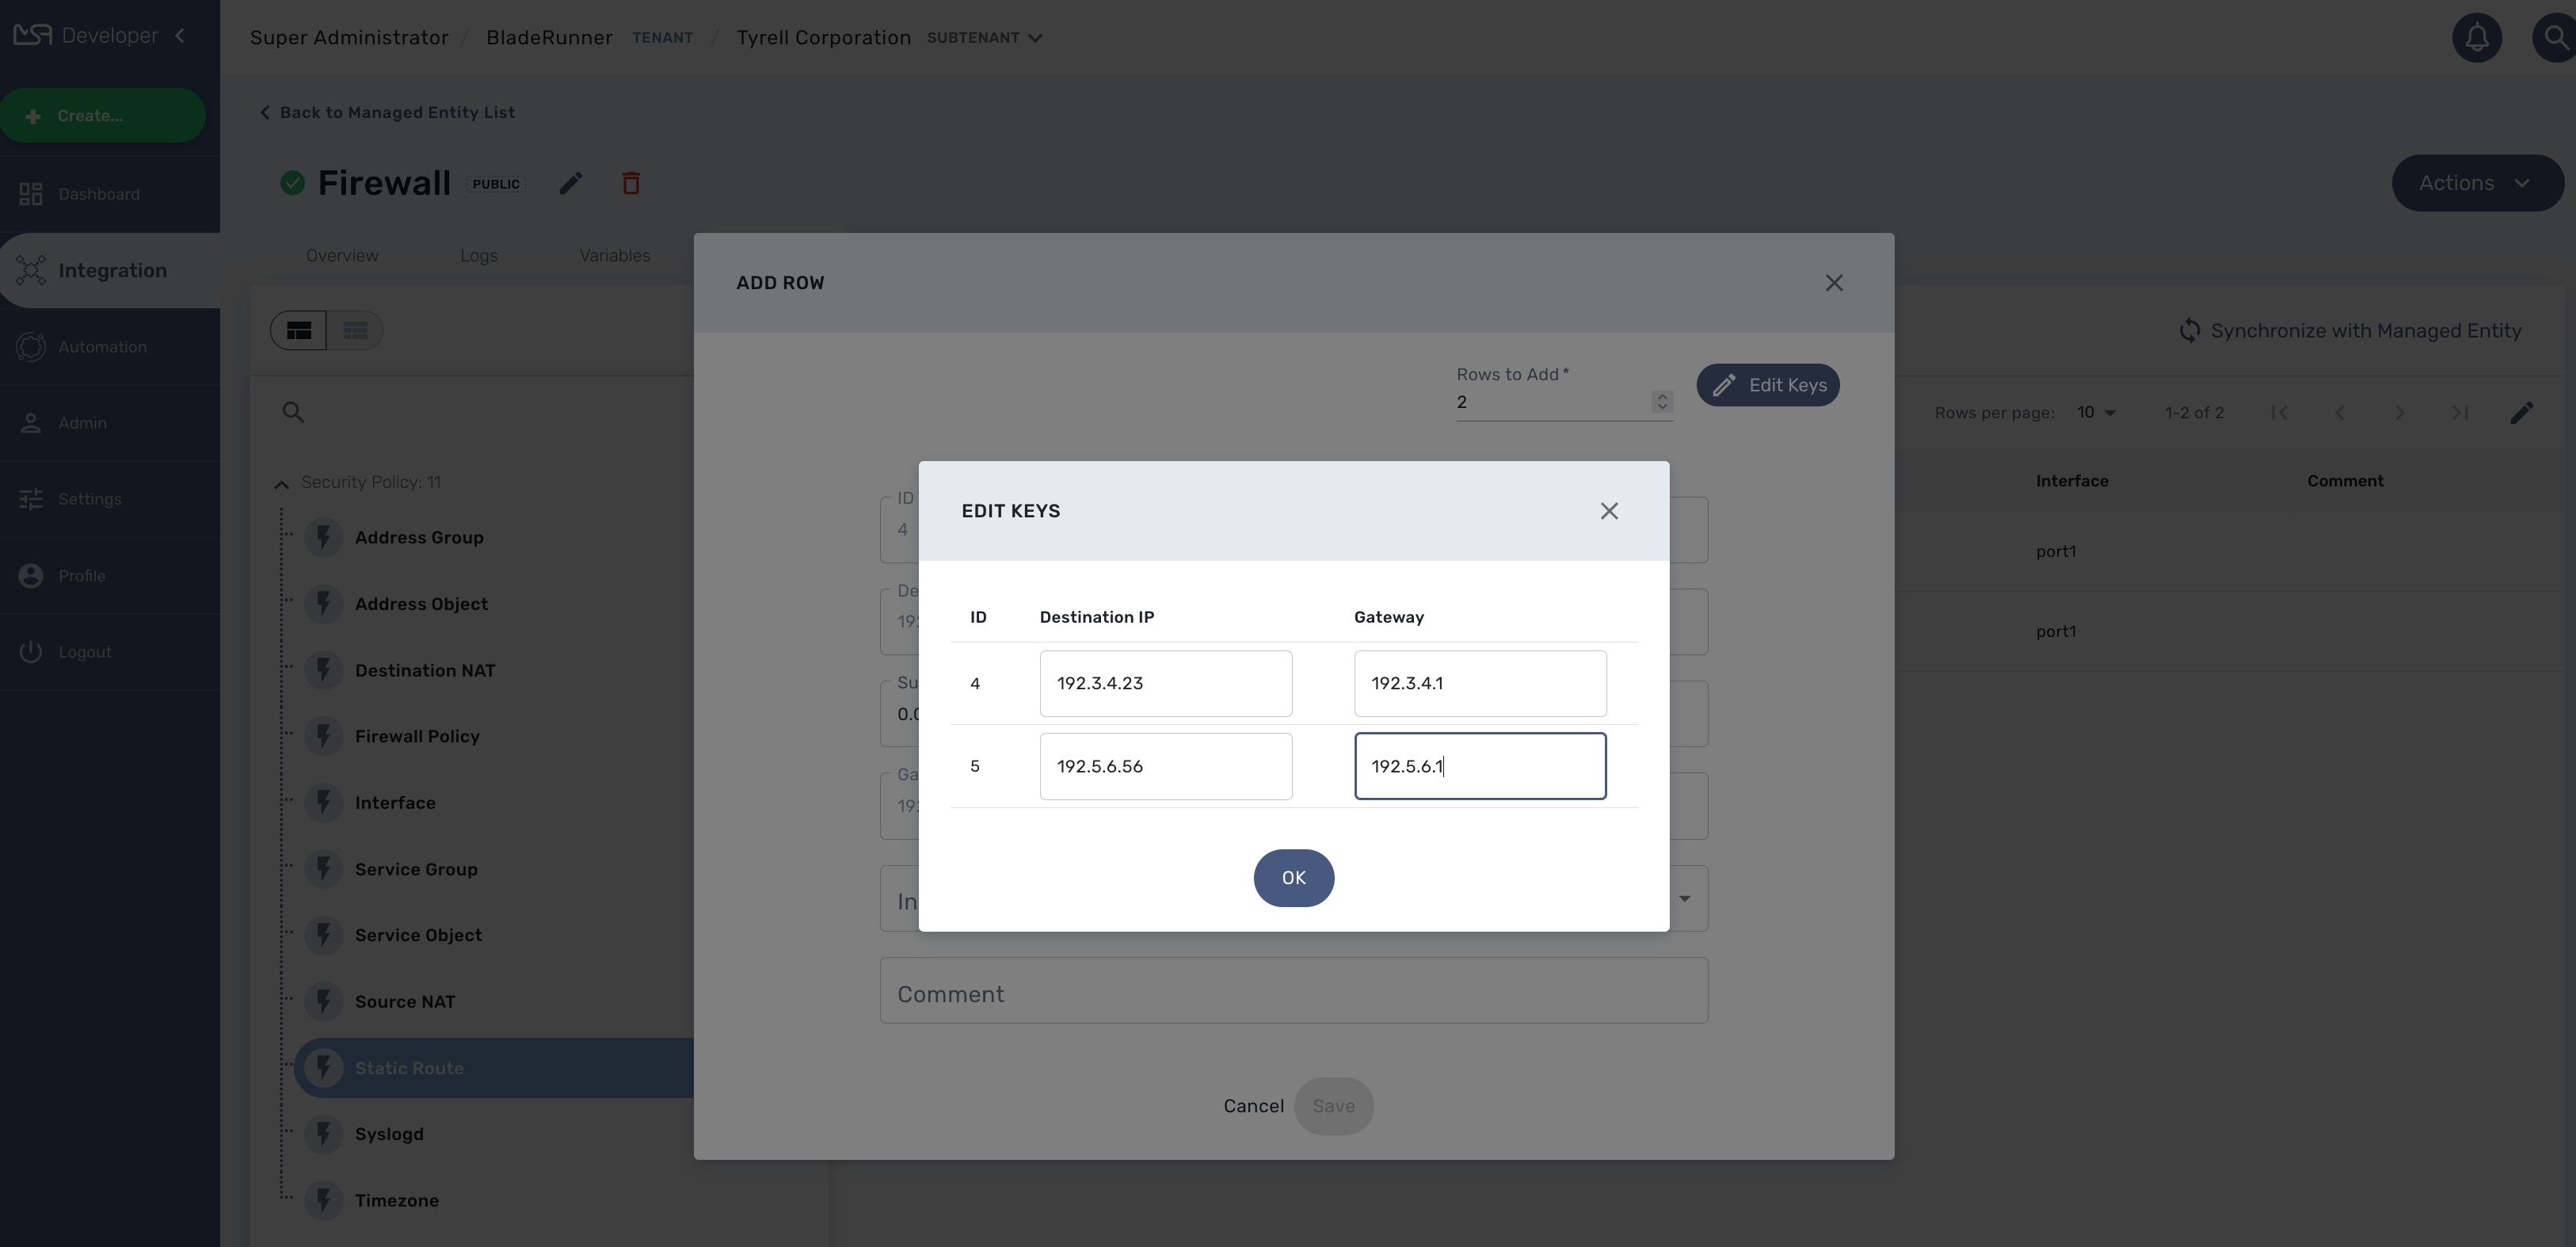
Click on OK and save the form parameter.
You can create multiple instances for several microservice and once you are done, click on "Apply Changes" to trigger the configuration on the CoreEngine.
Bulk update
You can select multiple microservice instances and click on the edit button to change the parameters of these instance.
| bulk edition can only be done on variables that are not set as primary composite key. |
Bulk delete
Similarily as the update you can select multiple instances and delete them by using the "Remove" button.
Microservice design
Microservice design is documented in the developer guide.
Deployment Settings
Deployment Settings will allow you to build your configurations and apply them to your managed entities.
What is a deployment setting
Deployment Settings will also ease any change to your configurations: you can add/remove a template or a microservice and be assured that the change will be applied in a consistent way across all your managed entities.
A deployment setting is a configuration that links a set of microservices to a set of managed entities.
When using a deployment setting, you can ensure that your managed entities, associated with the deployment setting, have the same list of microservices, thus are all similar with regard to their managed services.
How to use deployment
You can view the deployment settings by clicking the "Integration" link on the left menu and select the tab "Deployment Settings"
This page shows the list of deployment settings, sortable and searchable by name.
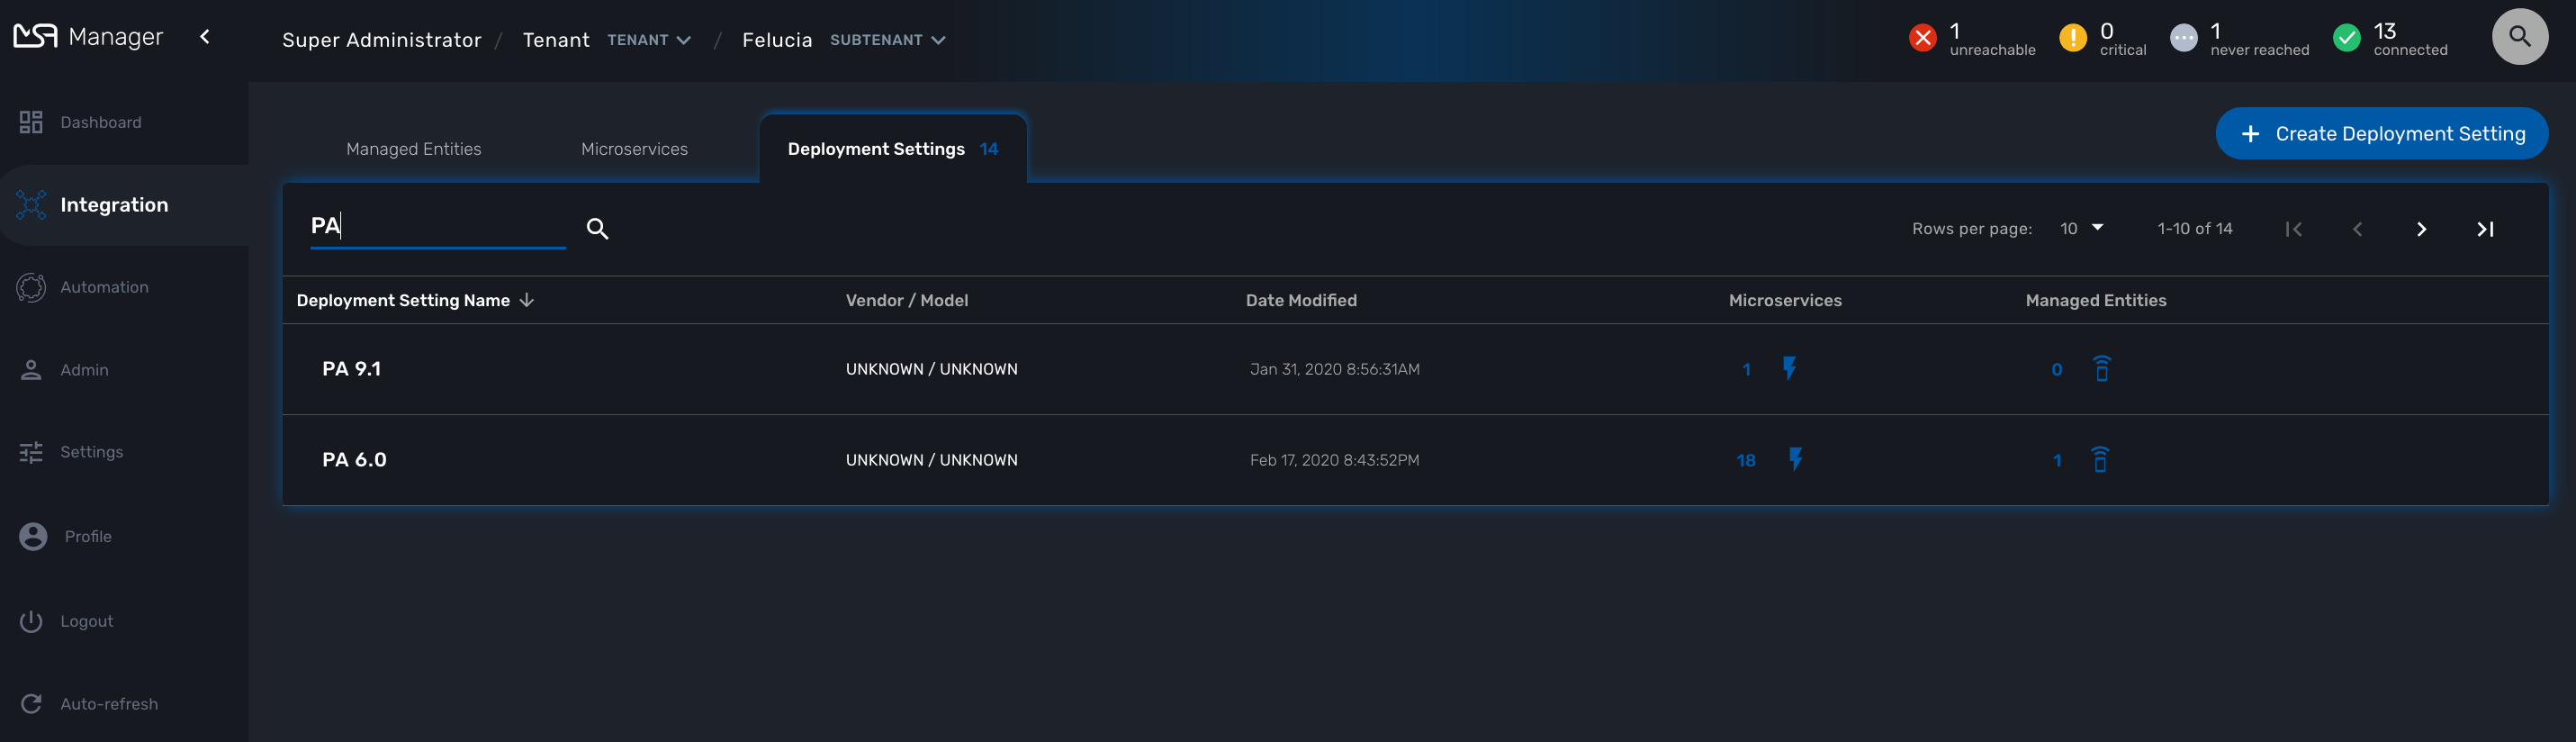
A Deployment setting acts as the intermediate layer between a set of managed entities and a set of microservices
Create, update, delete
Creation
To create a deployment setting you need to browse to the "Integration" panel, select the tab "Deployment Settings" and click on "+ Create Deployment Setting".
The first tab "Information" will let you set a name, an external reference, and vendor/model couple and optionally add a comment.
If you haven’t selected a tenant and a subtenant yet, then you can do it at this stage.
The second tab is for selecting the microservices, the list is based on the vendor/model selected previously. If the list is empty it means that your repository doesn’t have any microservice compatible with the vendor selected.
The third tab will let you select the managed entities that will be using the microservices. You can select several managed entities, only the ones from the subtenant, with the same vendor will be available.
Update
You can edit a deployment setting and change it’s configuration but the vendor/model selected at the creation time can’t be changed. This will enforce consistency within you system.
Delete
You can delete a deployment setting any time. When you delete a deployment setting, the microservices won’t be available to the managed entity but any configuration previously fetched from the managed entity will still be stored in the database.
External reference
When you save a new deployment setting, the information is stored in the database and a unique ID is assigned to this deployment setting. As it’s commonly done in most application, the database ID is immutable but there are cases where you need to be able to use you own unique identifier to identify a deployment setting (this also applied to managed entities for instance). For instance when integrating with a third party system with API it’s convenient to decide on a common unique value to identify an object.
This is what external reference is made for. You can set it to your own value as long as it’s unique in the MSactivator™ database.
Access Control
The scope of a deployment settings is the subtenant. In order to view the existing deployment settings you need first to select a subtenant. Once selected as shown below, this enables the user to change those settings appropriately.
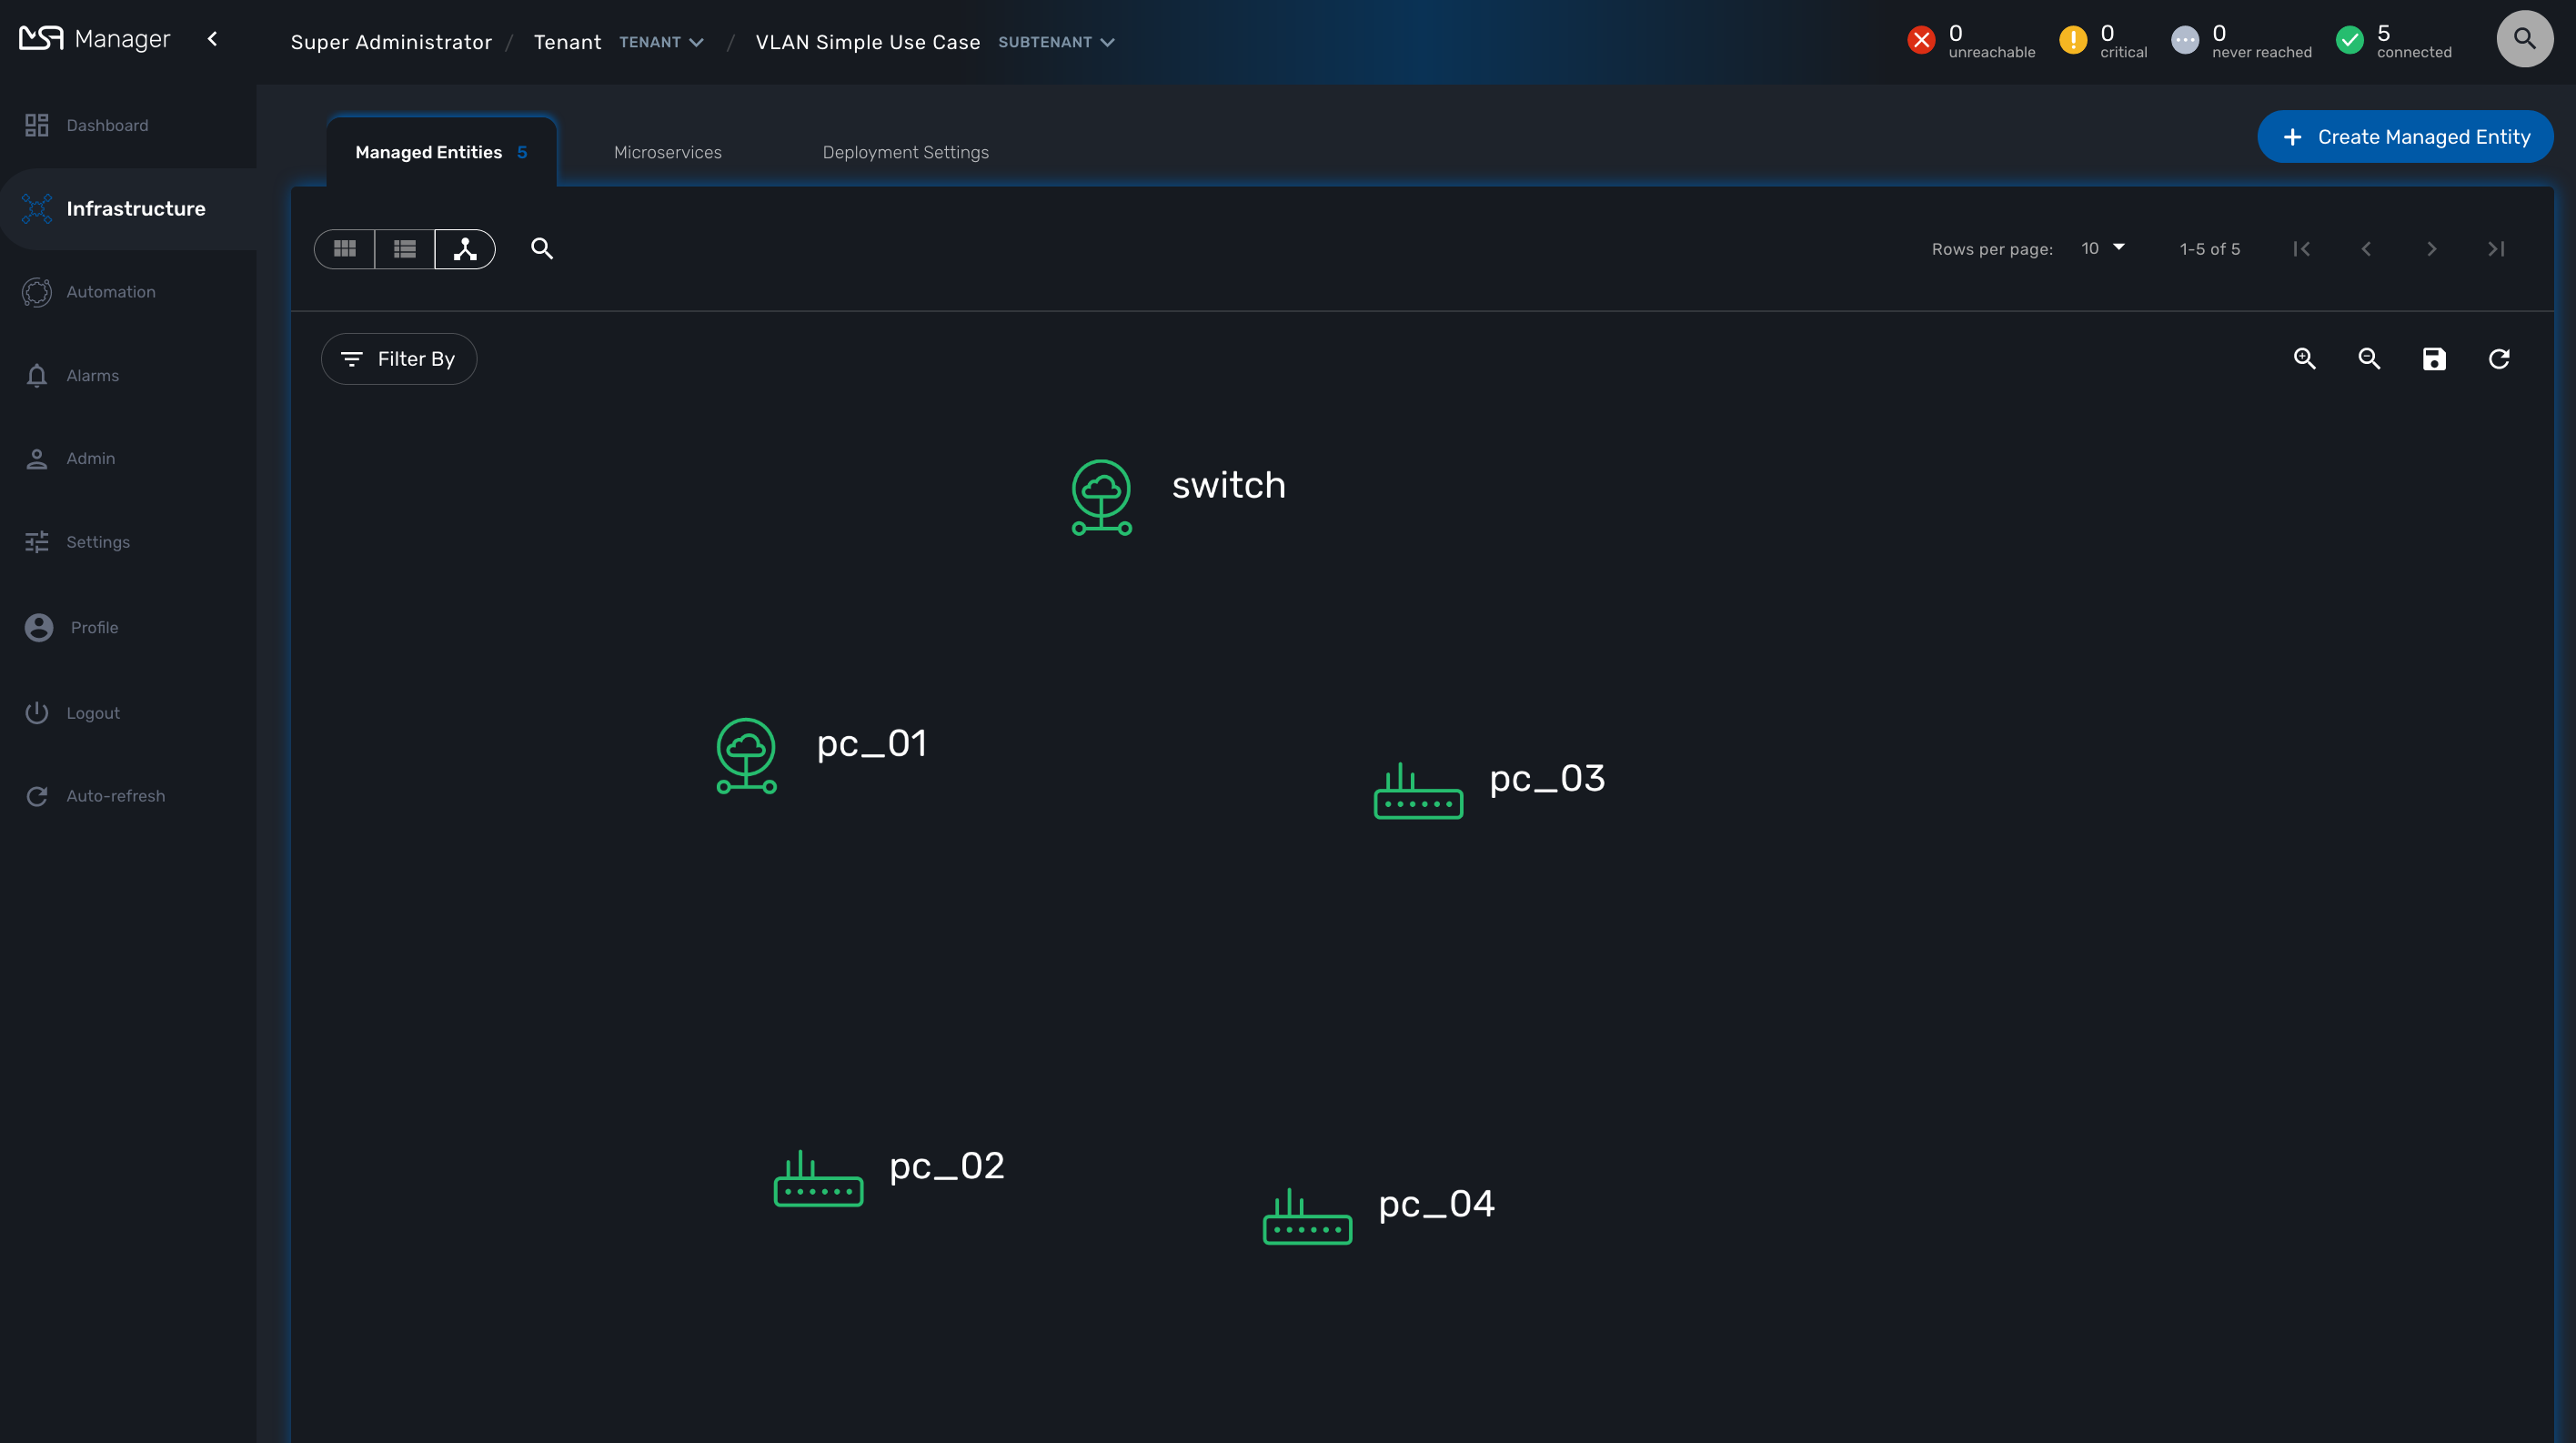
Topology
The topology view is available on the portal and provides a graphical view of your network.
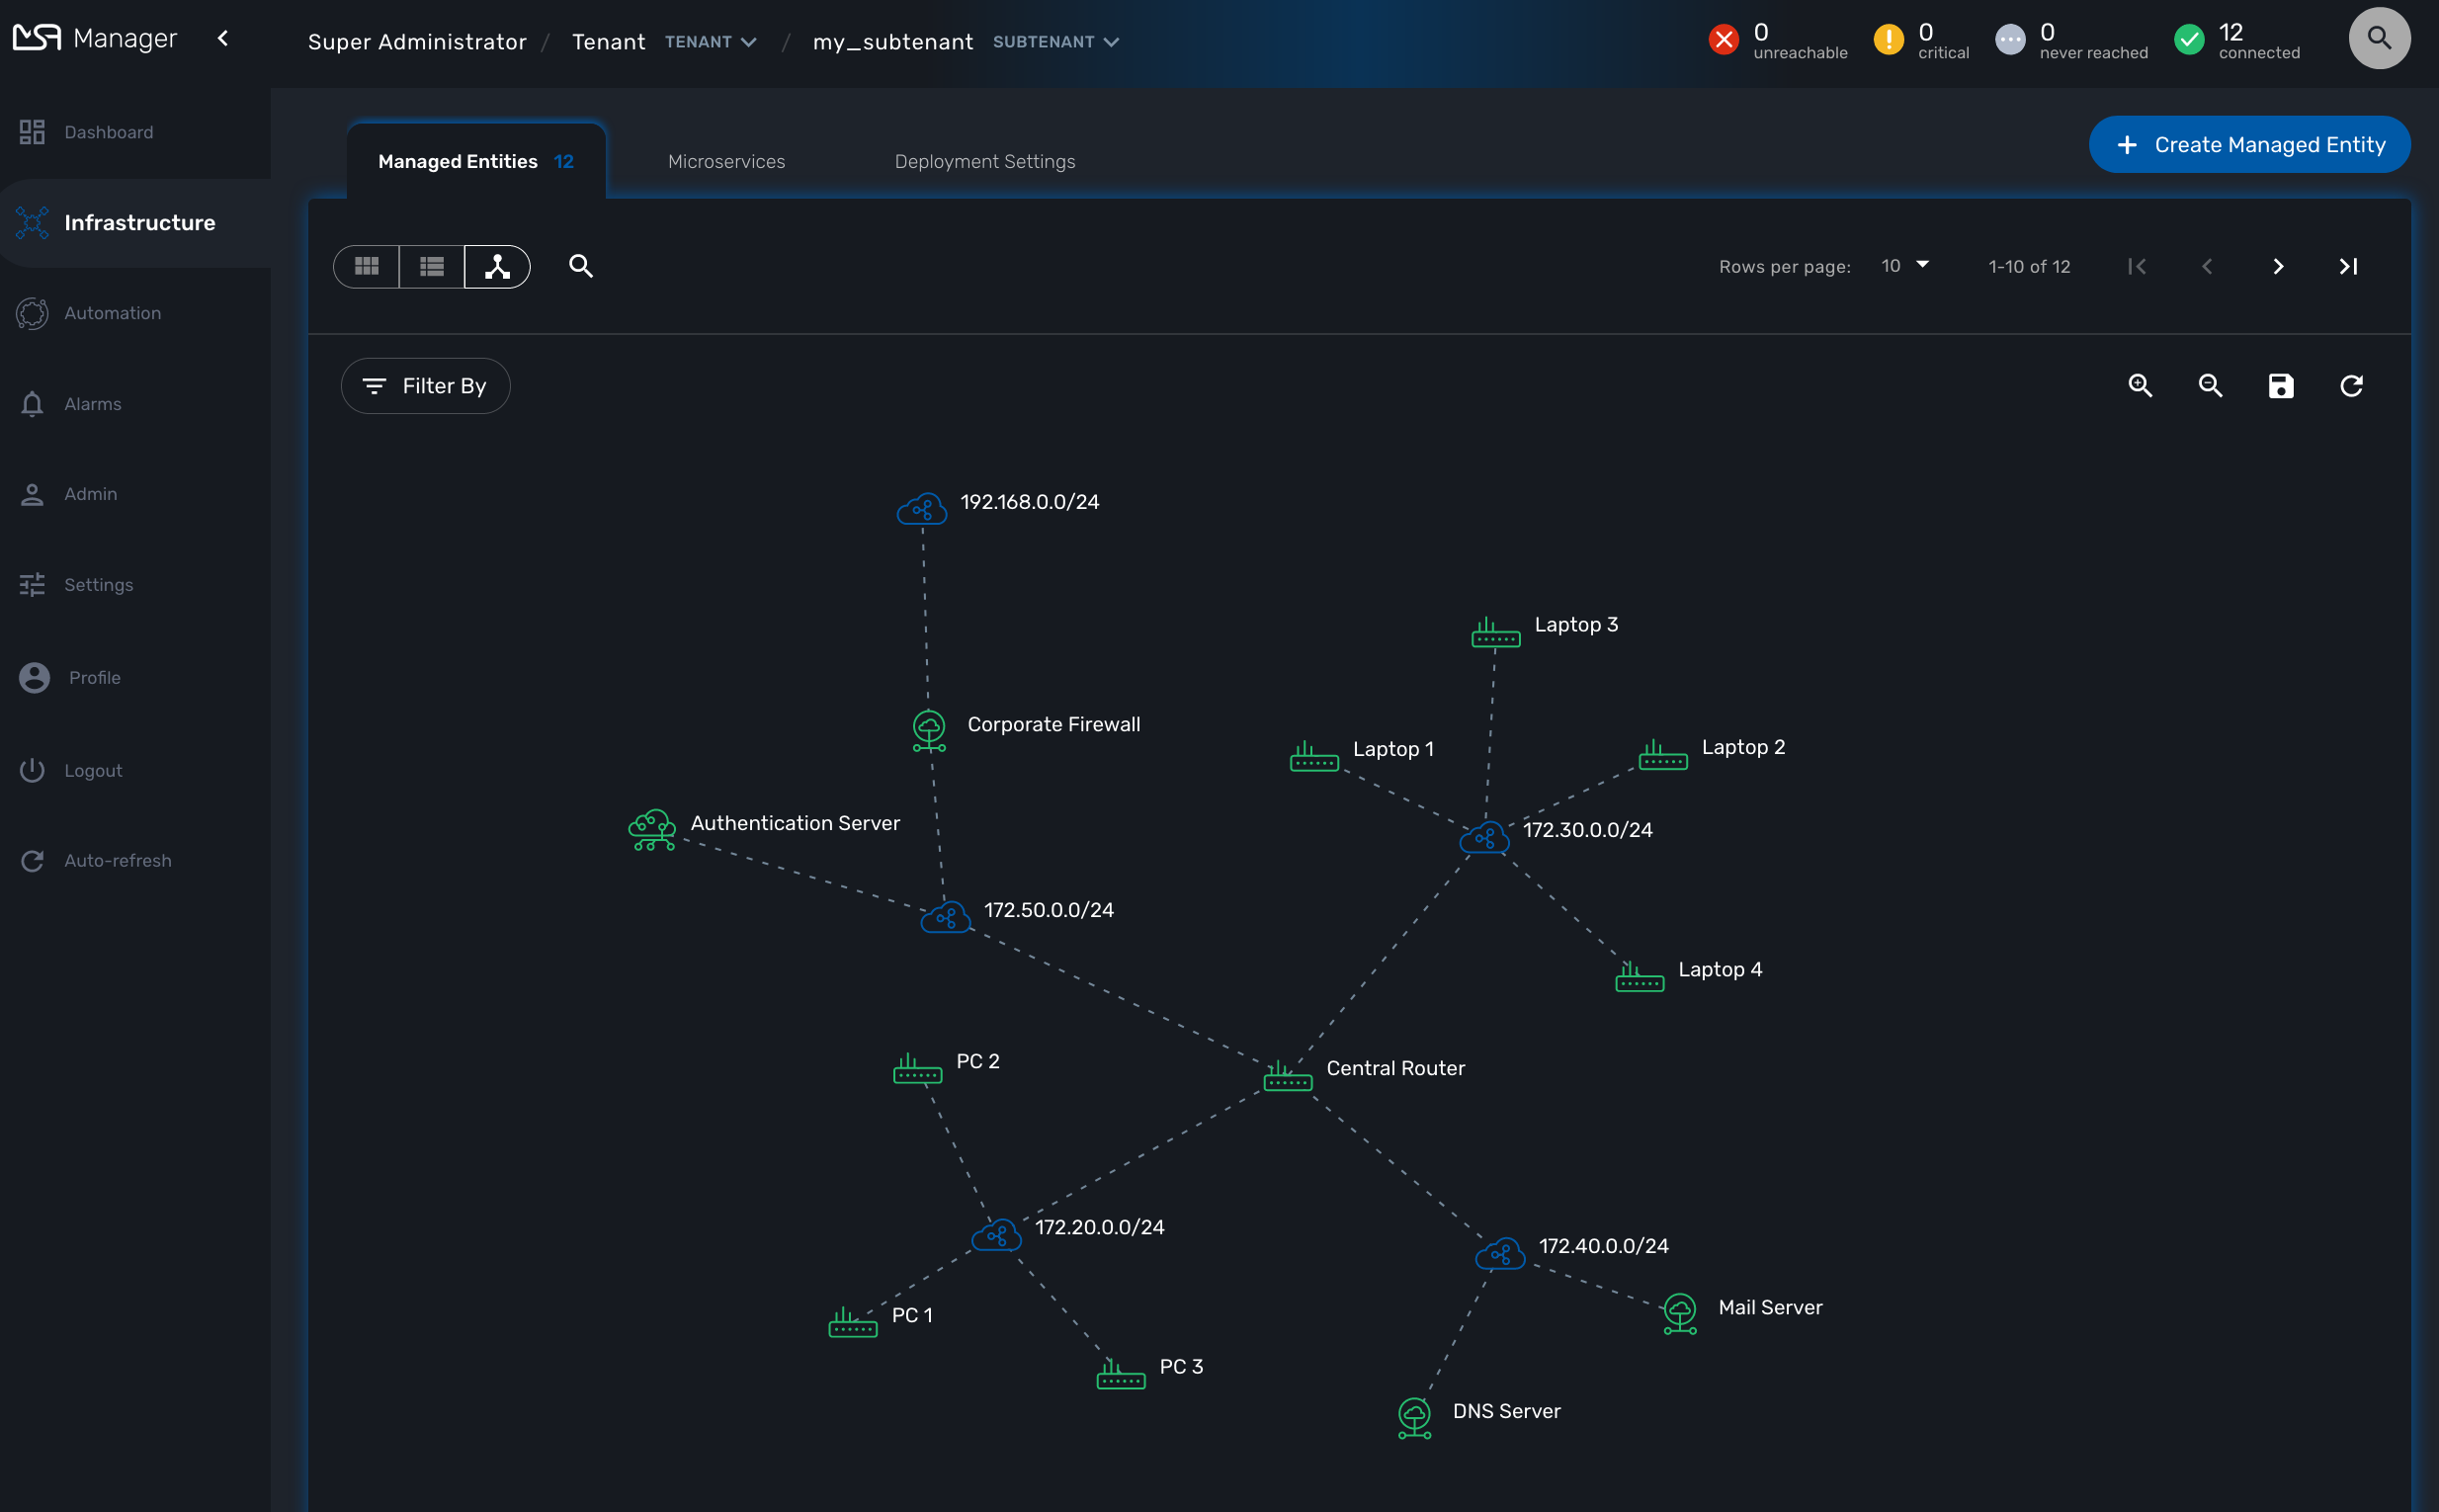
Topology view
The topology view is available in the "Infrastructure" section of the web user interface, in the tab "Managed Entities".
When you browse to the topology view for the first time, the topology will be calculated automatically based on the L3/SNMP topology mode (see below).
You can refresh the topology view, for instance after your infrastructure has been updated by clicking on the refresh button on the top right corner of the topology canvas.
You can also zoom in and out and re-arrange the layout of the nodes by dragging them with your mouse.
If you want to persist the layout, you can save the topology with the save button on the top right corner of the topology canvas.
Managed Entity categories
On the topology view you can right-click on a managed entity icon and add categories to the managed entity.
This is useful to organize your infrastructure elements.
Use the "Filter By" action to filter your topology view and only display the elements you are interested in.
Workflow and BPM launcher
If you right-click anyway on the topology canvas, a contextual menu will pop-up and from there you have the possibility to trigger the execution of a workflow or a BPM.
This is a useful shortcut when you need to run some automated processes based a visual display of your infrastructure.
Topology types
2 types are available to build and display the topology view:
-
Layer 3 view based on SNMP
-
Layer 2 view based on VLAN
SNMP
The L3 SNMP mode relies on SNMP request to the managed entities to build the topology graph.
Prerequisites
SNMP must be enabled on the managed entities with a read-only community. The community must also be set on the managed entity on the MSactivator™ managed entity form.
How it works
The topology is calculated by a workflow Topology. This workflow is automatically associated with the current subtenant when you browse to the topology screen in the "Infrastructure" section.
When you load or refresh the topology, the workflow will either create a new instance or update the last one that was created. It will loop through each managed entity of the subtenant and execute the CLI command below for each one.
snmpwalk -v2c -c <community> <address> IP-MIB::ipAdEntNetMask
The SNMP mode will rely on the CLI command snmpwalk -v2c -c <community> <address> IP-MIB::ipAdEntNetMask to get the list of IP addresses and network masks from the IP MIB object.
ipAdEntNetMask OBJECT-TYPE
    SYNTAX     IpAddress
    MAX-ACCESS read-only
    STATUS     deprecated
    DESCRIPTION
           "The subnet mask associated with the IPv4 address of this
            entry.  The value of the mask is an IPv4 address with all
            the network bits set to 1 and all the hosts bits set to 0."
    ::= { ipAddrEntry 3 }
For each managed entity, the topology workflow will get the list of IPv4 addresses of this MIB entry and it will build a data structure, stored in the MSactivator™ workflow database, to represent the topology as a graph with links and nodes.
$cmd = "snmpwalk -v2c -c $community $address IP-MIB::ipAdEntNetMask 2>&1";
exec($cmd, $value, $error);                                                             (1)
if (!$error) {
	foreach ($value as $search) {
		if (searchAddress($search, $matches) != false) {
			if ($matches [1] [0] != 127) {
				$address_link = $matches [0] [0];
				$maskAdr = $matches [0] [1];
				$mask = calcMask($maskAdr);
				$address_link_masked = getNetworkByAddressAndMask($address_link, $mask);
				$addressAndMask = $address_link_masked . "/" . $mask;
				createTopologyNetwork(str_replace(".", "_", $addressAndMask), $addressAndMask, "network", "");  (2)
				$context ['Nodes'] [$nodePlace] ["link"] [] ["id"] = $addressAndMask;
			}
		}
	}
} else {
	logTofile($value, "Error : $value \n"));
}| 1 | execute the snmpwalk command to list the IP addresses and masks |
| 2 | create the topology links with the CIDR as the identifier |
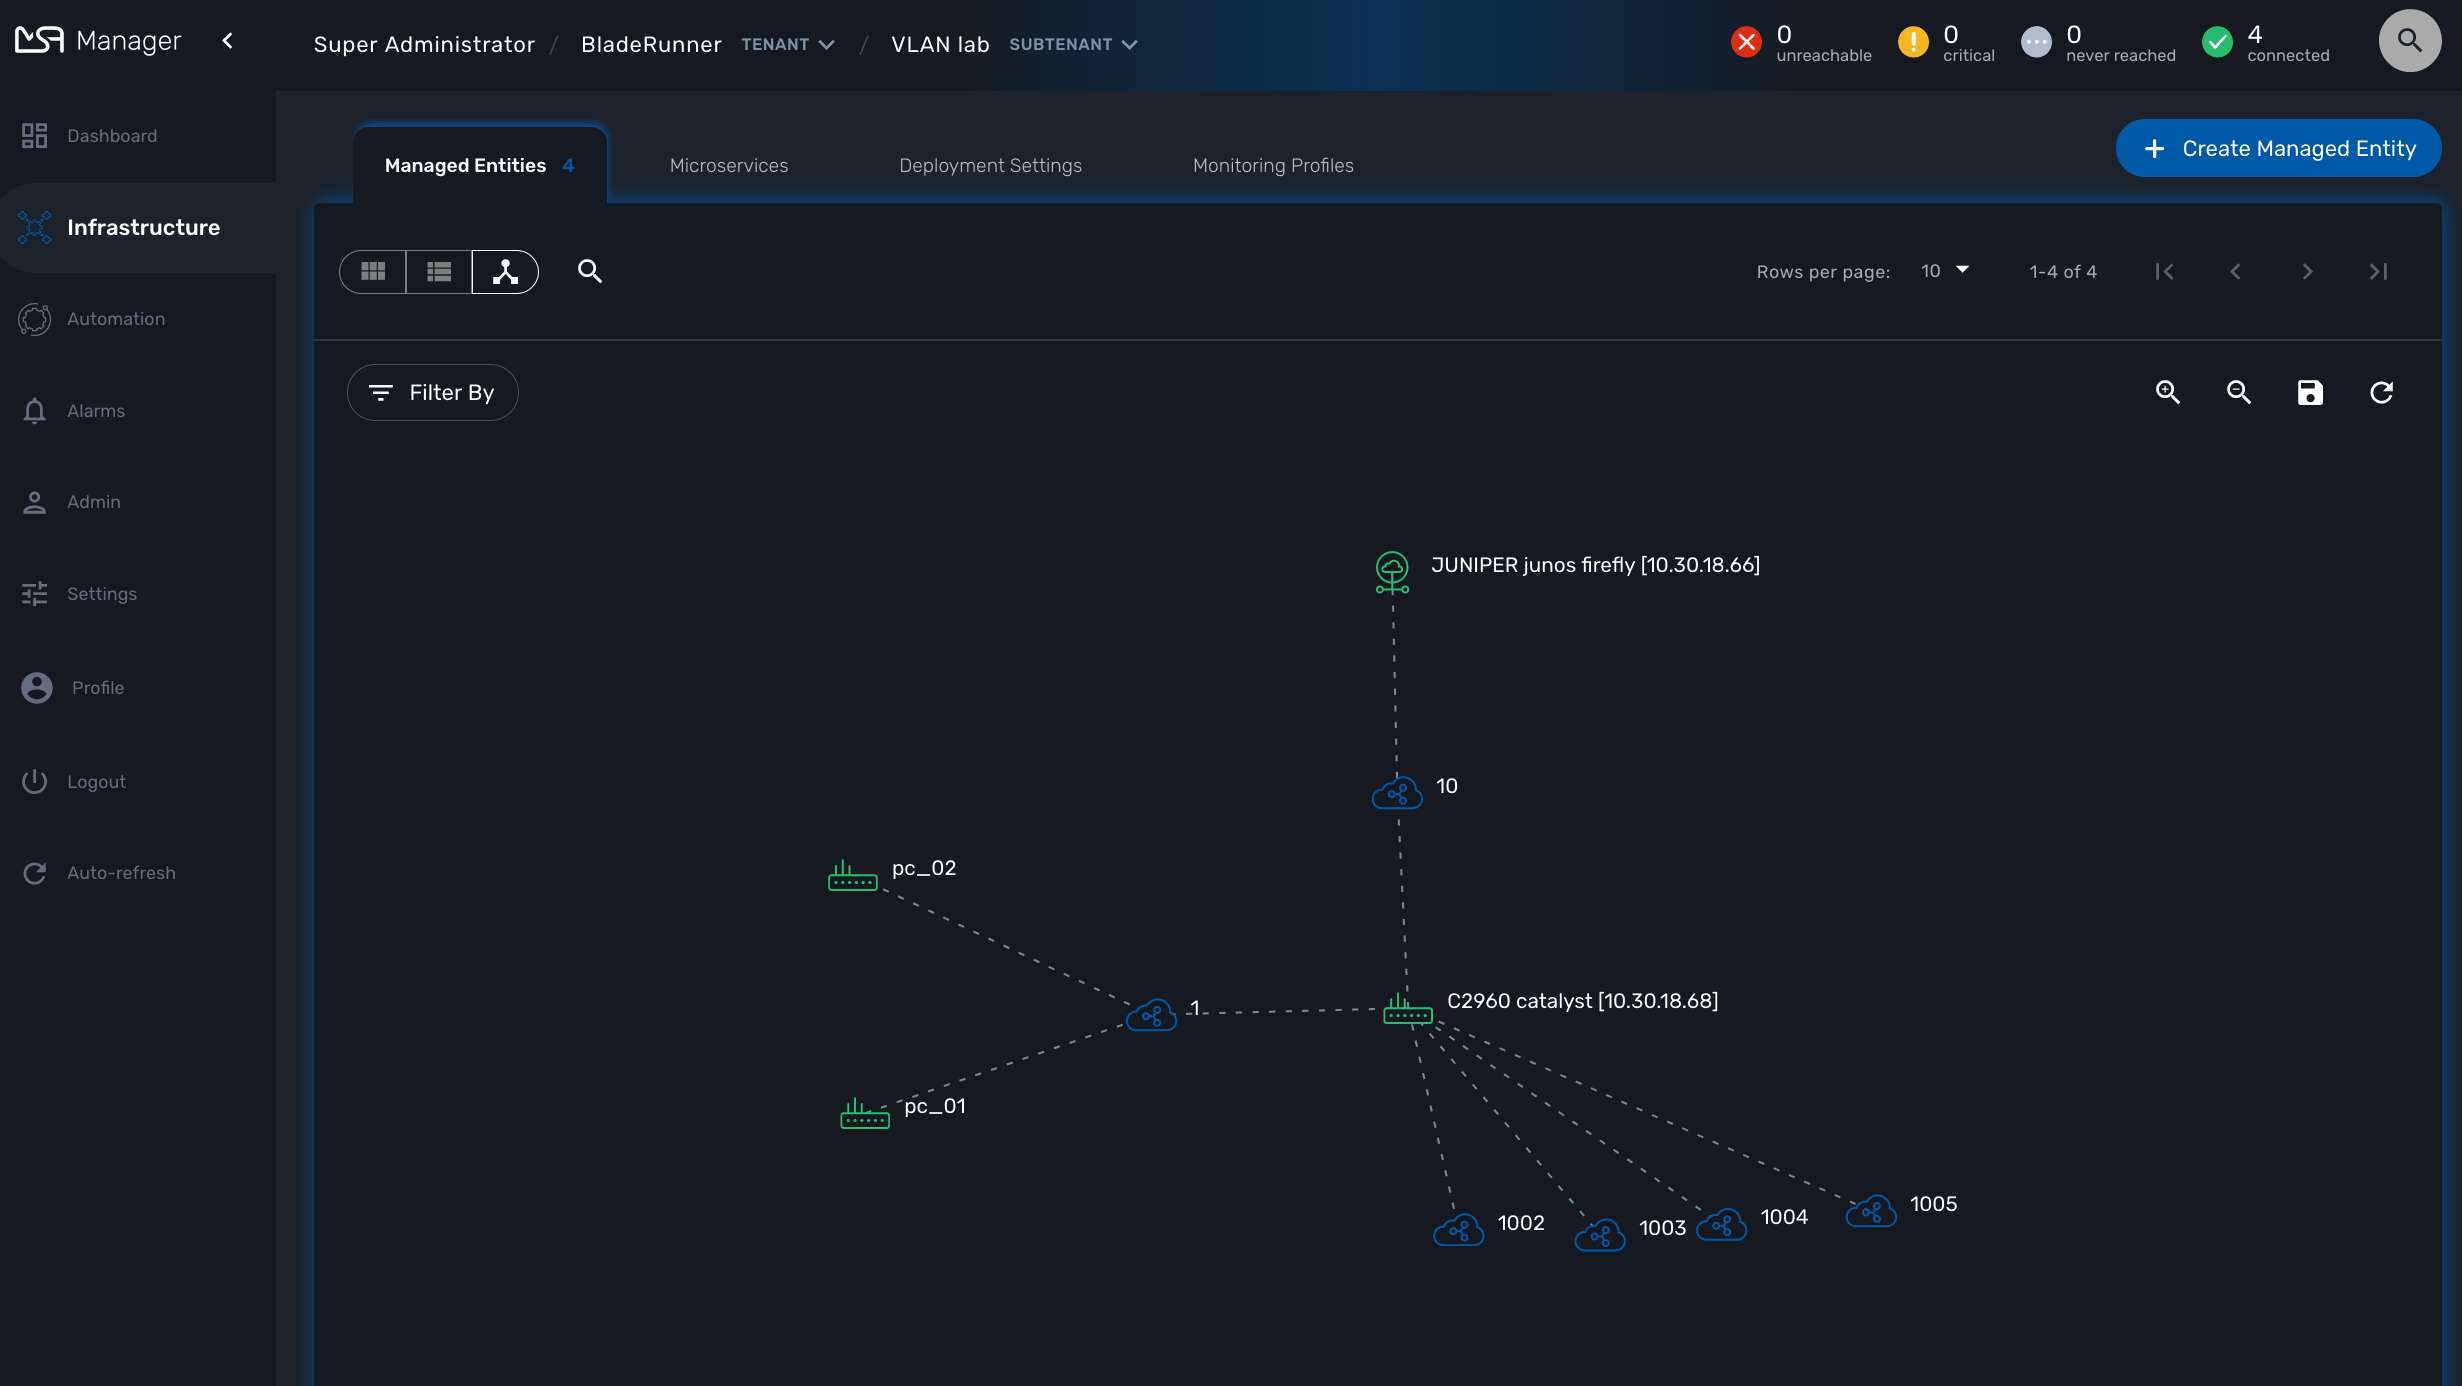
VLAN
The VLAN mode provides a layer 2 view of your infrastructure.
To generate this view you need first to create a new instance of the topology workflow and select "VLAN" for the topology type. Once this is done you will see the layer 2 topology in the topology screen of the infrastructure.
Prerequisites
The VLAN topology relies on microservices to get the vlan of you managed entities for a selected subtenant. It’s therefore mandatory to have a microservice attached to every managed entity you need the vlan information for.
The microservice for vlan should have the following characteristics:
-
be defined in a microservice file named vlan.xml
-
the variable object_id should be set to the vlan ID
Any other variable such as the vlan name can be defined in the microservice for configuration purposes but it will not be used to generate the topology view.
A few examples are available on Github:
How it works
When you load or refresh the topology, the topology workflow will either create a new instance or update the last one that was created. It will loop through each managed entity of the subtenant and import the vlan information based on the microservice implementation of the IMPORT function.
For example, with a linux based switch, the regex
:\svlan_(?<object_id>\w+):\s\S+\s\S+\s\S+\s+\S+\s\S+\s\S+\s(?<state>\w+)
will be applied to the result of the CLI command ip a:
# ip a | grep vlan
4: eth4.200@eth4: <BROADCAST,MULTICAST,UP,LOWER_UP100> mtu 1500 qdisc noqueue master vlan_200 state UP qlen 1000
5: vlan_default: <BROADCAST,MULTICAST,UP,LOWER_UP> mtu 1500 qdisc noqueue state UP qlen 1000
6: vlan_100: <BROADCAST,MULTICAST,UP,LOWER_UP> mtu 1500 qdisc noqueue state UP qlen 1000
7: vlan_200: <BROADCAST,MULTICAST,UP,LOWER_UP> mtu 1500 qdisc noqueue state UP qlen 1000
15: eth4@if16: <BROADCAST,MULTICAST,UP,LOWER_UP100,M-DOWN> mtu 1500 qdisc noqueue master vlan_default state UP
41: eth1@if42: <BROADCAST,MULTICAST,UP,LOWER_UP100,M-DOWN> mtu 1500 qdisc noqueue master vlan_default state UP
43: eth2@if44: <BROADCAST,MULTICAST,UP,LOWER_UP100,M-DOWN> mtu 1500 qdisc noqueue master vlan_default state UP
45: eth3@if46: <BROADCAST,MULTICAST,UP,LOWER_UP100,M-DOWN> mtu 1500 qdisc noqueue master vlan_100 state UP
#
and the result of the import will be 3 vlans, 100, 200 and default.
For non-linux managed entities the process to export the vlan information will be different but a similar result will be stored in the database and used by the workflow to build the data structure to represent the topology.
The code to build the topology node information will resemble to
foreach ($vlans as $vlan) {
	$vlan_id = $vlan->object_id;        (1)
	createTopologyNetwork($vlan_id, $vlan_id, "network", "");       (2)
	$context ['Nodes'] [$nodePlace] ["link"] [] ["id"] = $vlan_id;
}| 1 | get the value of the microservice variable object_id. It’s expected to be the vlan ID. |
| 2 | create the topology link with the vlan ID |
Create you custom topology
You can create your own topology view, either based on an existing one or you can create a completely new one based on the specifics of your infrastructure.
Here are the steps to add a new topology my_topology to your MSactivator™
Step 1: prepare your development environment
The topology workflow is located under /opt/fmc_repository/OpenMSA_WF/ in the container msa_dev, it’s a git repository so you also need to make sure that it is up to date with git status and update your local repository with git pull origin master to get the latest updates.
Under /opt/fmc_repository/Process, there is a symlink to the git repo: Topology → ../OpenMSA_WF/Topology
$ docker-compose exec msa-dev bash
[root@36f98599746a /]# cd /opt/fmc_repository/OpenMSA_WF/
[root@36f98599746a OpenMSA_WF]# git remote -v
origin	https://github.com/openmsa/Workflows.git (fetch)
origin	https://github.com/openmsa/Workflows.git (push)
You can add your own remote to your fork of the openmsa repository or work with the default one. Either way, you need to create a working branch that you will use later to initiate a pull request.
[root@36f98599746a OpenMSA_WF]# git checkout -b my_topology
Switched to a new branch 'my_topology'
Step 2: add a new topology type to the workflow
With the MSactivator™, edit the topology workflow, edit the variable view_type and, in the "Advanced" section add my_topology to the values for the drop-down list.
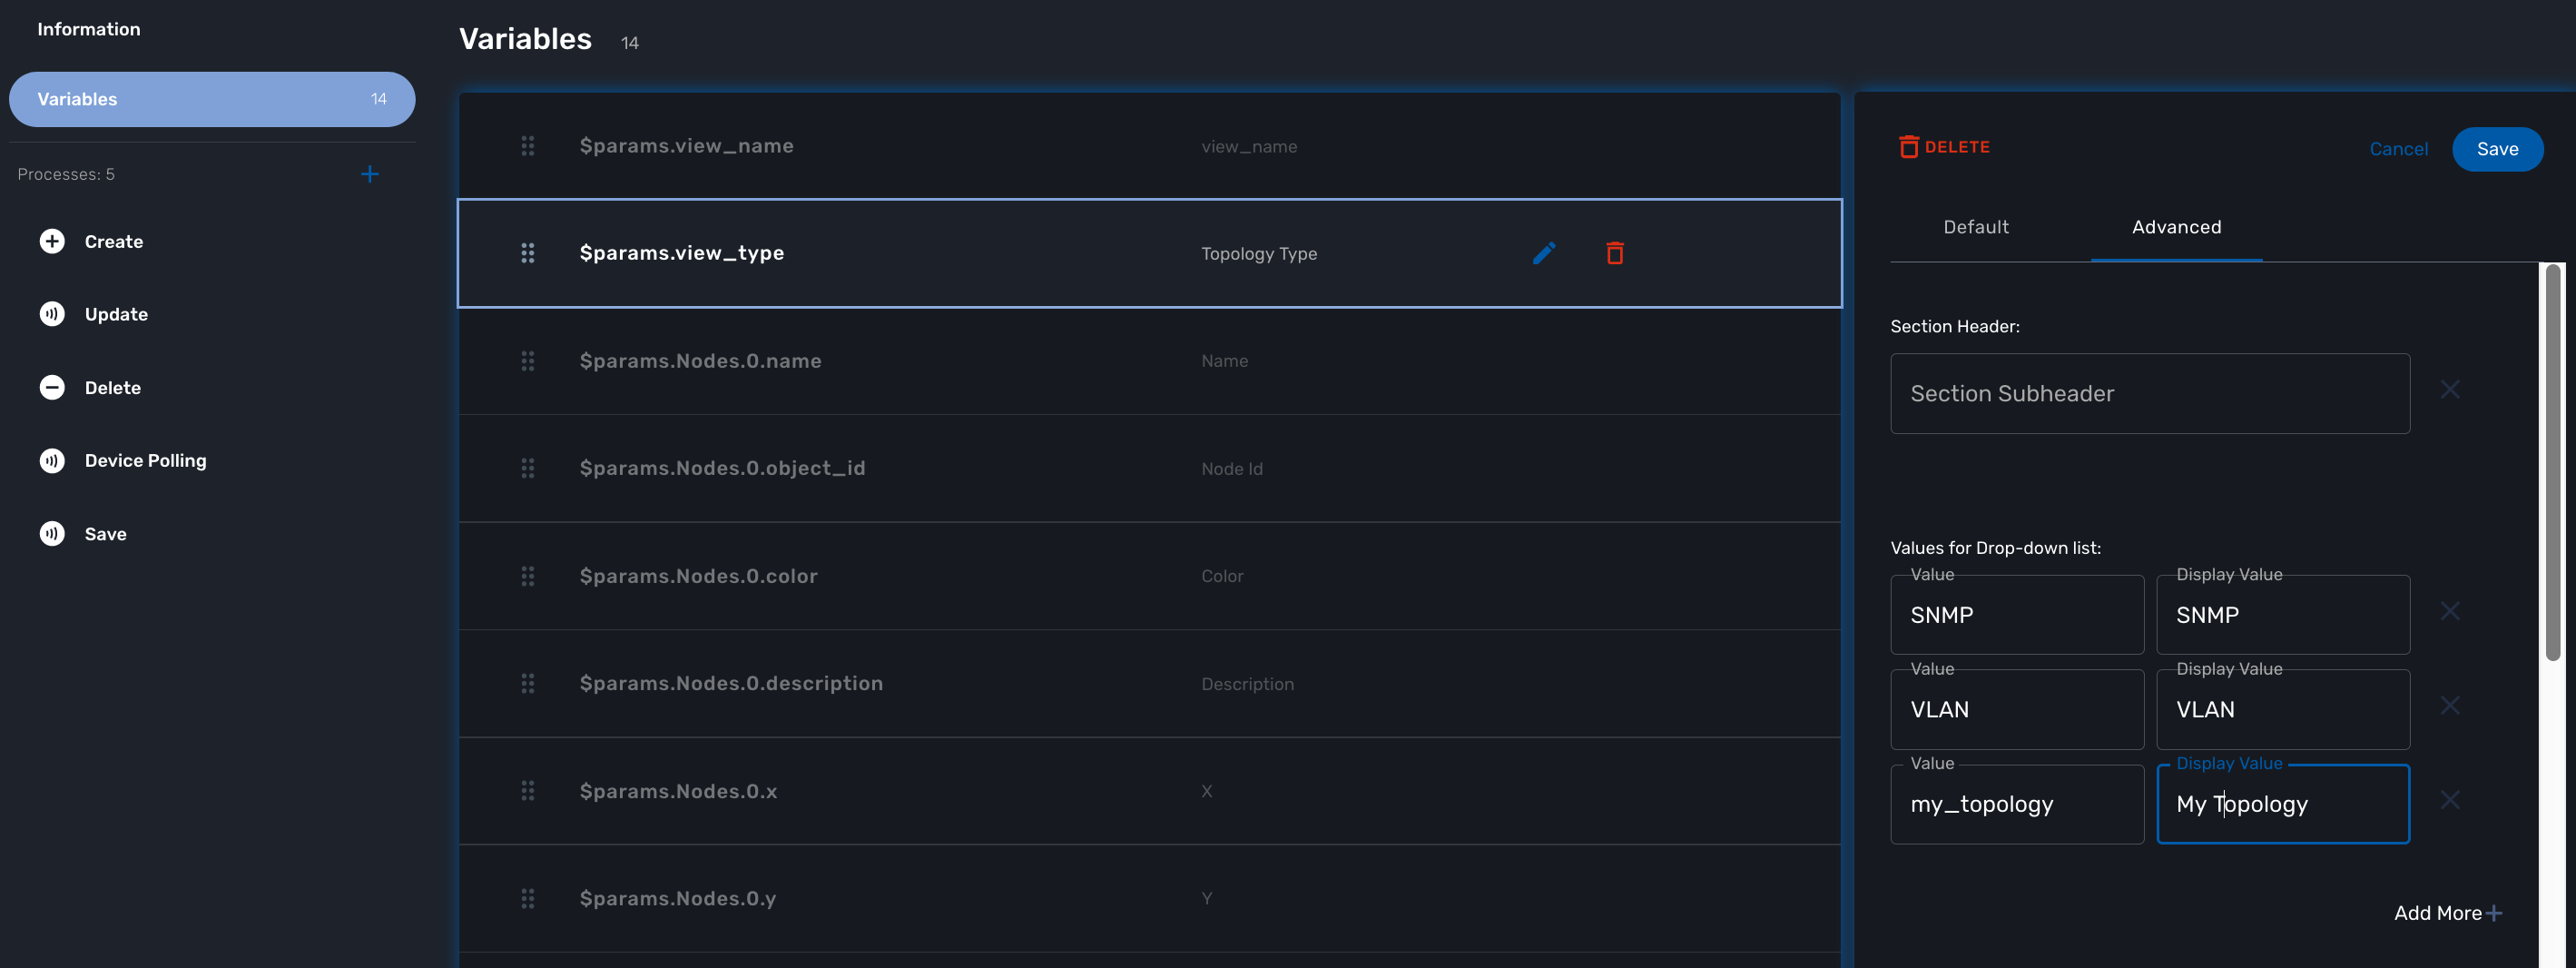
Save the workflow and use git status to see your change
[root@36f98599746a OpenMSA_WF]# git status
On branch my_topology
Changes not staged for commit:
  (use "git add <file>..." to update what will be committed)
  (use "git restore <file>..." to discard changes in working directory)
	modified:   Topology/.meta_Topology.xml
	modified:   Topology/Topology.xml

no changes added to commit (use "git add" and/or "git commit -a")
you can add and commit these files.
[root@36f98599746a OpenMSA_WF]# git lg
* c5f8bf6 - (HEAD -> my_topology) add a new topology view type <Antoine> (5 seconds ago)
Step 3: add a new PHP script to implement the new topology
Go to /opt/fmc_repository/OpenMSA_WF/Topology/Topology_Types
[root@36f98599746a Topology_Types]# pwd
/opt/fmc_repository/OpenMSA_WF/Topology/Topology_Types
[root@36f98599746a Topology_Types]# ll
total 12
-rwxr-xr-x 1 ncuser ncuser 3857 Sep 24 15:13 SNMP.php
-rwxr-xr-x 1 ncuser ncuser  419 Sep 24 15:13 Template.php
-rwxr-xr-x 1 ncuser ncuser 1516 Sep 24 15:13 VLAN.php
You can reuse any of these files to create your own script, we will use Template.php which is an "empty" implementation.
[root@36f98599746a Topology_Types]# cp Template.php my_topology.php
[root@36f98599746a Topology_Types]# chown ncuser.ncuser my_topology.php  (1)
[root@36f98599746a Topology_Types]# ll
total 16
-rwxr-xr-x 1 ncuser ncuser 3857 Sep 24 15:13 SNMP.php
-rwxr-xr-x 1 ncuser ncuser  419 Sep 24 15:13 Template.php
-rwxr-xr-x 1 ncuser ncuser 1516 Sep 24 15:13 VLAN.php
-rwxr-xr-x 1 ncuser ncuser 419 Sep 27 12:55 my_topology.php| 1 | set the file user and group to ncuser |
Add a new commit for this initial file
[root@36f98599746a Topology_Types]# git status
On branch my_topology
Untracked files:
  (use "git add <file>..." to include in what will be committed)
	my_topology.php

nothing added to commit but untracked files present (use "git add" to track)
[root@36f98599746a Topology_Types]# git add my_topology.php
[root@36f98599746a Topology_Types]# git commit -m "new empty implementation"
[my_topology 455ab85] new empty implementation
 1 file changed, 15 insertions(+)
 create mode 100755 Topology/Topology_Types/my_topology.php
Now you are ready to start implementing and testing your new topology.
Step 4: implementation and tests
On the workflow screen, create a new instance with your new topology view. At that point the implementation will be specific to your use case.
Whenever you create a new instance of the process, a dedicated log file is created in the API container, under /opt/jboss/wildfly/standalone/log/process-<INSTANCE_ID>.log.
The workflow instance ID (39 in the screenshot below) is the one displayed at the top left corner of each instance.
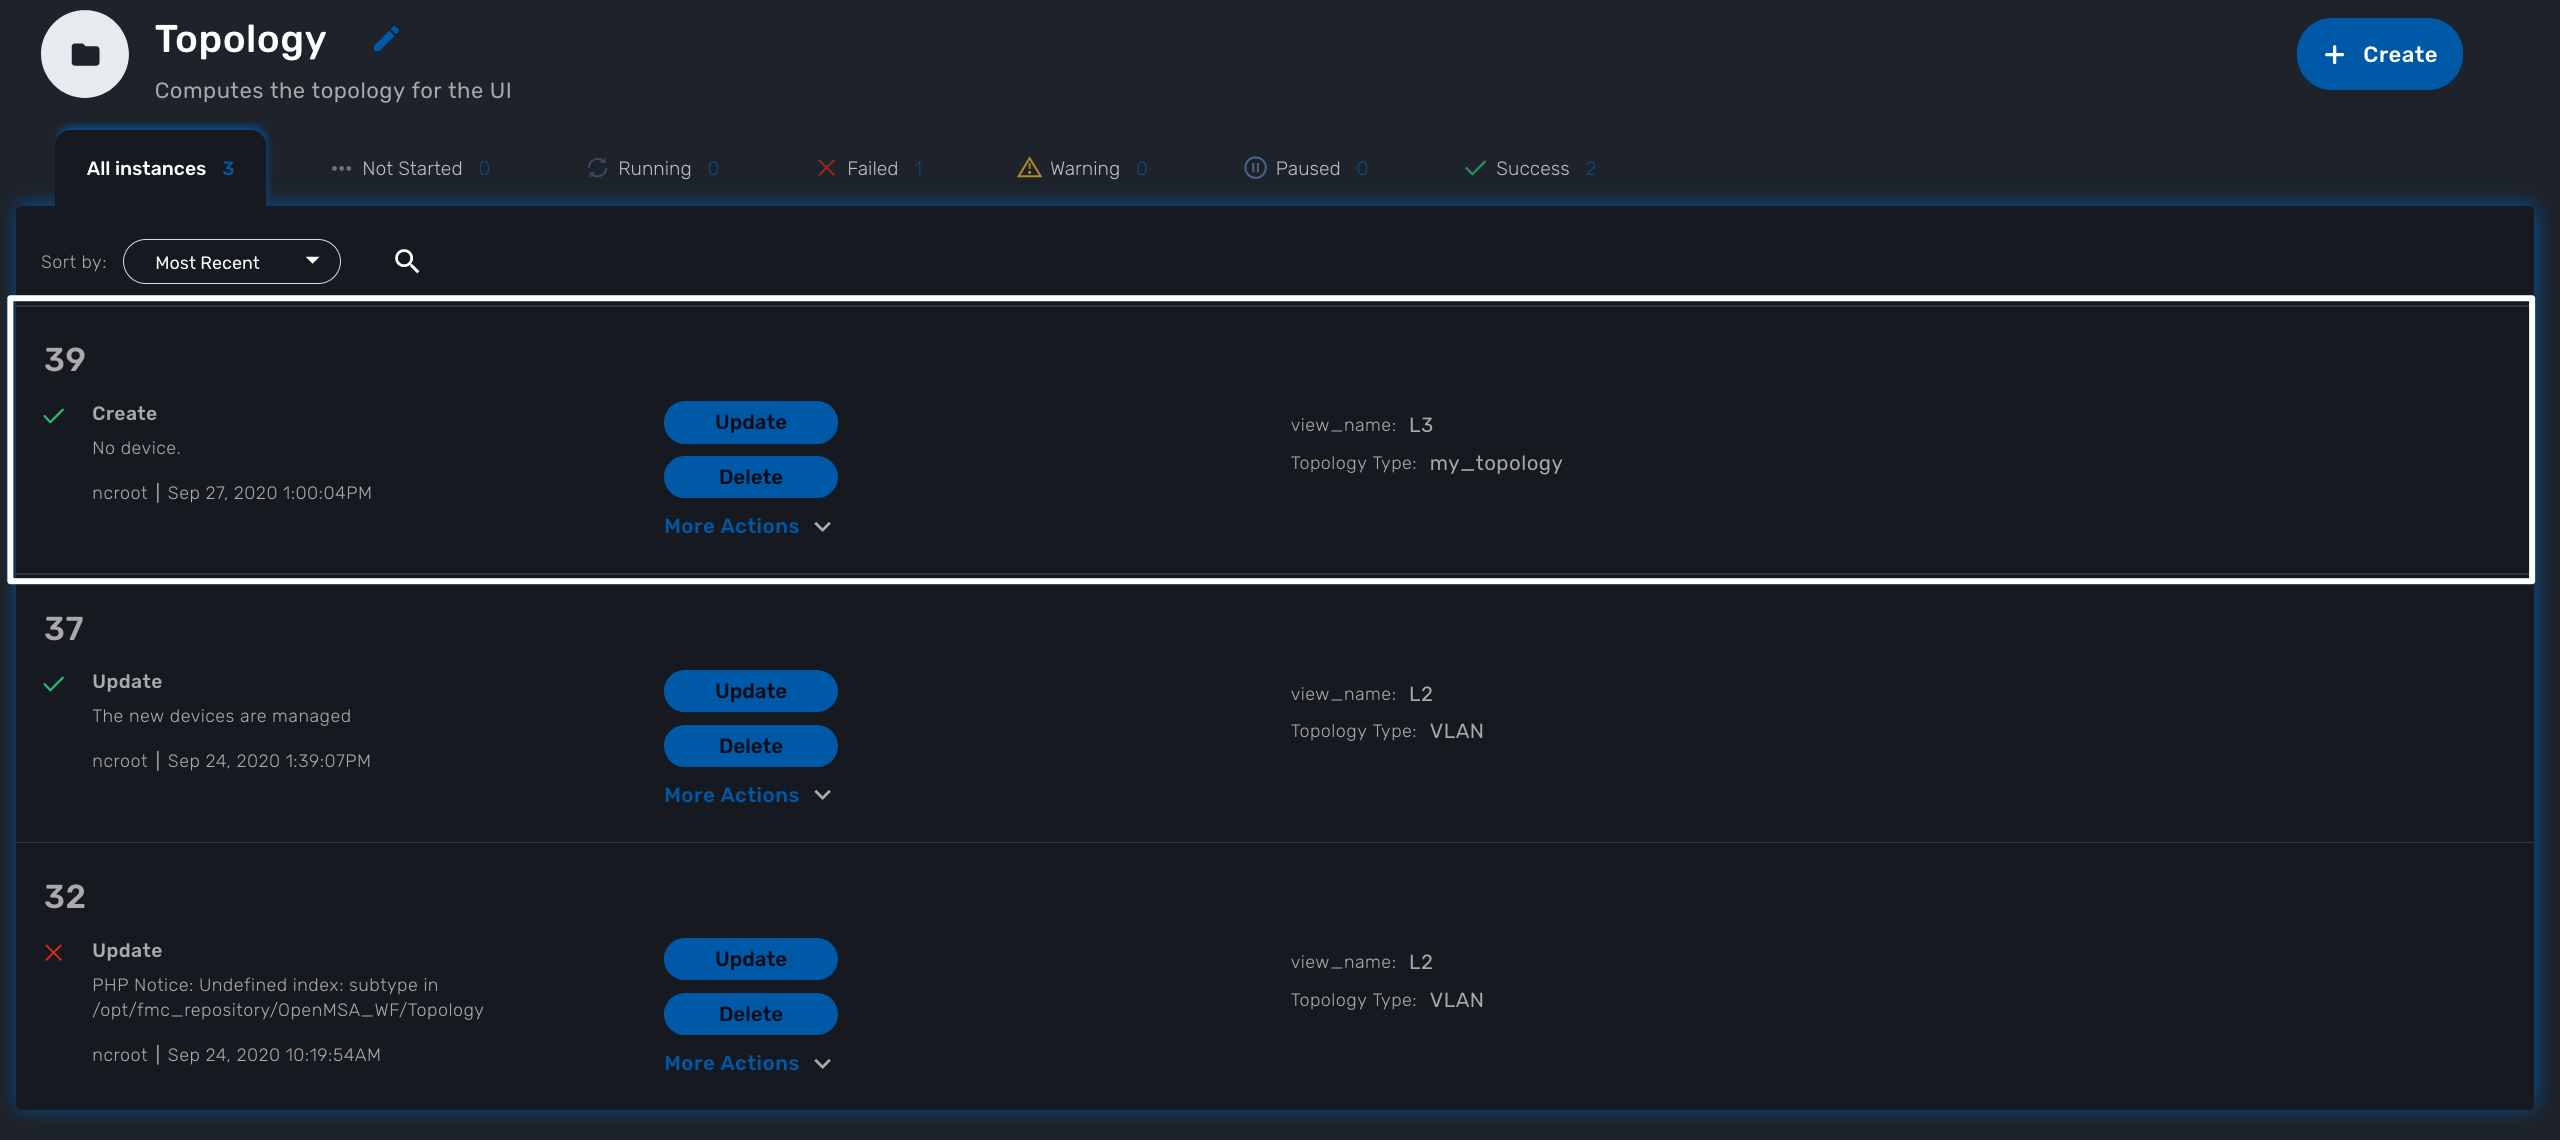
You can monitor the log for debugging purpose: docker-compose exec msa-api tail -F /opt/jboss/wildfly/standalone/log/process-39.log (where 39 is the workflow instance ID
Use the custom functions logToFile and debug_dump to output your debugging information in the log file.
With the code provided in Template.php you will get topology similar to this, without any links.
Workflows
Workflows allows the creation and management of complex automated processes.
Overview
This guide explains how to find, select and run workflows.
A workflow is composed of:
-
A collection of processes, where each process is composed of a set of executable tasks implemented in Python or PHP.
-
A list of variables stored in the database and are holding the state of a workflow instance.
-
Some administrative information used to manage the service in the service console.
Workflow selection
In order to use a Workflow, it has first to be associated to a subtenant. To do so, you need to select a WF from the list and click on "Add to…"
This will open a dialog popup where subtenant will able to select the subtenant to add/remote to/from a workflow
Workflow use
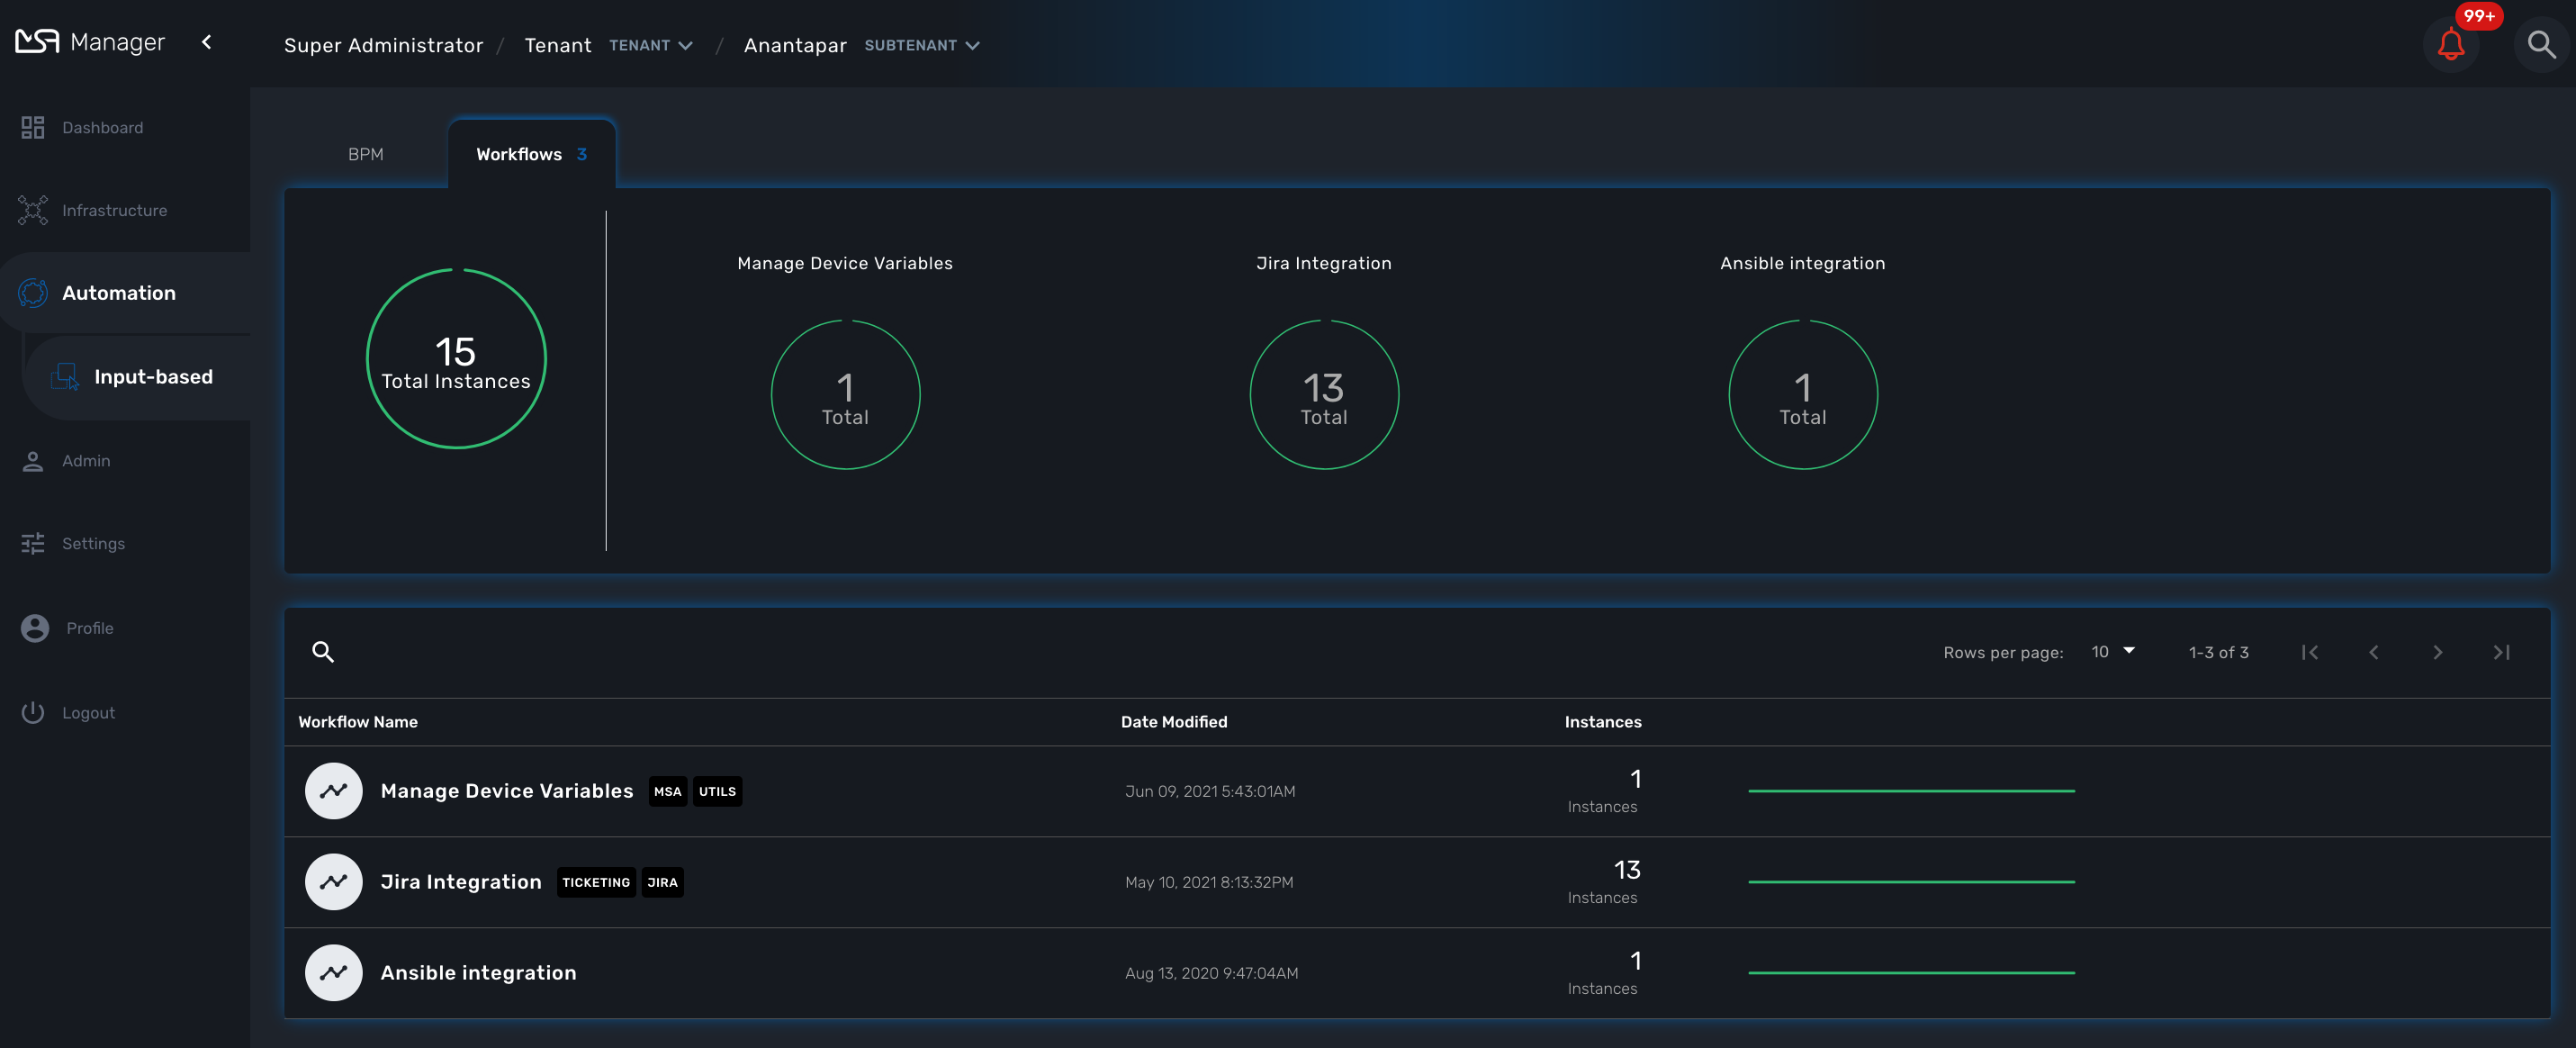
To run a workflow you must first select a subtenant from the subtenant selection list at the top of the screen.
This will display the subtenant management dashboard for the workflows.
This dashboard shows the overall status of process execution.
To use a workflow, you have select it from the list at the bottom of the screen. This will open a screen with the list of the workflow instance and actions to create new instances, update or delete existing ones.
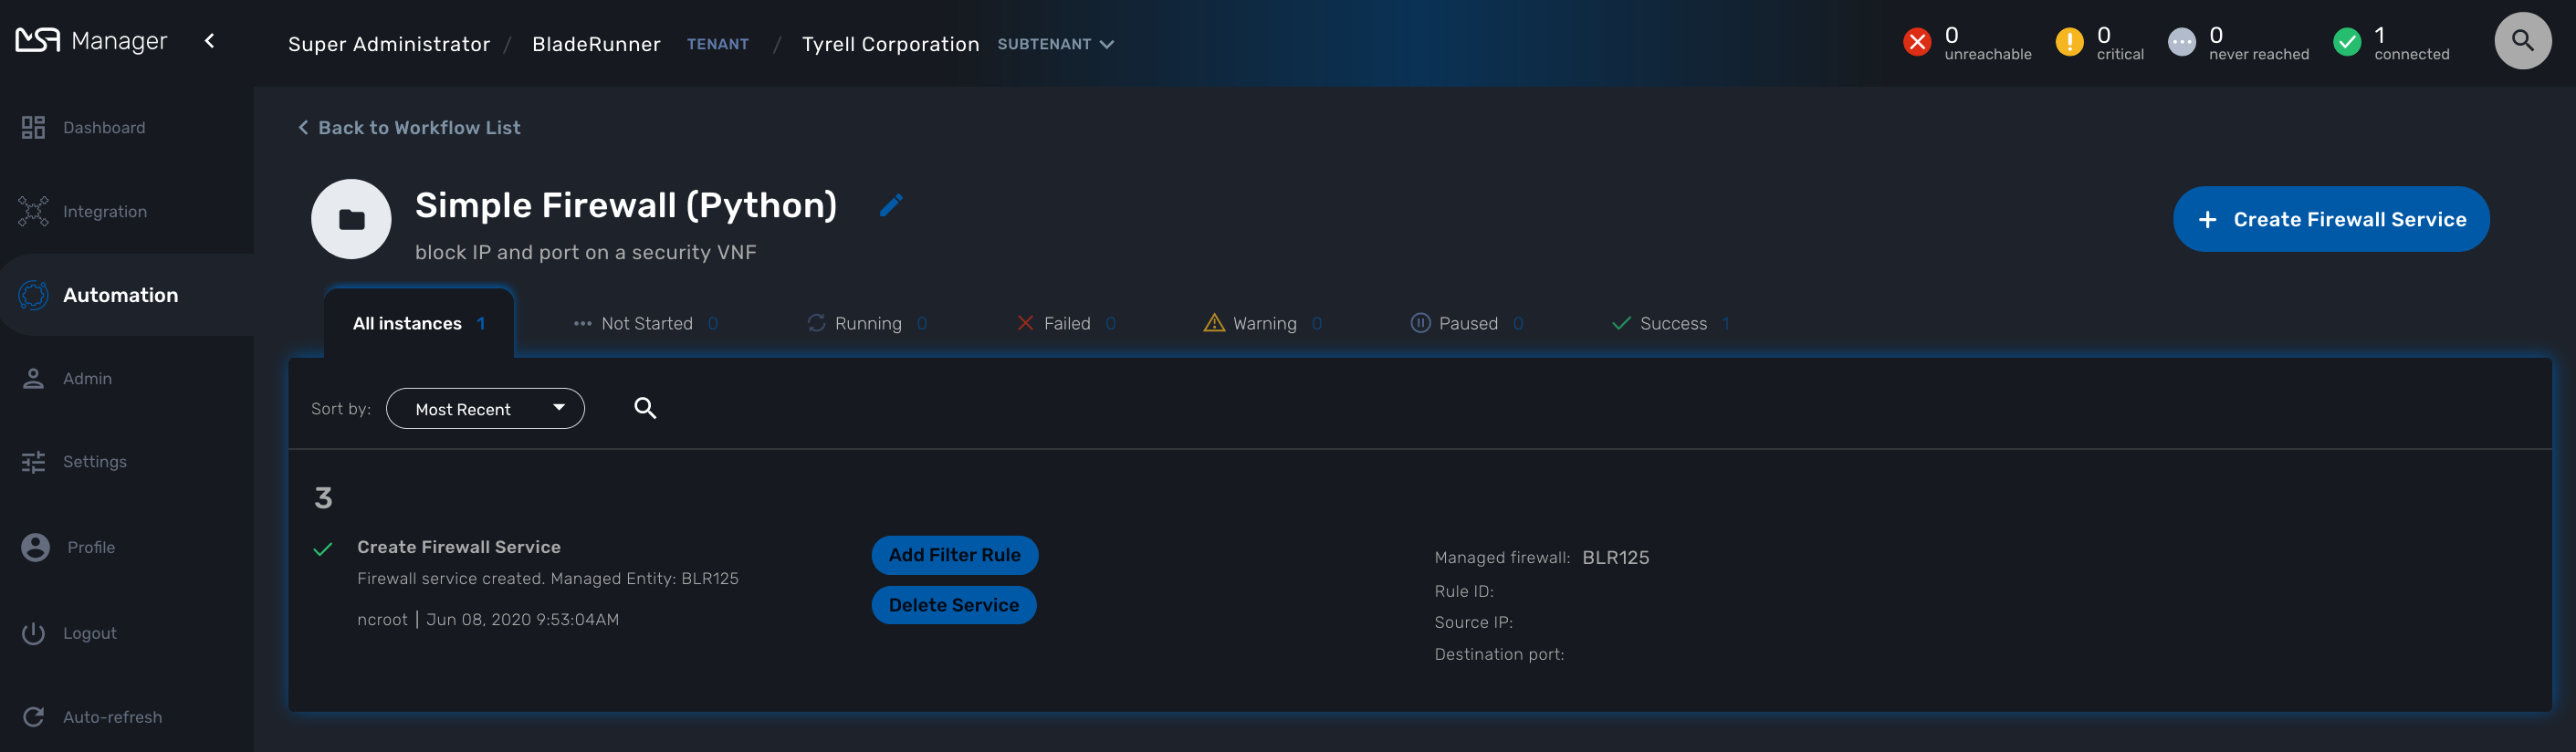
Create a workflow instance and run processes
Use the action on the top right to create a new instance of the workflow, select the actions available on an instance to call the processes available for this workflow.
Instance lifecycle
Before you can start using a workflow, you need to create a new 'instance' of the workflow. (For programmers, this is akin to thinking of using a class to create an object instance in Object-Oriented Programming, or OOP).
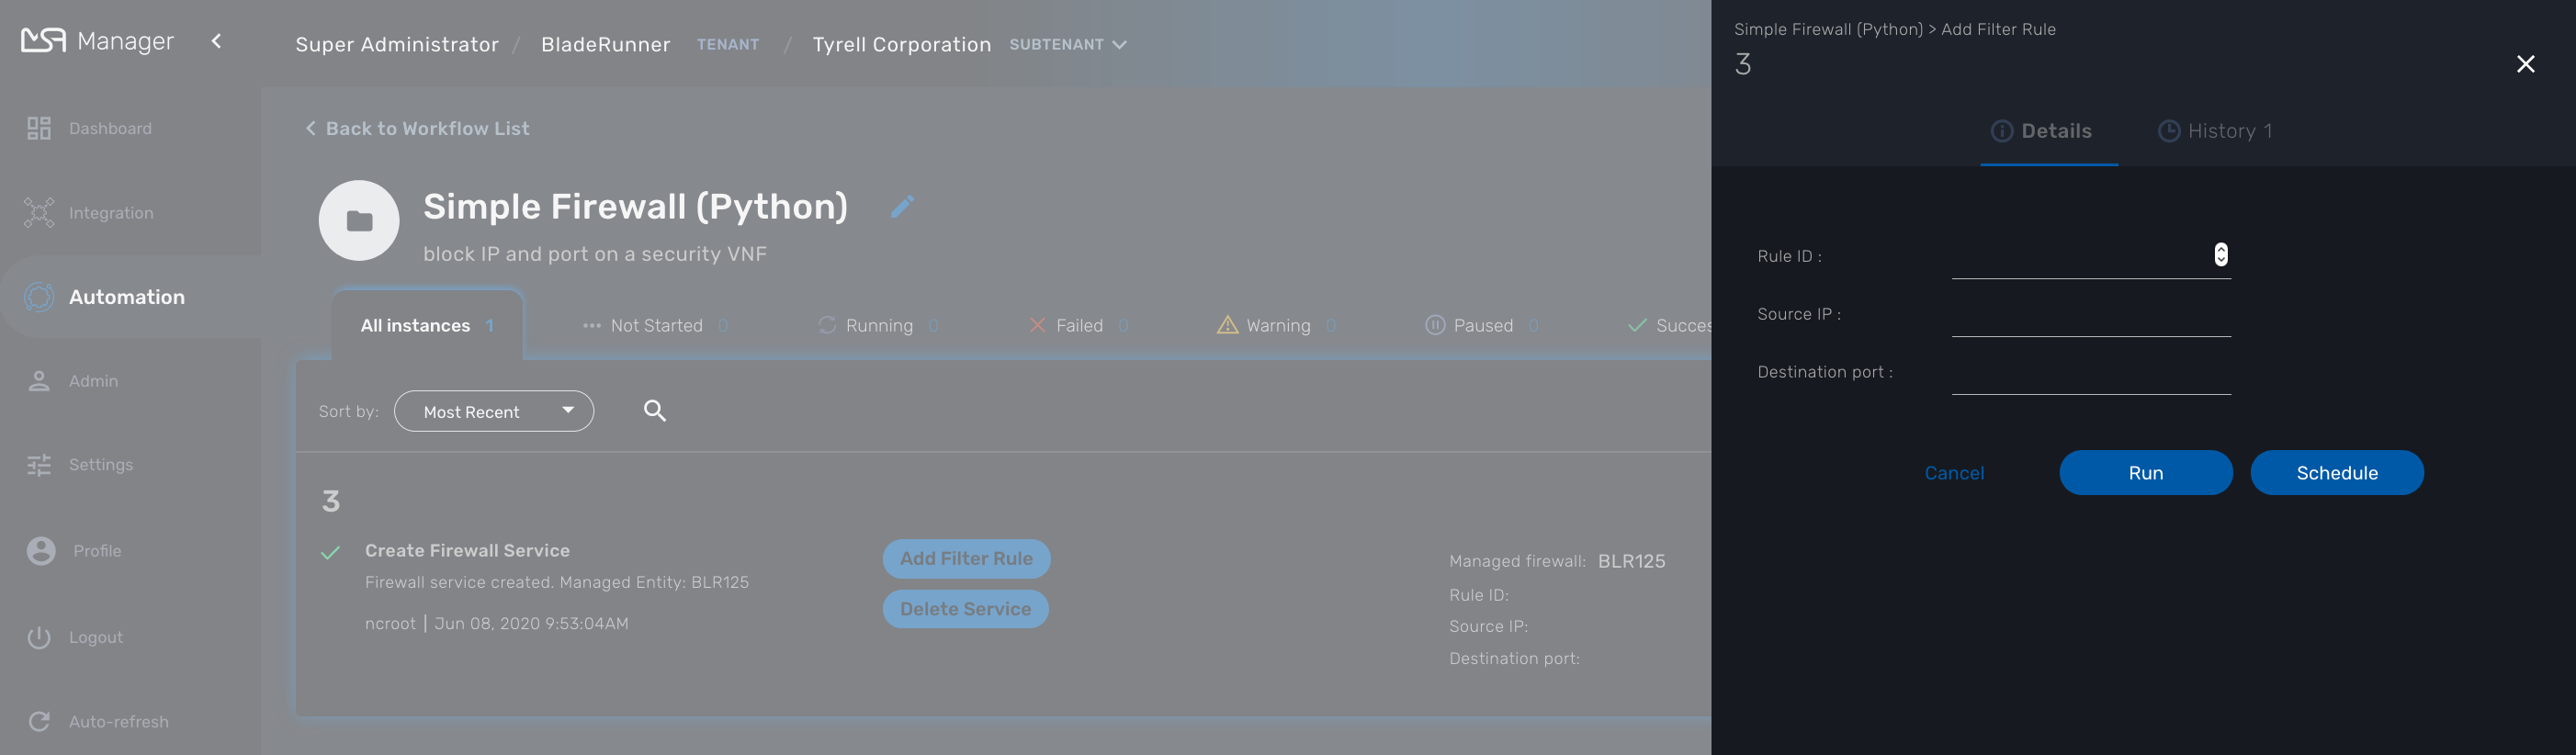
The action on the top right will create a new instance and open a user form where you will be able to provide some parameters related to the creation of the instance (you can think of this as passing a parameter to the constructor in OOP). The form may not always require parameters (this would be the case of the default constructor in OOP).
The example below shows a user form with some network related information, scroll down and click on "Run" to execute the instance creation process.
Once an instance is created, you can execute any process available to either update the instance state and run some automated task or delete the process instance. The process to delete an instance can also execute some automated tasks before removing the instance from the list.
A typical example of a workflow lifecycle is the one to manage VNF on a cloud:
-
CREATE process: the user provide the VNF specific parameters and the process execute to create the VNF on the cloud, create and activate the Managed Entity on the MSactivator™.
-
UPDATE processes: the user can ask for scale up/down or configuration changes of the VNF
-
DELETE process: the VNF is removed as well as any related resources
Process execution logs
During the execution of a process you can view it’s execution logs in the "Logs" tab of the process execution screen.
Process execution scheduling
If a process has been configured to allow scheduling (see documentation about the workflow editor), it is possible to schedule the execution of a process.
A workflow scheduling can be deleted any time from the list of scheduled processes in the Workflow tab "Scheduled Processes"
| Schedule | Execute Every | Pick at least one | Start date | End date |
|---|---|---|---|---|
Once |
NA |
NA |
define when the process should execute |
NA |
Minute |
execution frequency |
NA |
define the start date |
define the end date |
Hourly |
execution frequency |
NA |
define the start date |
define the end date |
Daily |
execution frequency |
Select the week day(s) for execution |
define the start date |
define the end date |
Weekly |
execution frequency |
NA |
define the start date |
define the end date |
Monthly |
execution frequency |
Select the month(s) for execution |
define the start date |
define the end date |
Retry a failed task
During the execution of a process, if a task fails to execute, you have the possibility to retry the execution of the process from the step where the task failed.
You can edit the process parameters before executing the process again.
Get information about workflow instance status
The list of workflow instances can be filtered by the status of the execution of their processes:
-
All Instances: list all the instances
-
Running: list the instances that have a process running
-
Failed: list the instances that had a process execution failure
-
Warning: list the instances where the last process execution ended with a warning
-
Success: list the instances where the last process execution ended successfully
The status of a process and how a process can end with one of the possible statuses is defined by the process, in the tasks.
For each instance, a toolbar is available when you hover your mouse over it.
Each icon will give you some information about the instance:
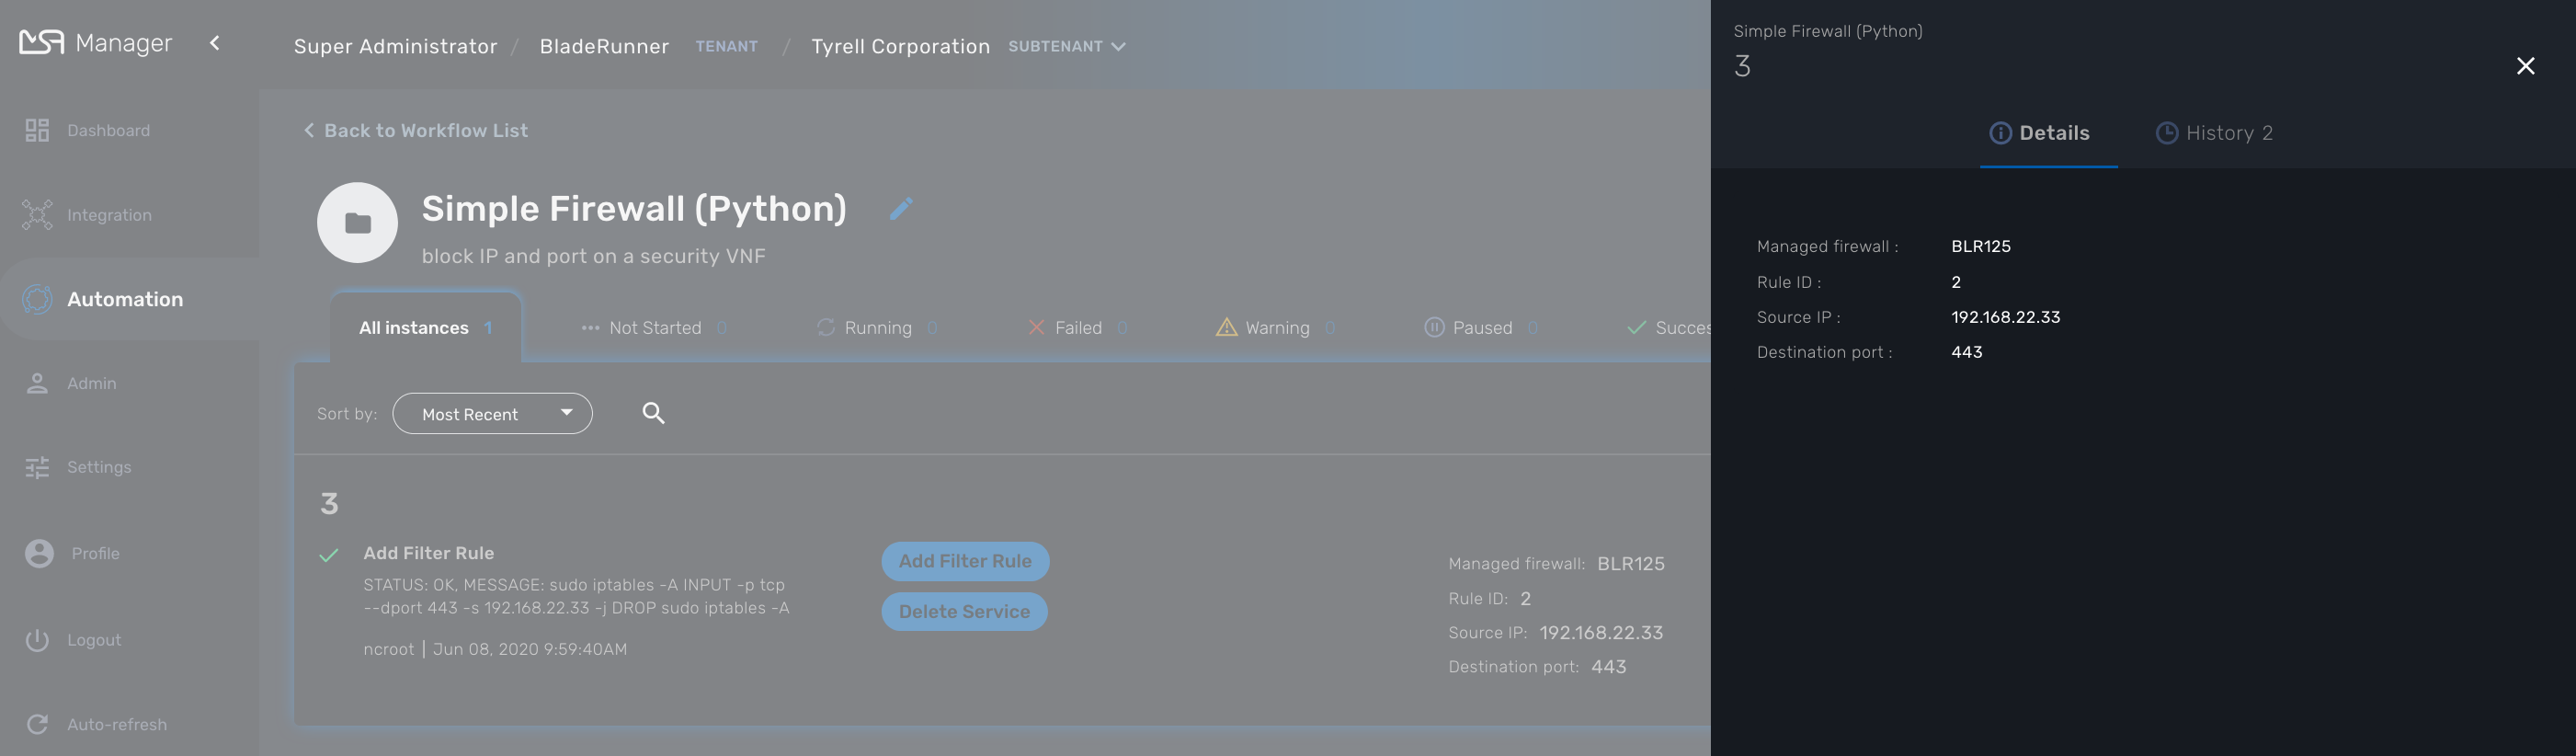
-
Details: lists the Workflow variable and their values. This is the state of the instance.
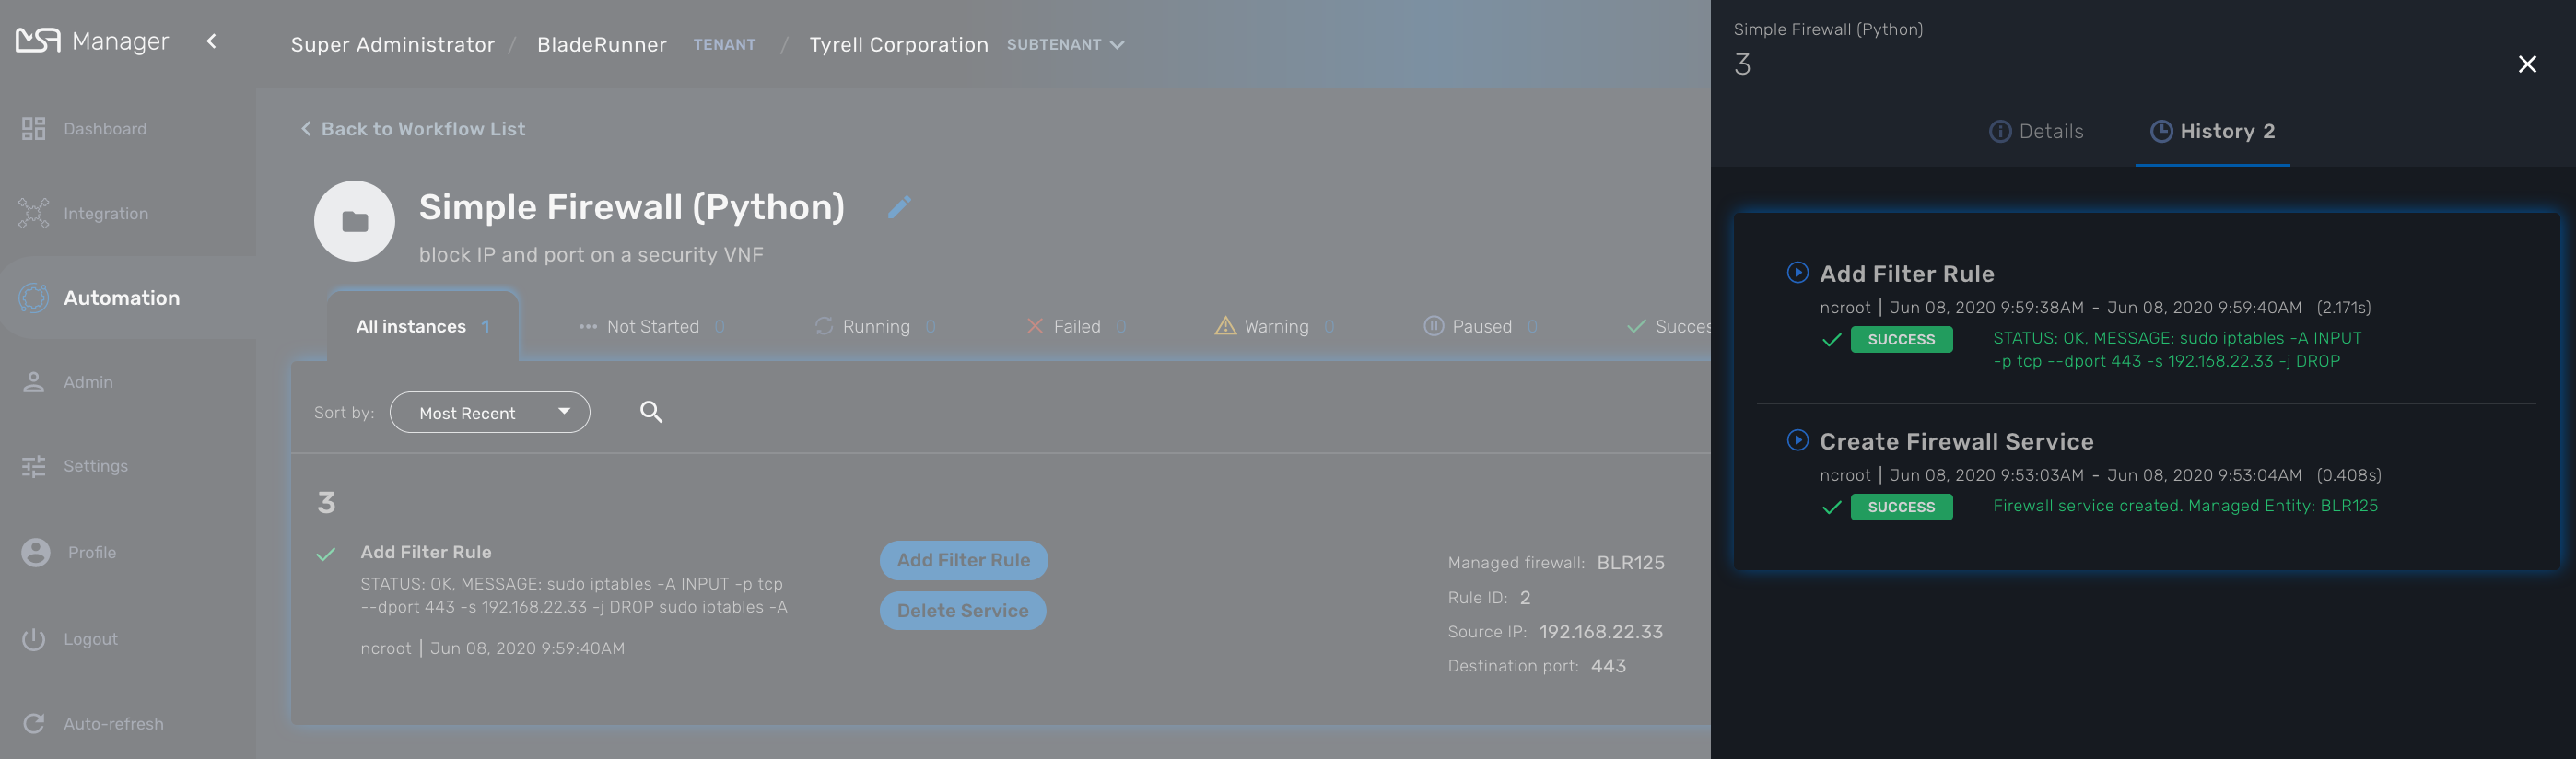
-
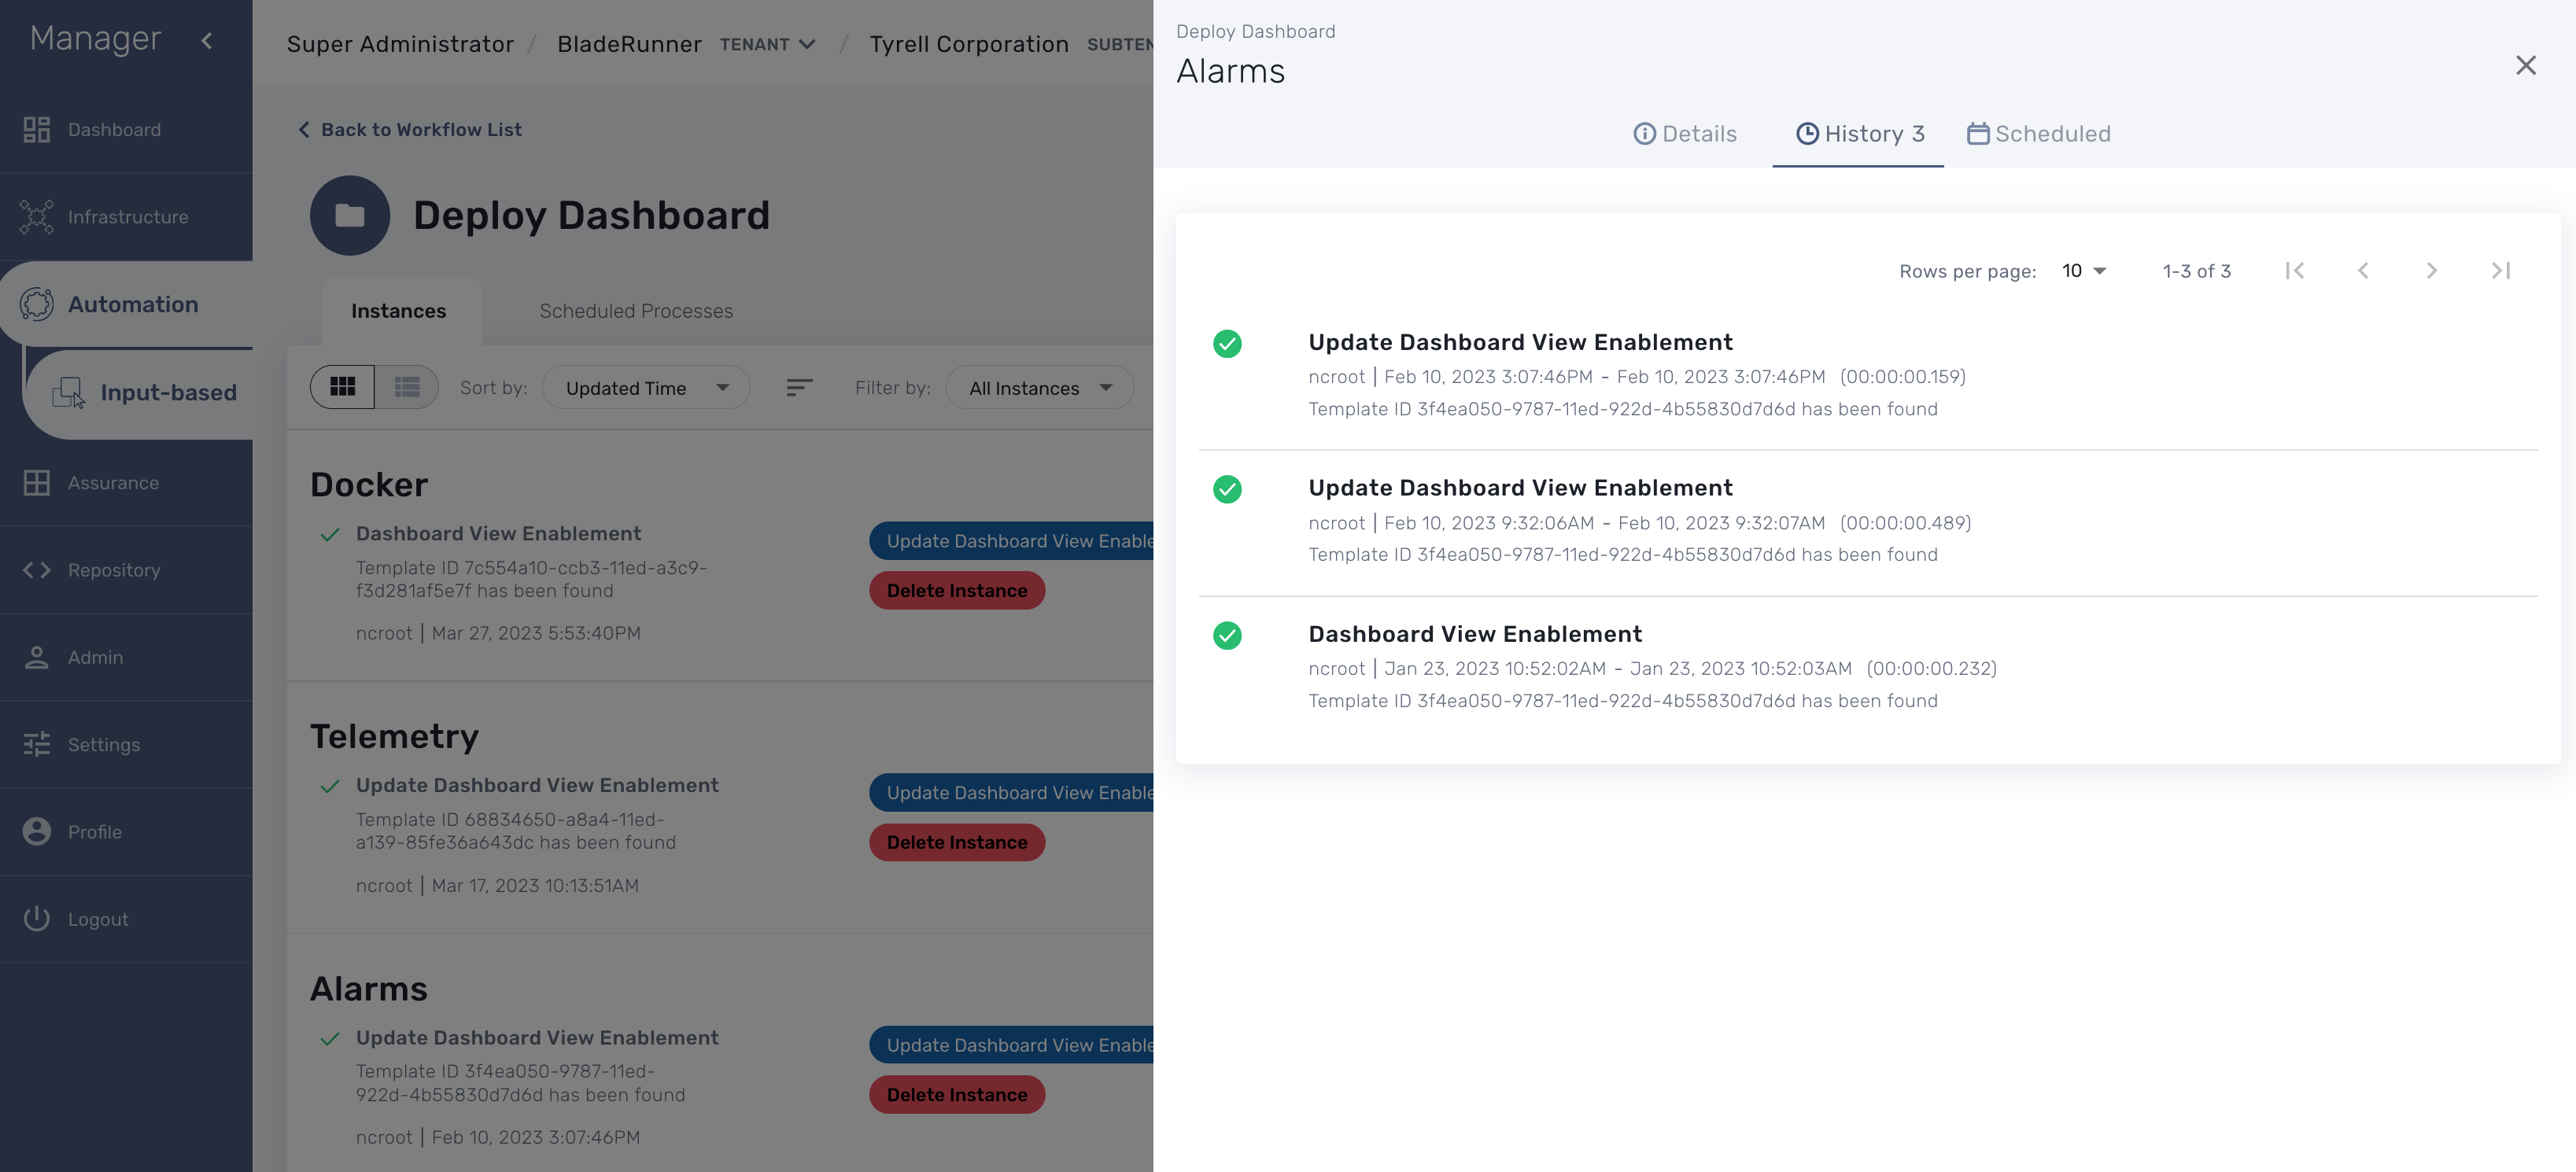
History: lists the processes that were executed. For each process you can get the user that triggered the execution, the start and end time, the status of the execution.
The history will let you audit the process past executions and access all their the details.
Access rights
As privileged administrator (ncroot) or administrator, you have access to multiple tenants and their related subtenants. You can list the workflows that are in used (ie. associated to a subtenant) by clicking on the "Automation" link on the left menu.
As a manager you will only be able to select the subtenant in your tenant.
Workflow design
Workflow design is explained in the developer guide.
Workflows: utilities
Useful workflows to use as is of to extend based on your needs
Managed entities configuration variables
Configuration variables can be associated to any managed entity in order to add custom configuration.
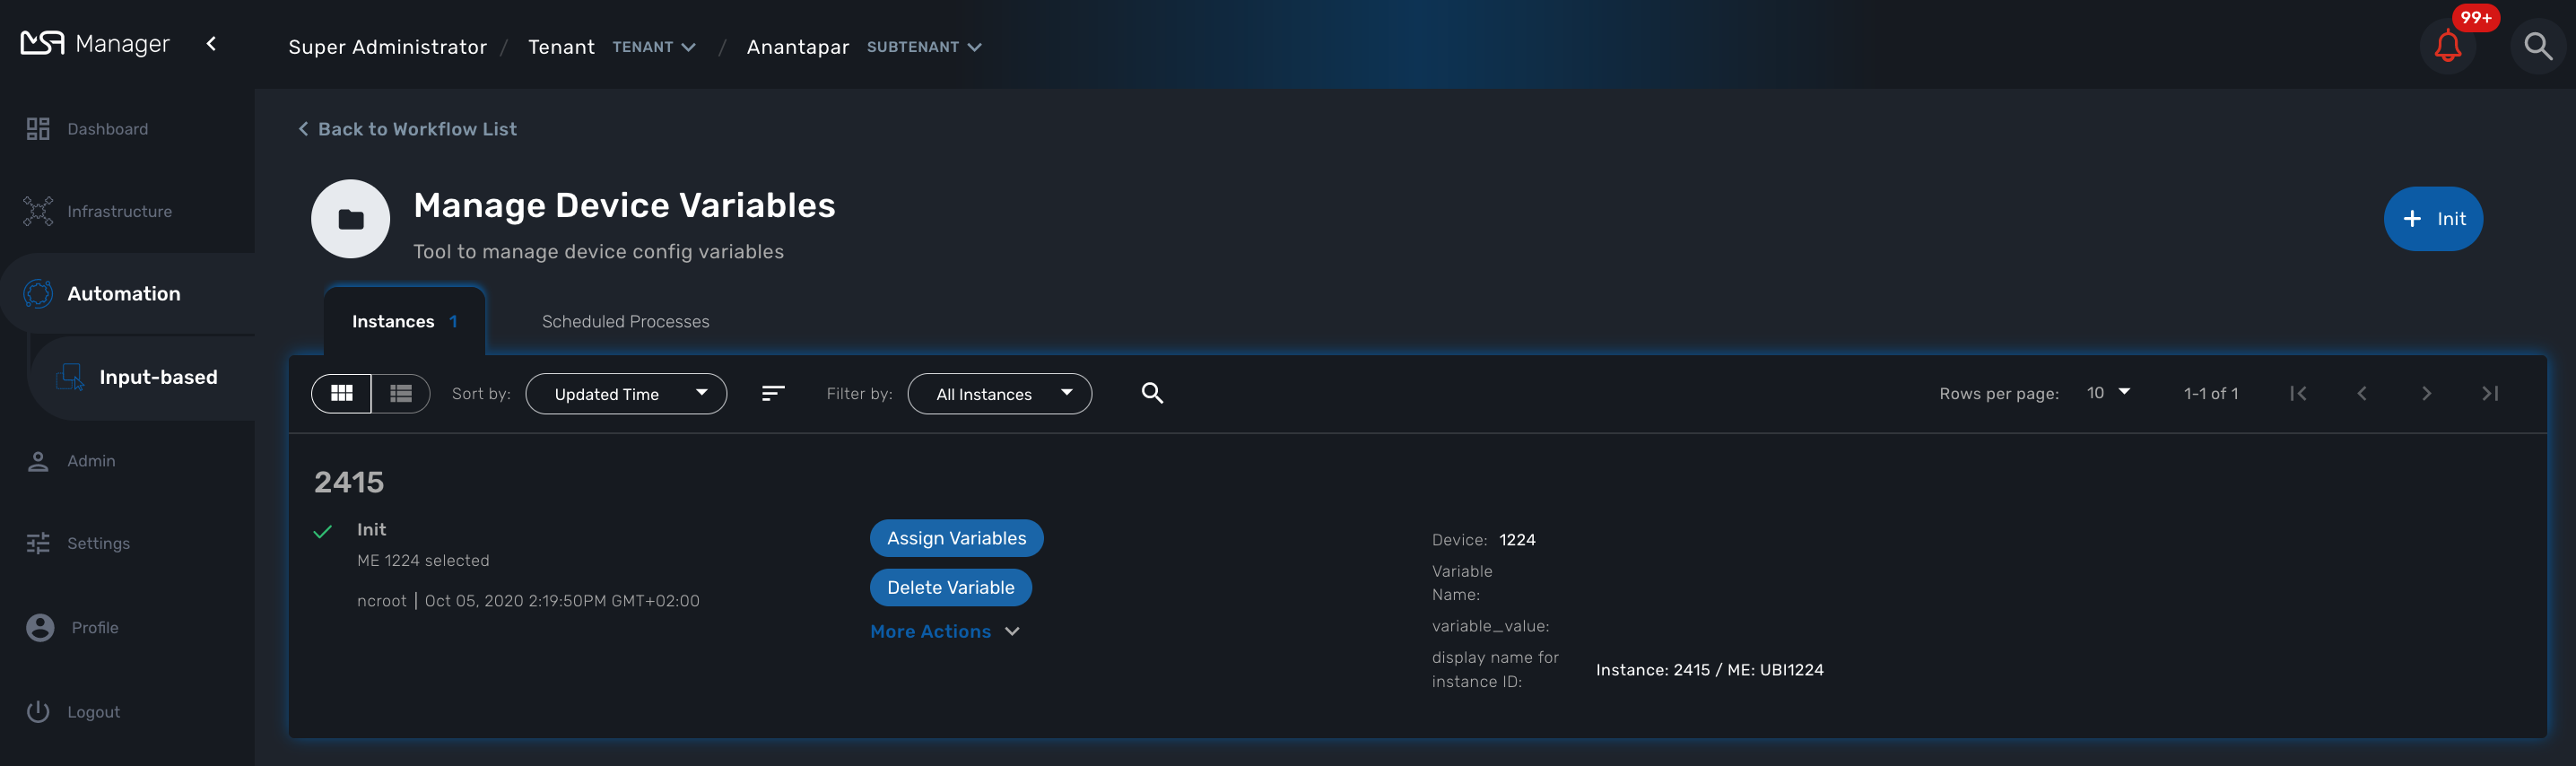
In order to managed these configuration variables, you can use the workflow Manage Device Variables.
The workflow provides a simple UI to create/update/delete and list the configuration variables associated to a managed entity.
To use it, first you need to associate it to your subtenant then execute the process Init to select a managed entity. Init will also read the database for any existing configuration variable.
Once created, you can use the workflow instance to manage the configuration variables.
| If you use the process Delete, the workflow instance will be deleted but it will not delete the configuration variables |
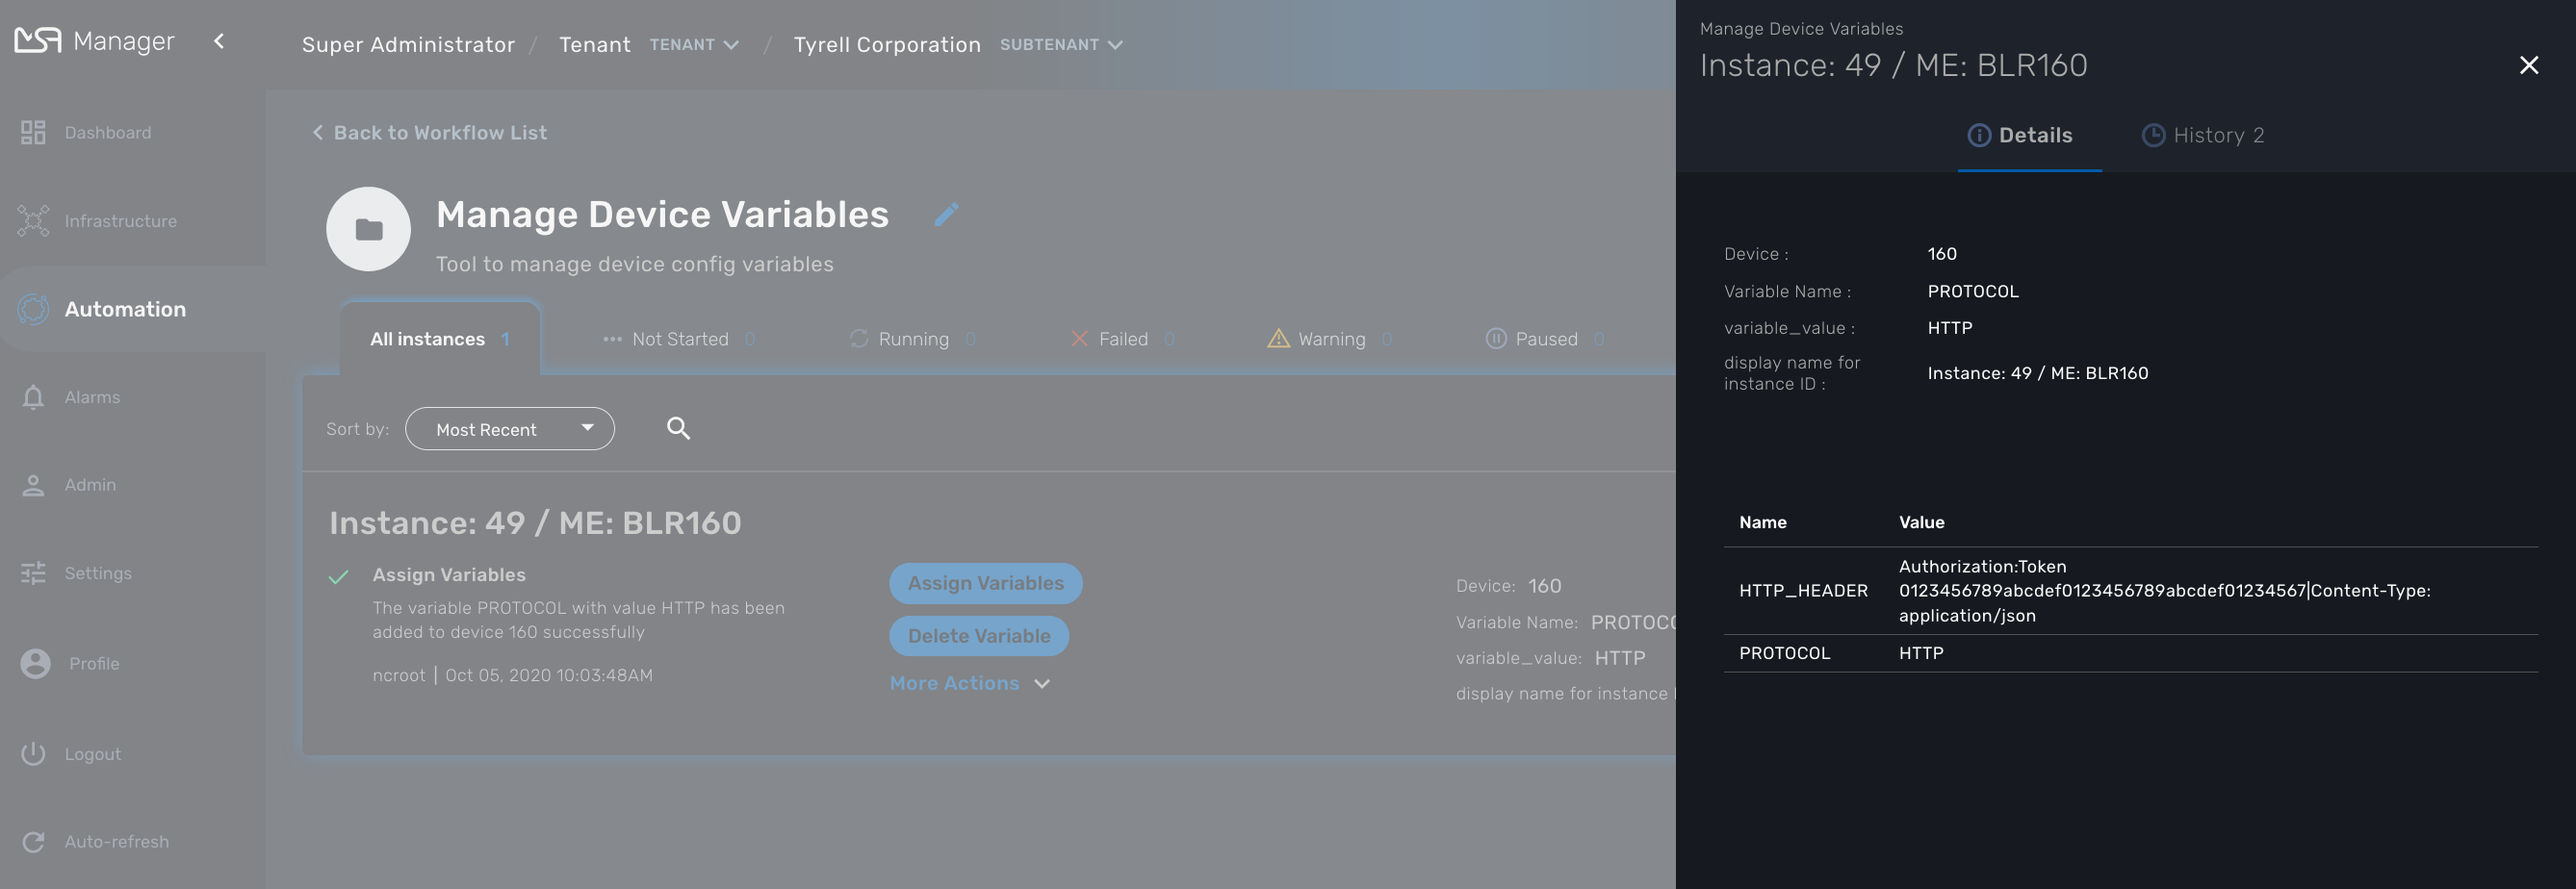
The workflow instance is identified by it’s ID associated to the managed entity ID (ex: Instance: 49 / ME: BLR160 in the screenshot above)
BPM
BPM (Business Process Management) allow the execution of complex business processes by automating a flow of workflow execution.
Overview
The integrated BPM engine can be accessed by clicking the "Automation" link in the left menu.
You need to select a subtenant to see the list of BPM that can be executed for a specific subtenant. BPM definition and instances work in a similar way as for workflows: you first need to associate a BPM to a subtenant and then each execution of a BPM will create a new instance that can be managed.
Use the "i" (information icon) to open a BPM instance and view it’s detailed status.
A BPM instance can be deleted with the "trash" icon.
Execution management
Tracking
The BPM engine will start executing the BPM tasks one by one and the status of the current workflow process execution will be updated live in the view "LATEST EXECUTION RESULT".
Click "Show Tasks" to see the detail of the process execution.
![]()
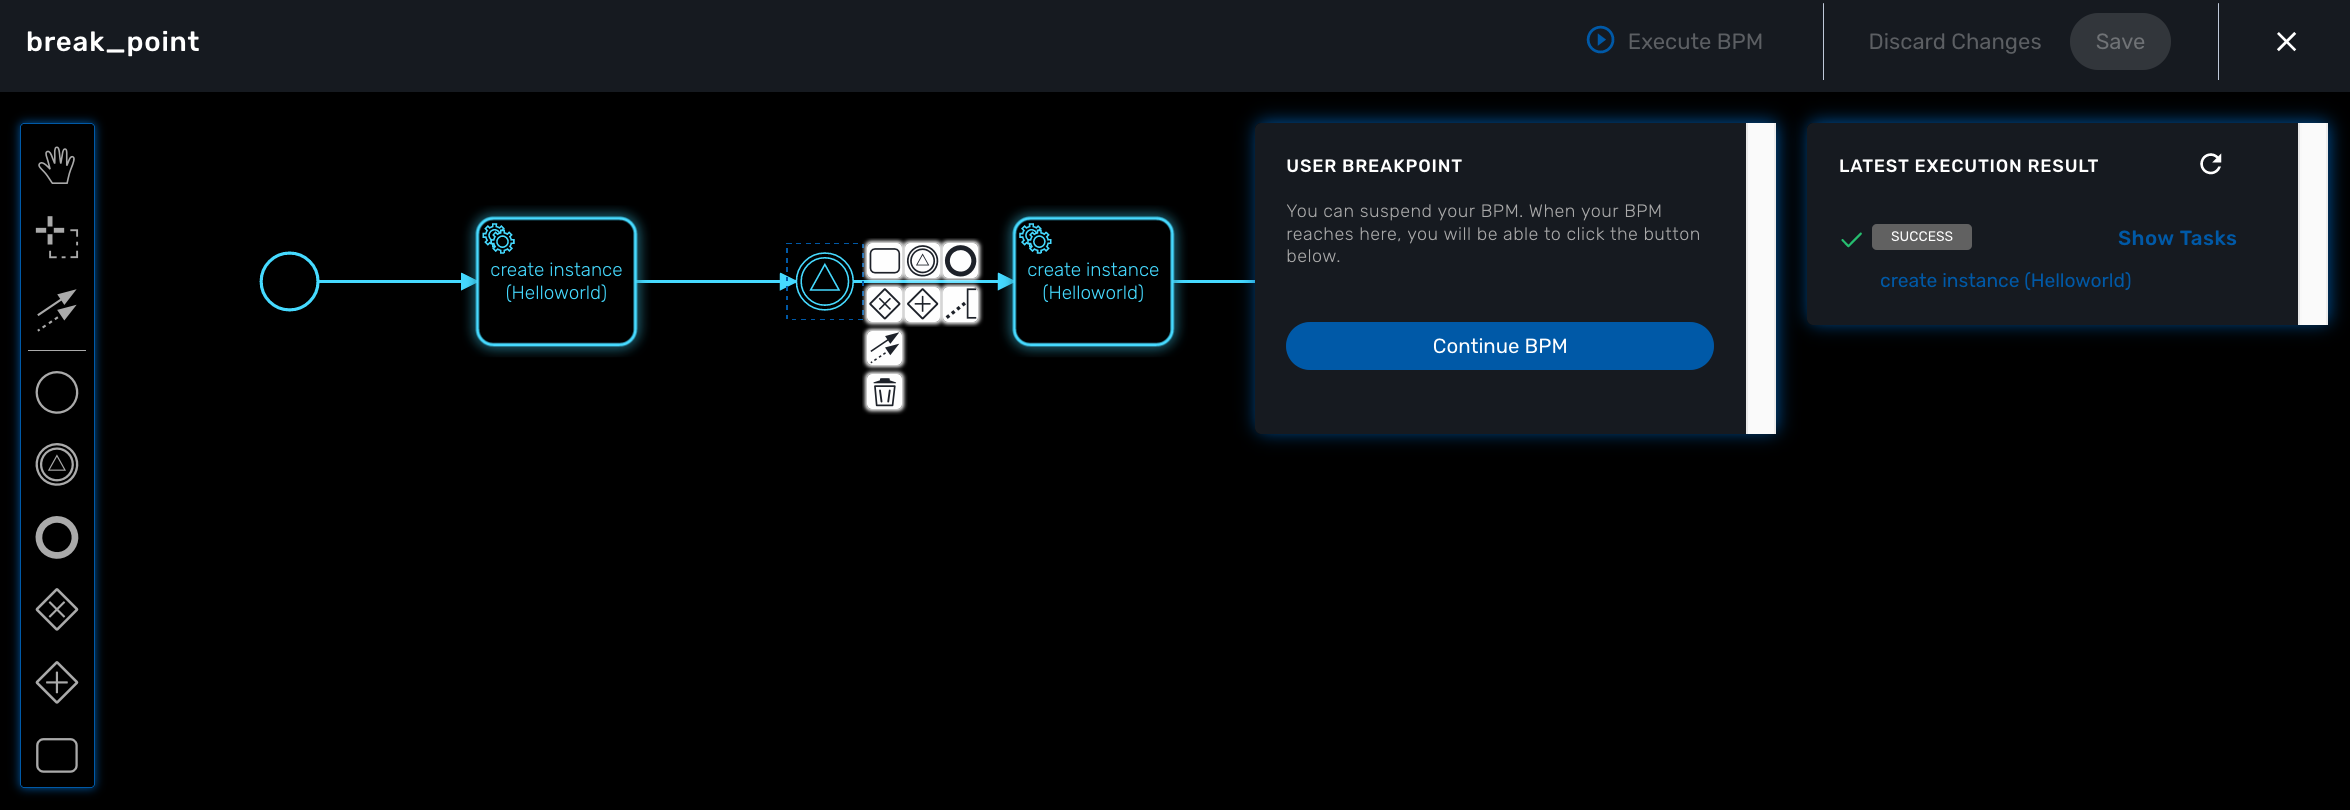
Pause and resume
With the execution breakpoints the execution of a BPM can be paused until the user manually resume the execution
It can be used to execute complex BPM with several part and allow for manual validation of each intermediate steps.
When a BPM execution is paused, the instance will be listed with an empty execution end date.
Terminating
The execution of a BPM can be cancelled any time by clicking on the "Terminate BPM" button at the top right of a BPM execution screen.
Scheduling
The execution of a BPM can be scheduled to run once at a predetermined date or in a recurring way for a predefined duration. The list of scheduled executions is available and any scheduled execution can be canceled
| Schedule | Execute Every | Pick at least one | Start date | End date |
|---|---|---|---|---|
Once |
NA |
NA |
define when the process should execute |
NA |
Minute |
execution frequency |
NA |
define the start date |
define the end date |
Hourly |
execution frequency |
NA |
define the start date |
define the end date |
Daily |
execution frequency |
Select the week day(s) for execution |
define the start date |
define the end date |
Weekly |
execution frequency |
NA |
define the start date |
define the end date |
Monthly |
execution frequency |
Select the month(s) for execution |
define the start date |
define the end date |
Repository
The MSactivator™ repository contains the definition files for the workflows, microservices, BPM and various datafiles. Until version 2.8.3, these files could only be accessed either by the API or manually by connecting to the msa-dev container and using the CLI. These files are store under /opt/fmc_repository/
With version 2.8.3, you can use the UI to upload, delete, unzip and edit files in the DataFiles part of the repository. This feature is available for both developers and managers.
File upload
File will be uploaded based on the selected subtenant, therefore you need to select a subtenant in order to activate the upload button.
Settings
The settings screen provides information on the current version of your MSactivator™ version. This is also where you can upload and activate your product licence.
Details about license activation is available in the admin guide.